Reverse Debugging has a cool nickname – Time Travel Debugging. Yes, you read that right, it’s time travel debugging! Just looking at the name, you can tell how amazing it is! To explain it clearly, this article is quite long, so please read patiently; it won’t disappoint you!
Introduction
When debugging programs, have you encountered the following situations:
-
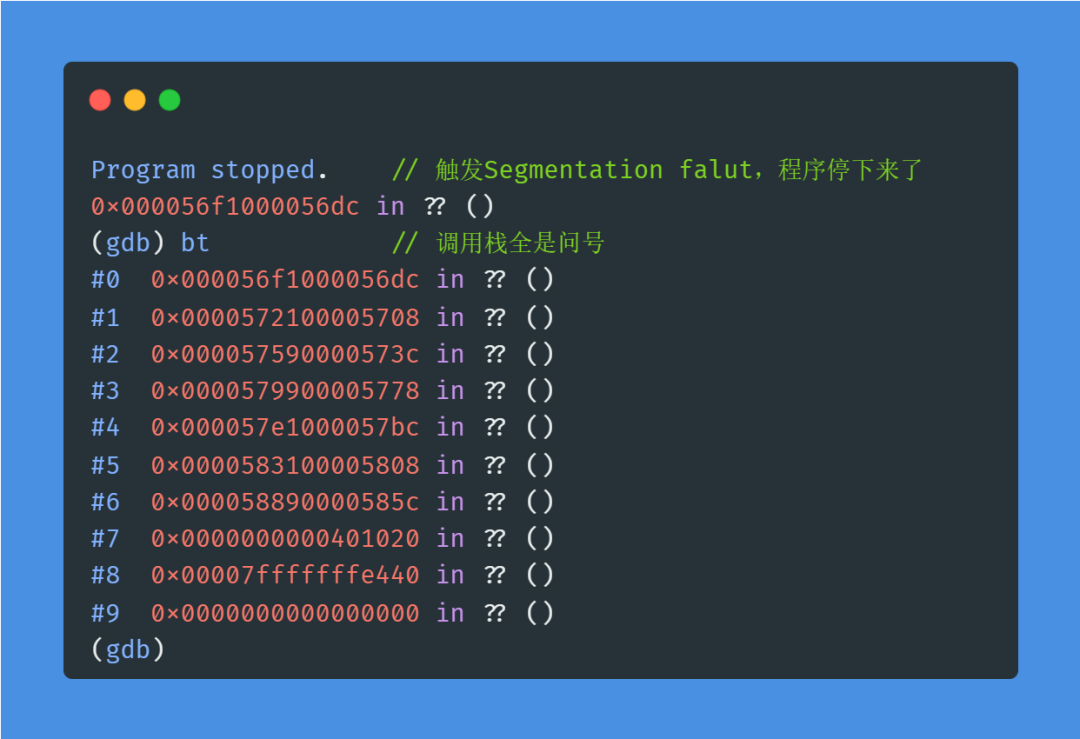
• Tracking program execution in GDB, and when a segmentation fault occurs, the backtrace shows all question marks (of course, the -g option was already added during compilation), leaving you clueless.
-
• When debugging a logically complex program, you suddenly find some anomalies at a certain point, such as an incorrect variable value. You want to check what this variable’s value was at some point earlier, so you have to interrupt debugging and restart the program from the beginning.
-
• When debugging multithreaded programs, often due to setting breakpoints and other reasons, the normal execution order of threads is altered, making it difficult to reproduce issues, requiring repeated debugging to reproduce.
-
• Identifying that the problem occurs in a certain function, but this function is called multiple times from various places, even from multiple threads. Setting breakpoints in this function causes the program to frequently interrupt execution, and these triggered breakpoints are not what you want.
This article will introduce a simple and effective debugging method for the above situations – reverse debugging.
Before formally introducing reverse debugging, let’s look at an example to demonstrate just how powerful reverse debugging can be!
The Power of Reverse Debugging – Solving the All-Question-Mark Backtrace Issue
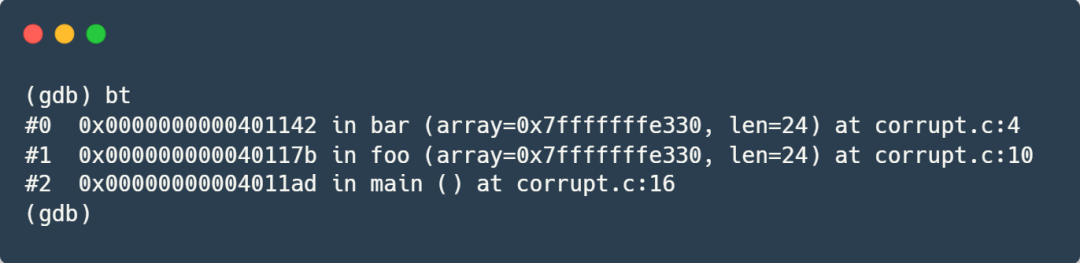
The test code in this article will trigger a segmentation fault during normal execution, and the backtrace shows all question marks (the -g option was certainly added during compilation!):
Using the reverse debugging method introduced in this article, after a simple debug, we can display the caller correctly without modifying the code or recompiling, easily finding the root cause!
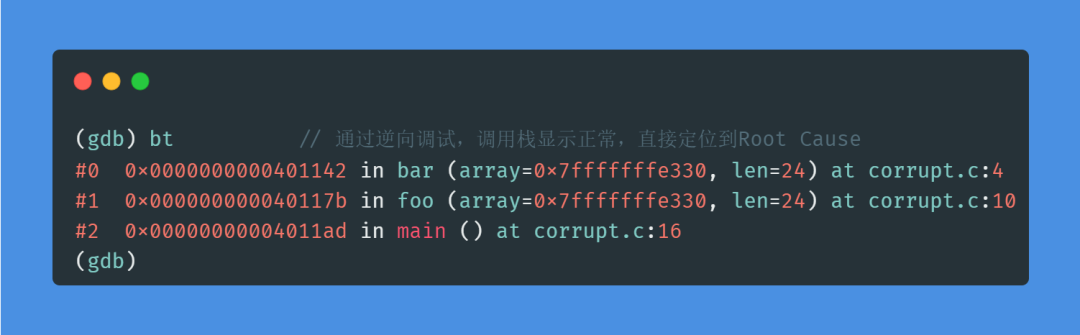
Isn’t that amazing? This is just the tip of the iceberg of reverse debugging’s power! Next, let’s start the formal introduction of reverse debugging!
What Is Reverse Debugging?
Reverse debugging is an advanced debugging technique that allows a program to revert to a previous state after it has been running for a while and re-execute. This means you can return to any point in program execution to check variable values, stack traces, and execution paths. Reverse debugging enables us to quickly and accurately locate the root cause of errors or exceptions in the program.
In simple terms, it is a debugging technique that allows the program logic to execute in reverse order. Through it, you can interrupt normal program execution at any time and then let it execute in reverse, allowing you to view any information at any point in time.
Let’s intuitively feel this through a simple example.
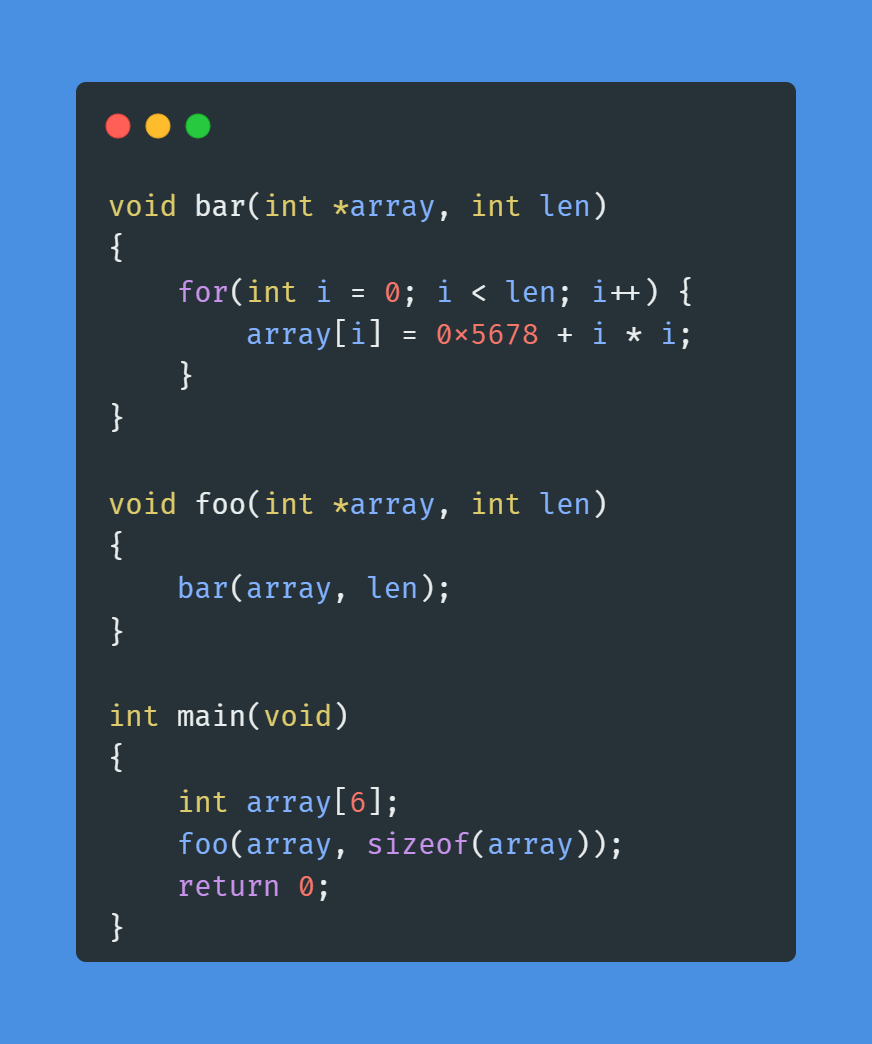
The source code is shown in the image:
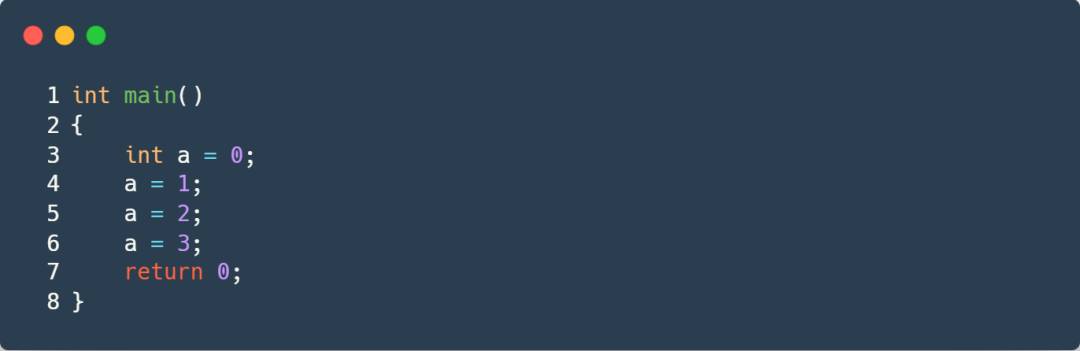
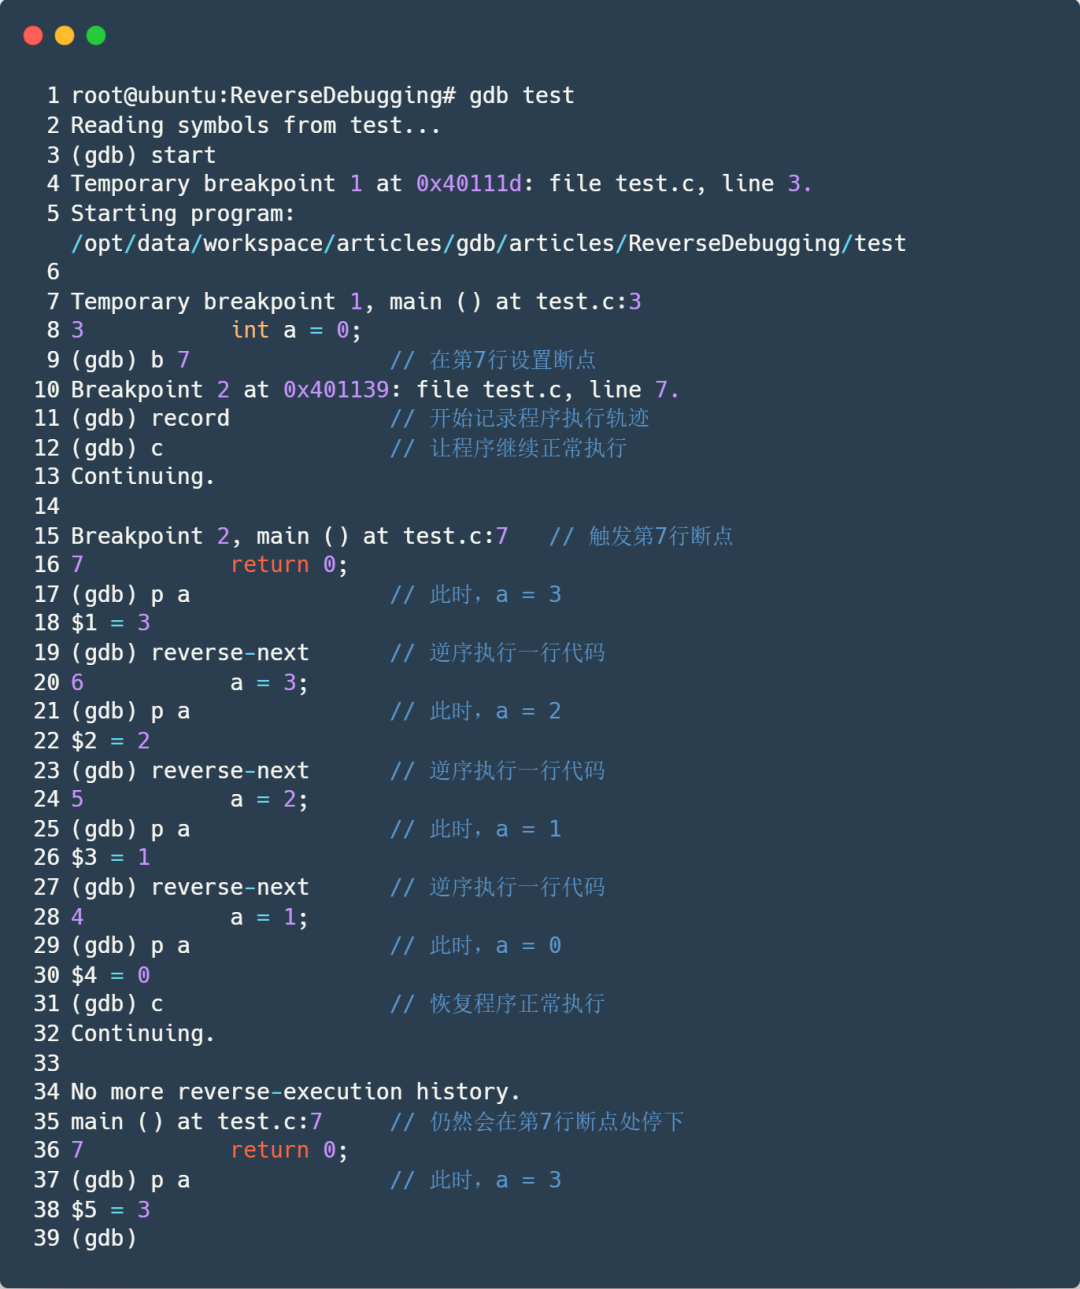
Start the program in GDB and stop at the program entry point, setting a breakpoint at line 7 to pause the program for reverse debugging.
root@ubuntu:ReverseDebugging# gdb test
Reading symbols from test...
(gdb) start
Temporary breakpoint 1 at 0x40111d: file test.c, line 3.
Starting program: /opt/data/workspace/articles/gdb/articles/ReverseDebugging/test

Temporary breakpoint 1, main () at test.c:3
3           int a = 0;
(gdb) b 7
Breakpoint 2 at 0x401139: file test.c, line 7.
Execute the record command to start recording the program’s execution trajectory.
(gdb) recordExecute the c (continue) command to let the program run normally, and then it will stop at line 7 when the breakpoint is triggered.
(gdb) c
Continuing.

Breakpoint 2, main () at test.c:7
7           return 0;
At this point, check the value of a, which should be a = 3.
(gdb) p a
$1 = 3
Execute the reverse-next command to let the program execute one line of code in reverse.
(gdb) reverse-nextTo be precise, this command’s function is to revert the program to the state just after executing line 5, before executing line 6. At this point, check the value of a; if all goes well, it should be 2. Let’s verify:
(gdb) p a
$2 = 2
Indeed, the effect of executing line 6 has been completely reverted. We execute another reverse-next command; at this point, it should revert the effect of line 5.
(gdb) reverse-next
5           a = 2;
At this point, the program’s state has been reverted to just after executing line 4, before executing line 5; a should be 1. Let’s verify:
(gdb) p a
$3 = 1
Then, revert the effect of line 4, restoring the program state to just after executing line 3, before executing line 4:
(gdb) reverse-next
4           a = 1;
(gdb) p a
$4 = 0
At this point, everyone should understand that the reverse-next command’s function is to restore the program to the state just after the previous line of code was executed. Of course, we can still let the program execute in normal order:
(gdb) c
Continuing.

No more reverse-execution history.
main () at test.c:7
7           return 0;
(gdb) p a
$5 = 3
(gdb)
Let’s review the entire debugging process to deepen our understanding:
Principle of Reverse Debugging
The core principle of reverse debugging technology is, simply put, to record every instruction’s effect on the program’s execution state, including changes in variables, registers, and memory data, and store this information in a history file. When it is necessary to revert to a past state, the debugger will restore these states in reverse order, allowing the program’s execution state to return to any recorded time point.
Therefore, reverse debugging also has an elegant name – Time Travel Debugging.
Using GDB for Reverse Debugging
GDB, as a powerful debugging tool under Linux, has supported reverse debugging functionality for a long time. Common commands include:
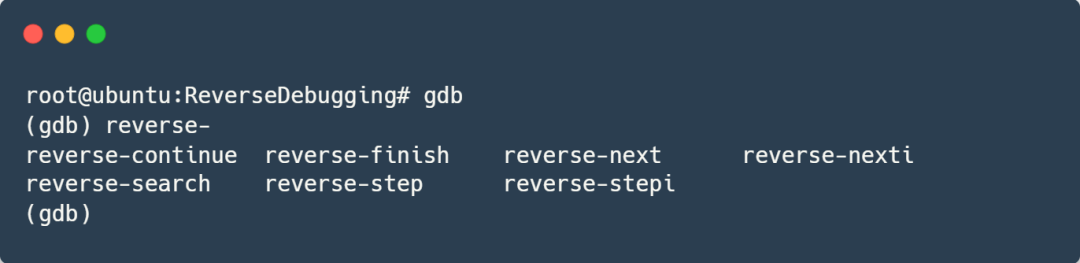
Let me briefly explain:
- reverse-next(rc): Similar to next(n), executes one line of code in reverse, does not enter function calls
- reverse-nexti(rni): Similar to nexti(ni), executes one instruction in reverse, does not enter function calls
- reverse-step(rs): Similar to step(s), executes one line of code in reverse, enters function calls
- reverse-stepi(rsi): Similar to setpi(si), executes one instruction in reverse, enters function calls
- reverse-continue(rc): Similar to continue(c), continues execution in reverse
- reverse-finish: Similar to finish, executes in reverse until the function entry
- reverse-search(): Similar to search, searches in reverse
- set exec-direction reverse: Sets the program to execute in reverse; after this command, all common commands like next, nexti, step, stepi, continue, finish, etc., will execute in reverse
- set exec-direction forward: Sets the program to execute in the forward direction, which is also the default setting
In most environments, before using these reverse debugging commands, you must first use the record command to let GDB record all state information during the program’s execution.
Typically, after starting the program, set a breakpoint to stop the program, then enter the record command to start recording state information, and then continue execution. Common related commands include:
- record: Records all state information during program execution
- record stop: Stops recording state information
- record goto: Jumps the program to a specified position, e.g., record goto start, record goto end, record goto n
- record save filename: Saves the program's execution history state information to a file, default name is gdb_record.process_id
- record restore filename: Restores state information from the history record file
- show record full insn-number-max: Views the maximum number of instructions that can be recorded for execution state information, default is 200000
- set record full insn-number-max limit: Sets the maximum number of instructions that can be recorded for execution state information
- set record full insn-number-max unlimited: Records the execution state information for all instructions
There are other less commonly used commands, which will not be elaborated on here. Interested readers can check the GDB help documentation.
Next, let’s delve into the utility of reverse debugging and how to use it.
What Is the Use of Reverse Debugging?
Reverse debugging is particularly useful in locating the following types of issues:
-
• Hard-to-reproduce bugs
-
• Logically complex problems
-
• Multithreaded concurrency issues
-
• Memory-related issues, such as memory corruption, memory leaks, double frees, etc.
-
• Issues where the backtrace shows all question marks
Now, let’s take the issue of the backtrace showing all question marks as an example to demonstrate the use of reverse debugging.
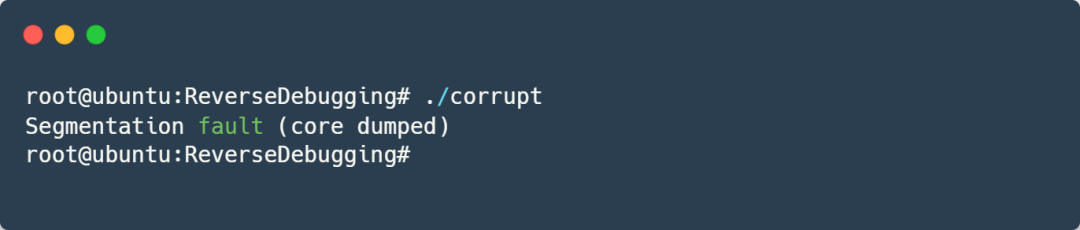
Example: All Question Marks in Backtrace During Segmentation Fault
The program will encounter a segmentation fault during normal execution:
A core dump is produced by default; directly debugging the core in GDB shows a backtrace:
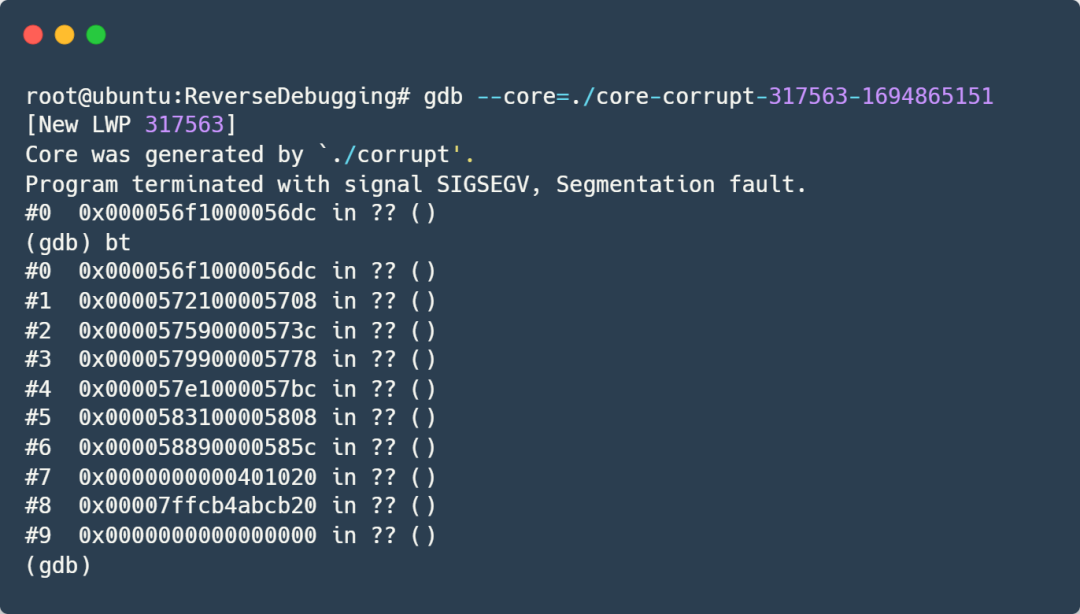
It’s all question marks! (Note: The -g option was already added during compilation)
Let’s run it directly in GDB:
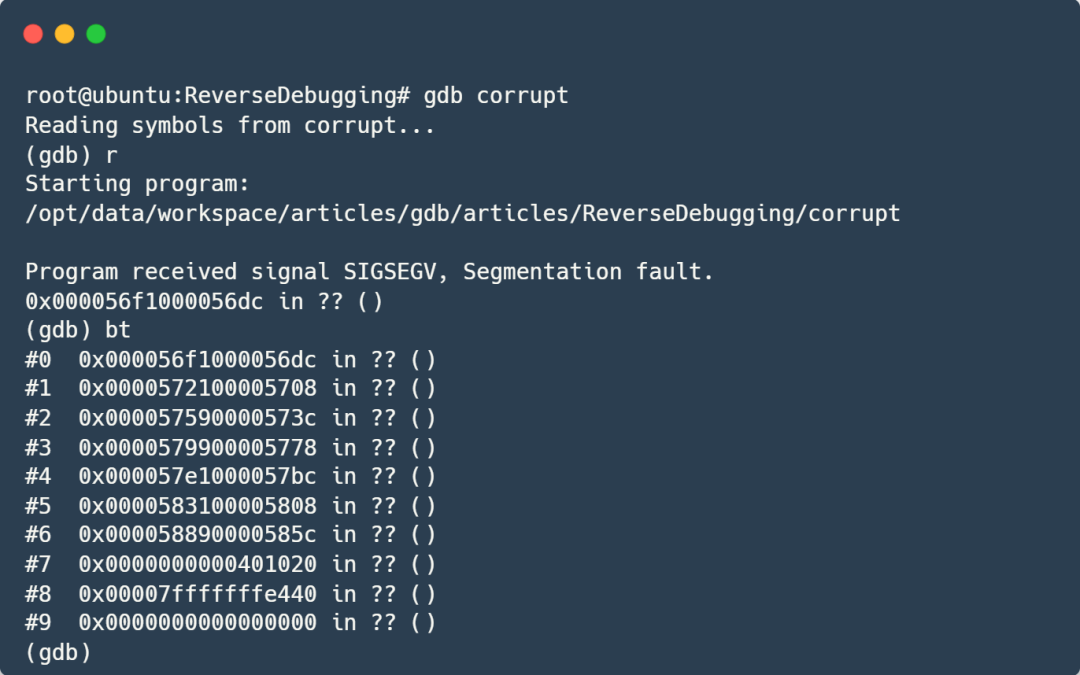
Still all question marks! What should we do now?
Feeling a bit anxious? Stay calm! Let’s analyze it first!
Analysis
Since the backtrace shows all question marks, let’s analyze this phenomenon.
We know that the backtrace (bt) function is used to obtain the function call relationship at the current position of the program. The function call relationship is derived based on the stack frame structure, starting from the deepest function and working upwards. In simple terms, it retrieves the return addresses of functions from the stack layer by layer, finding the corresponding function names and line numbers from the ELF debug information based on these return addresses. (The function stack frame structure is not the focus of this article, and due to space limitations, I won’t elaborate further. Interested friends can add me on WeChat CreCoding to discuss.)
Now, since the backtrace prints all question marks, it indicates that GDB cannot access the required information, meaning that the data in the stack has been corrupted!
So, let’s think about how we can locate where the stack data was corrupted?
Using printf? No! No explanation!
Directly step-debugging? For programs with a small amount of code and simple logic, this is a feasible debugging method, but it is not efficient and often requires repeated guessing and restarting the program to find the real root cause. No!
Direct data breakpoints? It seems to be the simplest and most effective, but the problem is, which address should we set the breakpoint on? Moreover, if the program modifies the data at this address repeatedly during normal execution? No!
Reverse debugging? We let the program run normally until it triggers the segmentation fault. Since we have determined that stack data is corrupted, we can directly set a data breakpoint on the stack, and then let the program execute in reverse. The first place that triggers the data breakpoint will definitely be the code that wrote the erroneous data to this stack address, which is the culprit that corrupted our stack data! Yes! Yes!
We have our idea, Let’s Go!
Using Reverse Debugging for Location
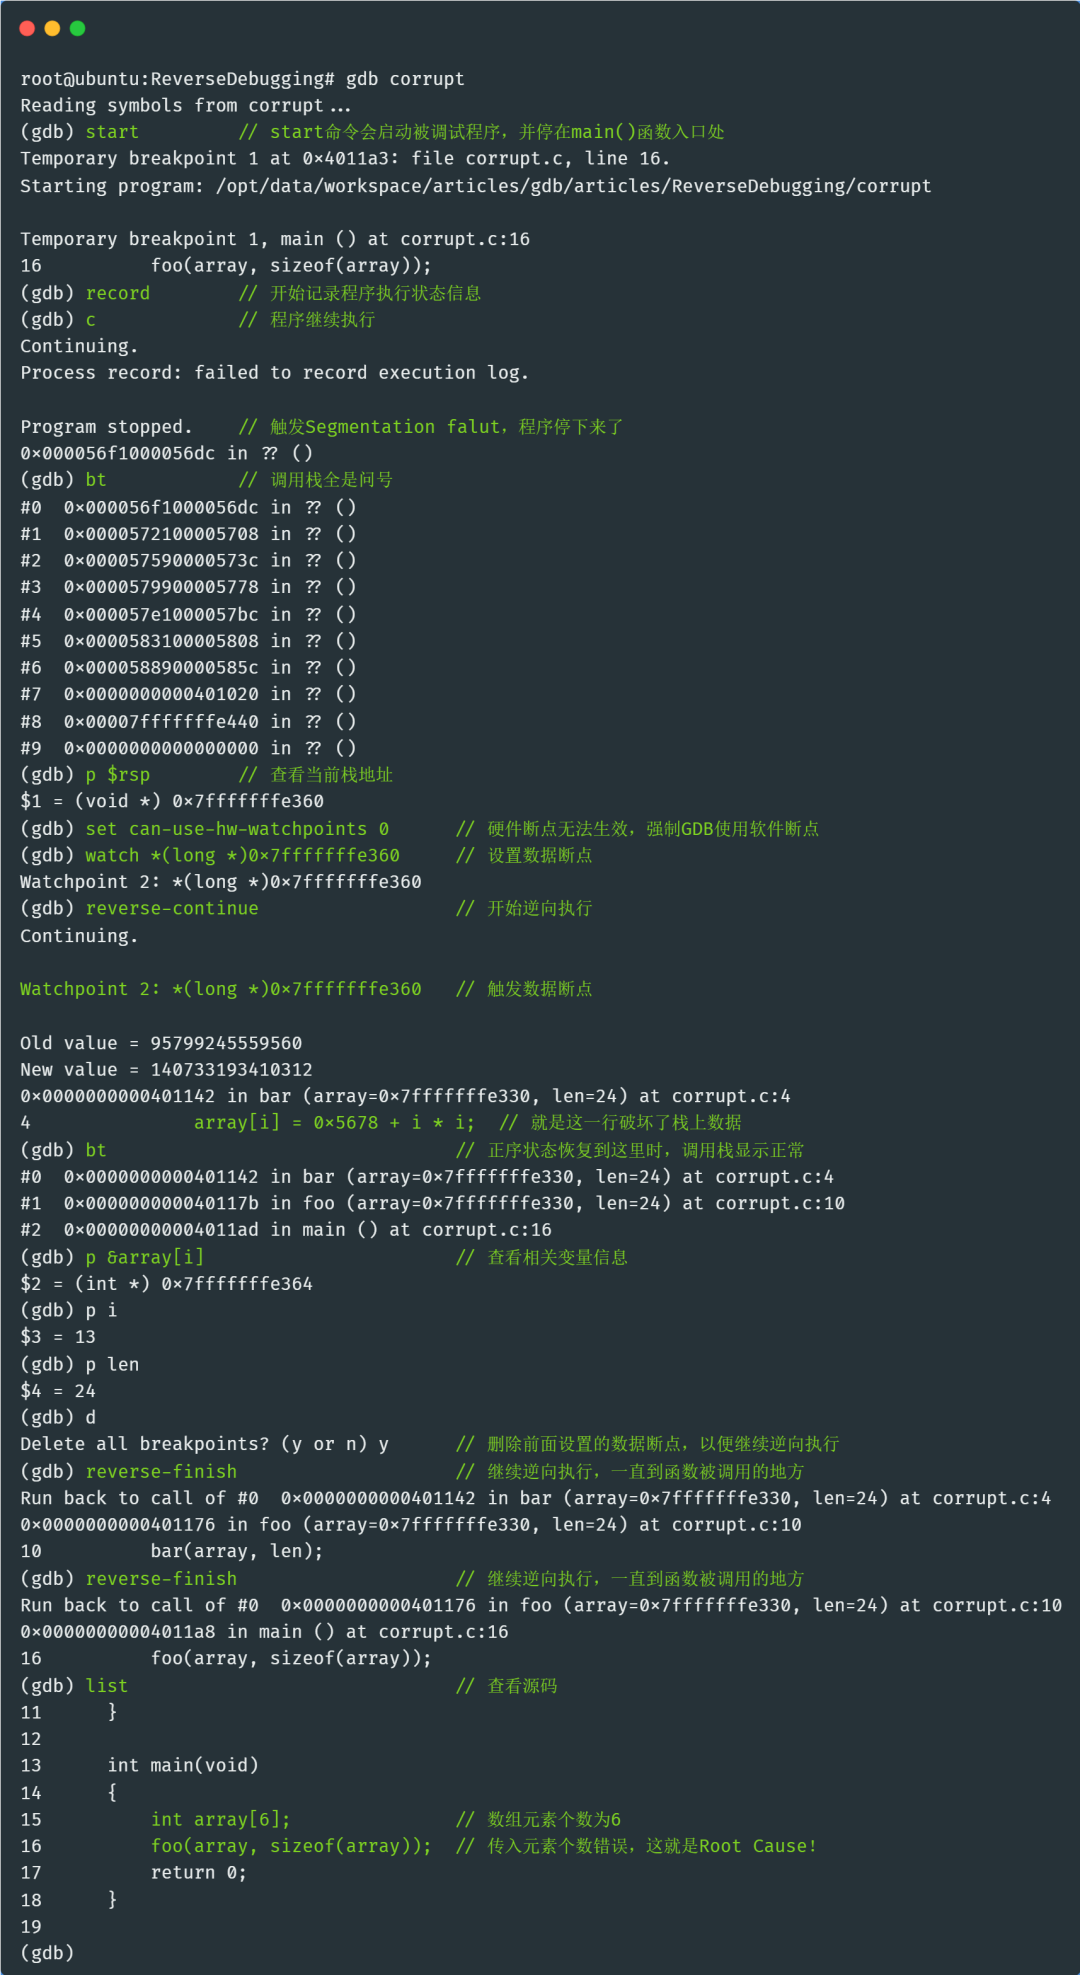
Run the program again in GDB, using the record command to start recording the state information during the program’s execution, and then let the program run normally until it encounters the segmentation fault:
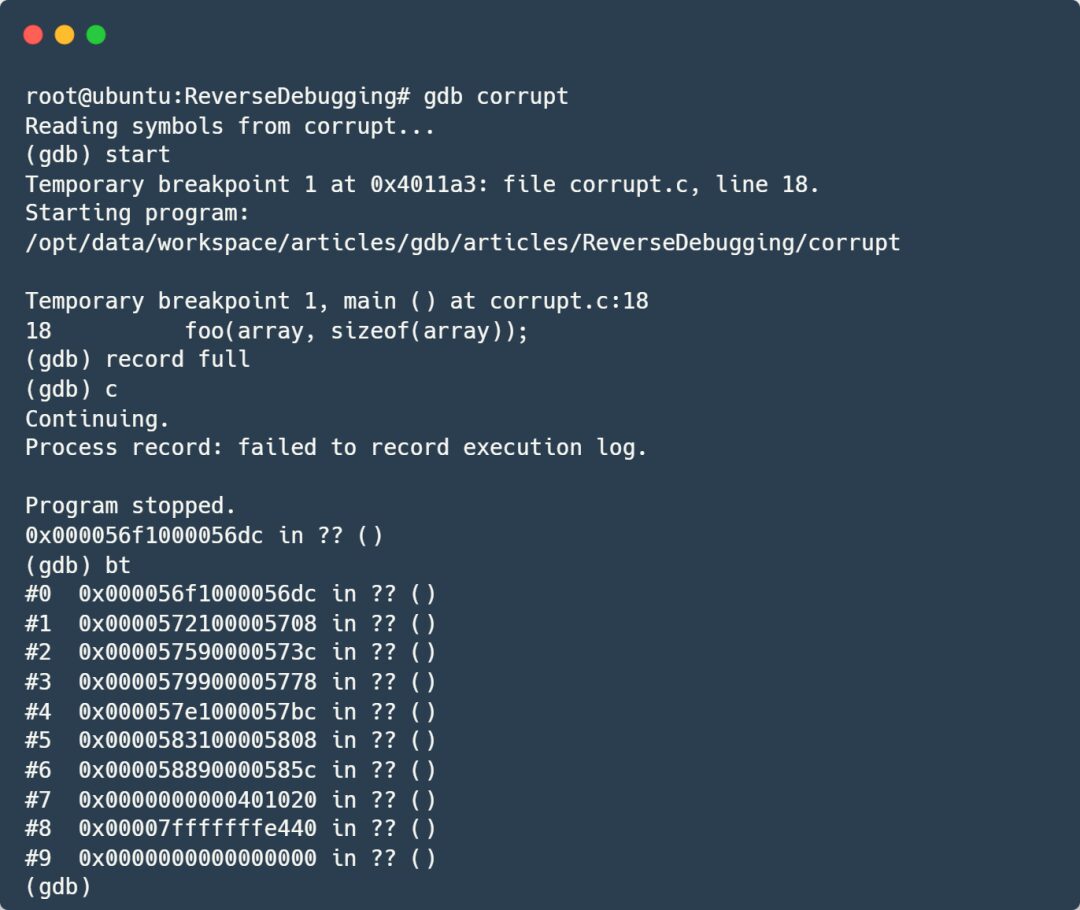
Check the RSP register to find the current stack address, then set a data breakpoint at the current stack address:
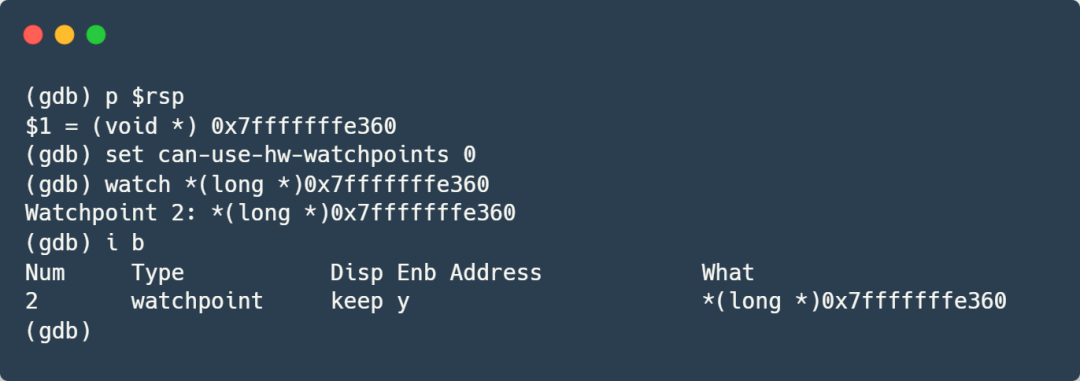
We directly set the data breakpoint at the RSP address. It needs to be explained that in the version of GDB I am using, hardware data breakpoints become invalid during reverse debugging; therefore, I need to use the command “set can-use-hw-watchpoints 0” to force GDB to use software breakpoints. I am not sure if this issue has been resolved in the latest version of GDB; interested friends can try it out.
Then, use the rc (reverse-continue) command to let the program start executing in reverse:
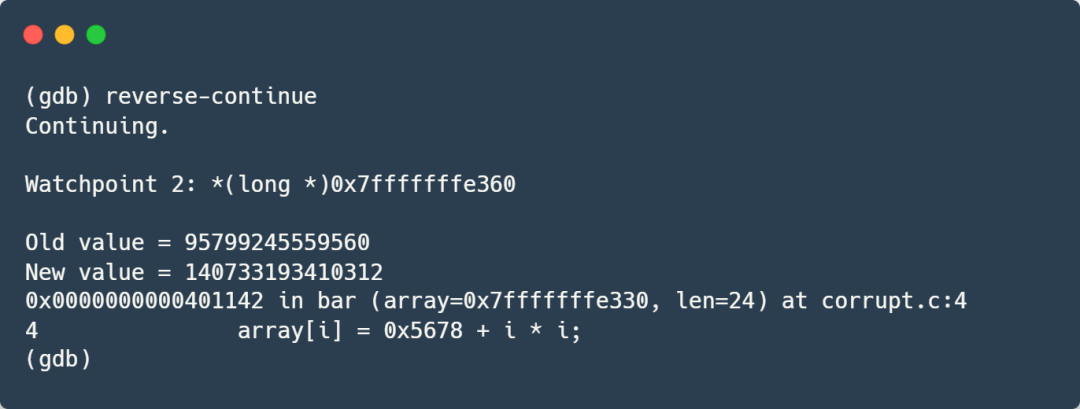
We can see that the data breakpoint we set on the stack was successfully triggered, and the program stopped at line 4, where the array element is assigned a value. Let’s take a look at the address of this element:
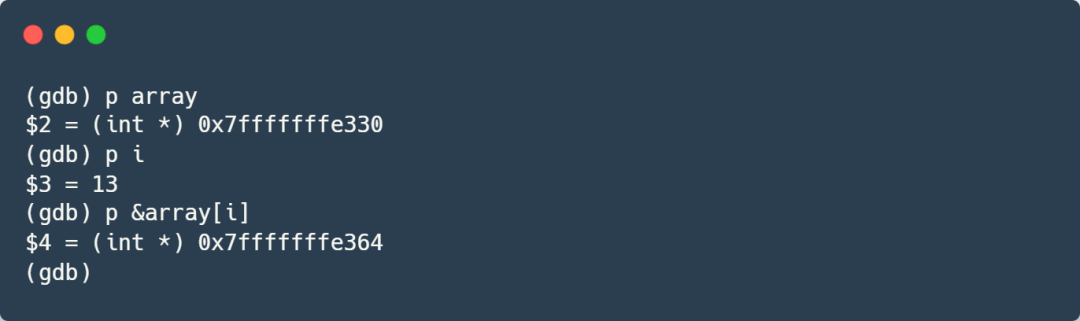
It is indeed the address of the data breakpoint we set earlier. Now, let’s check the backtrace information:
The backtrace has returned to normal! This further proves that the place where the data breakpoint was triggered, which is line 4, is the culprit that corrupted our stack data!
Since the next steps are regular debugging with no technical difficulties, I will not elaborate further due to space limitations. If you have any questions, you can add me on WeChat CreCoding to discuss! To conclude: It is easy to analyze that the length of the array passed to bar exceeded the size of the array, leading to an out-of-bounds array access that corrupted the return address of the function bar in the stack, resulting in a segmentation fault when returning to an illegal address.
This concludes the bug location!
The source code for this test program is as follows. I recommend you try it out to deepen your understanding:
The debugging process is as follows:
Disadvantages of Reverse Debugging
As mentioned earlier, the implementation principle of reverse debugging is that the debugger records the effects of every instruction executed by the program, such as modifications to register values, changes in memory values, jumps to other addresses, etc., and during reverse execution, restores the effects of these instructions one by one to achieve the effect of restoring the program’s execution state.
It can be seen that this will inevitably introduce some overhead during program execution, which can significantly impact the program’s performance.
However, for programs that are not sensitive to performance or for smaller-scale programs, this issue can be disregarded. For larger-scale programs that are highly sensitive to performance, it is unnecessary to record execution trajectory state information from the very beginning; consider segmental recording or only recording state information for the program segments of interest.
Thought Questions
-
1. During reverse execution, can all past state information be restored?
-
2. In the previous example, we used reverse debugging to locate the issue of the backtrace showing all question marks. After the segmentation fault was triggered, we directly set a data breakpoint at the RSP address and easily located the root cause. Consider whether this method is effective at all times. In what cases is it not possible to directly set a data breakpoint at the RSP address, or when setting a breakpoint at the RSP address cannot directly locate the line of code that corrupted the stack data? If such a situation arises, what should we do?
This article is the eighth in the GDB advanced debugging series. If you find this article helpful, I’m sure you’ll also enjoy these articles:
Debugging Linux Multithreading is Not That Difficult; Stop Using Printf!
Segmentation Fault: 9 Practical Debugging Methods; How Many Have You Used?
GDB Advanced Techniques: Dynamic Printing – Let You Printf Anytime, Anywhere Without Modifying Code or Recompiling
If you have any questions or suggestions, feel free to add the author’s WeChat:CreCoding

Feel free to follow:Origin Technology, sharing truly useful content, rejecting all fluff!
Original content is not easy; don’t forget to like and share!