Introduction
The use of computer-aided design tools in electronic device development aims to achieve the following goals:
- Reduce the time and cost of product development and implementation;
- Minimize the number of design errors;
- Enable design modifications and reduce the time required for product validation and testing.
One of the tools for validating and testing developed circuits is measurement instruments. Proteus provides a wide variety of virtual instruments, which are software models of control and measurement instruments corresponding to real hardware. Additionally, some virtual instruments can be used to visually display received information or, conversely, generate data for circuit use.
Let’s review how to use virtual instruments in Proteus. To add a virtual instrument to the program’s workspace, click its name in the “Instruments“ panel (by default, this panel is located on the left side of the program and contains a list of available virtual instruments), and then use the mouse to place it in the desired location in the circuit. Click the “Instrument Mode“ button on the left toolbar of the ISIS editor to open the “Instruments“ panel. Once the circuit simulation starts, the instrument’s front panel will open. You can configure the necessary settings just like on a real instrument’s panel. The instrument icon is used to connect it to the circuit, while the front panel is used to configure and monitor measurement results. Connecting a virtual instrument to circuit components follows the same principle as other circuit components. Each circuit can use multiple instruments, including multiple copies of the same instrument. Each copy needs to be configured and connected separately.Proteus software environment offers a large number of virtual instruments. We have already become familiar with many of these instruments in previous articles. This article will provide a more detailed overview of the operation of the following devices: digital pattern generator, current and voltage measurement probes.
Using Virtual Instruments in Proteus
Digital Pattern Generator
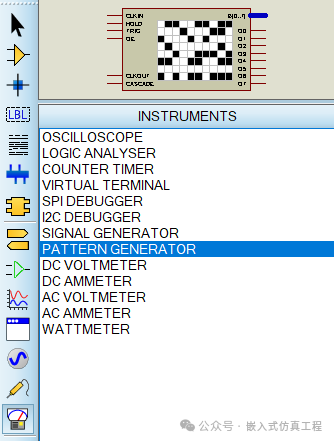
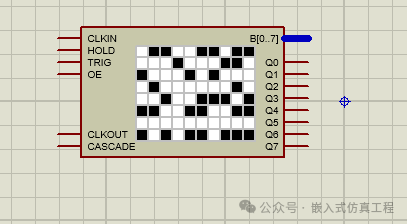
The virtual instrument generates digital output signals based on a specified 8-bit pattern and can be used to input these signals into analog circuits.
The digital pattern generator has the following features:
- Internal and external clock and synchronization modes;
- Adjustable clock frequency and switch ratio;
- Hexadecimal and decimal grid display modes;
- Load and save patterns.
This device has the following interfaces:
- B[0–7] (output) — data bus;
- Q0–Q7 (output) — data output;
- CLKIN (input) – This pin is used to connect an external clock generator;
- HOLD (input) – A positive signal on this input causes the pattern generator to stop (pause);
- TRIG (input) – This pin is used to provide an external synchronization signal;
- OE (input) – A negative signal on this input disables the pattern output to the pattern generator’s output;
- CLKOUT (output) – Displays the pulse of the internal generator during the internal clock;
- CASCADE (output) – This pin goes high when the first bit of the pattern is applied to the output, remaining low at all other times.
To add the digital pattern generator to the program’s workspace, click its name (pattern generator) in the “Instruments“ panel, and then use the mouse to place it in the desired location in the circuit. Patterns can be created manually on the generator’s front panel display or loaded from a file. The front panel display is a table with eight rows corresponding to the output signals Q0–Q7 and / or the pattern generator’s B[0–7] bus’s 8-bit output signals. To create a pattern, click on the empty cells in the display, which will fill the cell with color. The filled cell combinations can create a graphic/text that can be easily saved as a template for future use. Clicking again will deselect the cell. You can use the context menu commands to save the created pattern or load an existing pattern (Figure 1):
- Load Pattern (Load Template);
- Save Pattern (Save Template);
- Save as Graphic Template.
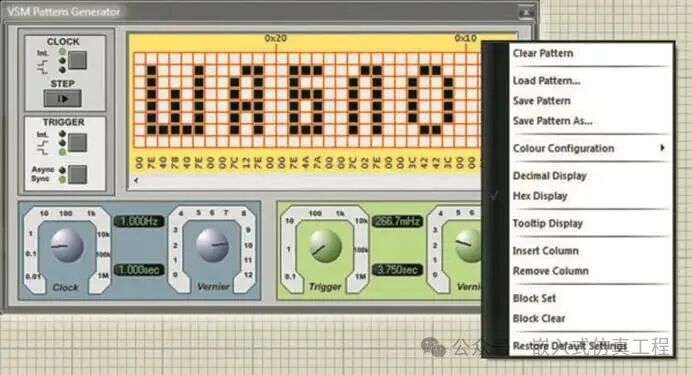
Figure 1. Creating a label in the front panel display area and viewing the digital pattern generator context menu commands.
Figure 2 shows the operation of the digital pattern generator. As shown, the signal combinations at the device output correspond to the combinations of empty and filled cells in the last column of the device’s front panel table. The generated pattern can be visually displayed using a virtual terminal (Figure 3). To add this device to the project’s workspace, click its name (virtual terminal) in the “Instruments“ panel, and then use the mouse to place it in the desired location in the circuit. Since the virtual terminal has a serial interface, the pattern symbols must be represented in binary code. To do this, create a text file on the computer disk using text encoding (Figure 4), save it with the *.ptn extension, and load it as a template. In this case, we will display the word “Privet” on the virtual terminal screen. According to the correspondence table of letters and binary codes (Table 1), the word “Privet” in the template file is as follows:
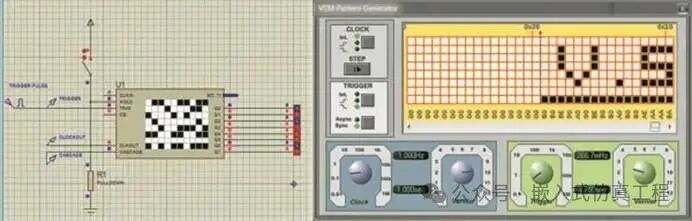
Figure 2. The correspondence between the output signal combinations of the digital pattern generator and the combinations of empty and filled cells in the last column of the device’s front panel table
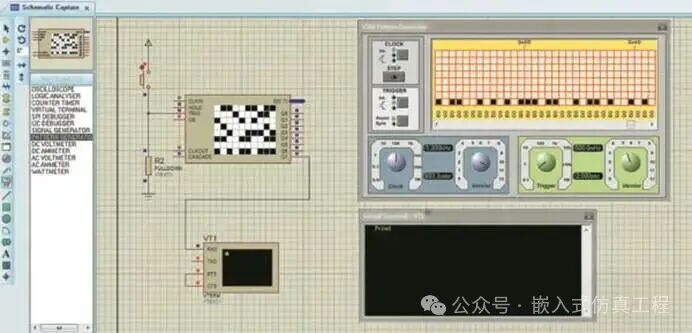
Figure 3. Outputting the template to the virtual terminal screen
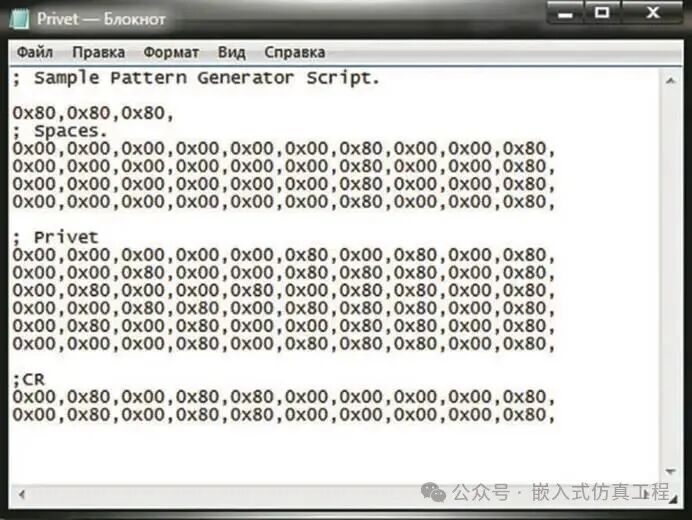
Figure 4. Characters in the template file
|
Symbol |
Binary code |
Symbol |
Binary code |
|
A |
01000001 |
a |
01100001 |
|
B |
01000010 |
b |
01100010 |
|
C |
01000011 |
c |
01100011 |
|
D |
01000100 |
d |
01100100 |
|
E |
01000101 |
e |
01100101 |
|
F |
01000110 |
f |
01100110 |
|
G |
01000111 |
g |
01100111 |
|
H |
01001000 |
h |
01101000 |
|
I |
01001001 |
i |
01101001 |
|
J |
01001010 |
j |
01101010 |
|
K |
01001011 |
k |
01101011 |
|
L |
01001100 |
l |
01101100 |
|
M |
01001101 |
m |
01101101 |
|
N |
01001110 |
n |
01101110 |
|
O |
01001111 |
o |
01101111 |
|
P |
01010000 |
p |
01110000 |
|
Q |
01010001 |
q |
01110001 |
|
R |
01010010 |
r |
01110010 |
|
S |
01010011 |
s |
01110011 |
|
T |
01010100 |
t |
01110100 |
|
U |
01010101 |
u |
01110101 |
|
V |
01010110 |
v |
01110110 |
|
W |
01010111 |
w |
01110111 |
|
X |
01011000 |
x |
01111000 |
|
Y |
01011001 |
y |
01111001 |
|
Z |
01011010 |
z |
01111010 |
|
Table 1. Correspondence table of English letters and binary codes |
– P – 01010000 ( 0x00 , 0x00 , 0x00 , 0x00 , 0x80 , 0x00 , 0x80 , 0x00 ) ;
-r – 01110010 (0x00、0x80、0x00、0x00、0x80、0x80、0x80、0x00 );
-i – 01101001 (0x80、0x00、0x00、0x80、0x00、0x80、0x80、0x00 );
-v – 01110110 (0x00、0x80、0x80、0x00、0x80、0x80、0x80、0x00 );
-e – 01100101 (0x80、0x00、0x80、0x00、0x00、0x80、0x80、0x00 );
– t – 01110100 ( 0x00 , 0x00 , 0x80 , 0x00 , 0x80 , 0x80 , 0x80 , 0x00 ) 。
It is important to note that lines in the template file starting with the “; character are treated as comments and will be ignored by the program parser.
You can specify the template to be used from the file in the “Edit Component“ Digital Pattern Generator settings window (Figure 5) in the “Pattern Generator Script“ field. This is done by clicking the folder icon to open and selecting the desired file on the disk. To open the “Edit Component“ window, left-click the pattern generator icon in the schematic area, right-click to open the context menu, and select “Edit Properties“. You can also set the following parameters for the digital pattern generator in this window:
- Component Reference — Device location identifier;
- Clock Frequency — Internal clock frequency;
- Reset Frequency — Internal synchronization frequency;
- Clock Mode — Generator clock mode: internal clock, external positive edge clock, external negative edge clock;
- Reset Mode — Synchronization source and signal: internal (internal synchronization source), asynchronous external positive edge (external asynchronous positive edge), synchronous external positive edge (external synchronous positive edge), asynchronous external negative edge (external asynchronous negative edge), synchronous external negative edge (external synchronous negative edge);
- Enable Clock Output in Internal Mode — Display internal generator pulses during internal clock: yes, no;
- Output Configuration — Data output: output only to pins (data output only to pins Q0–Q7), output only to bus (data output only to bus B[0–7]), output to both pins and bus
(data output to both pins and bus).
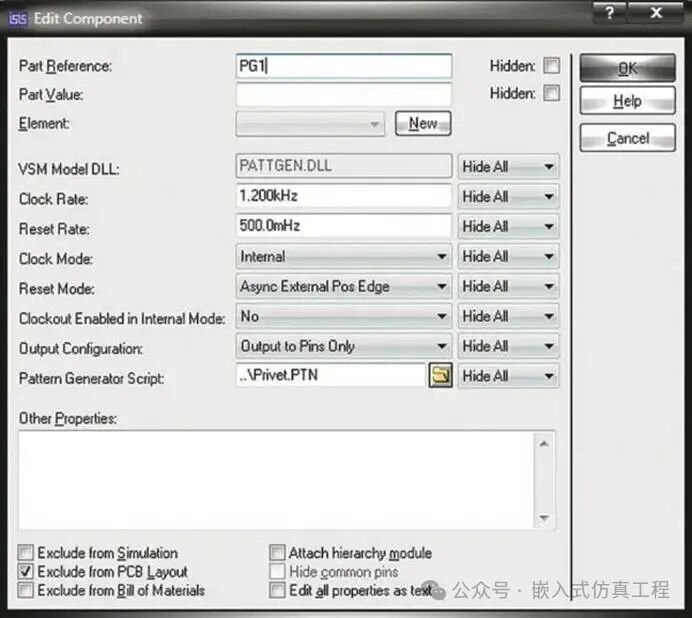
Figure 5. Digital Pattern Generator Settings Window
The front panel of the pattern generator is used to input the settings for this device. Let’s take a closer look at this panel. Its left side contains two windows:
- Clock — This window is used to set the clock mode of the oscillator: external or internal. Press this button repeatedly until the indicator light matches the desired clock mode. The indicator light has no name, but its function is intuitive, with an icon next to each indicator light. If the internal clock mode is selected in the “Clock“ window, you can adjust the frequency using the “Clock“ knob.
- Trigger — This window is used to select the synchronization source (external or internal) and synchronization signal (edge or falling edge). If external synchronization is selected, it must be specified whether it is synchronous or asynchronous with the clock generator. All parameters can be selected by pressing the button repeatedly until the indicator shows the desired value. If internal synchronization mode is selected in the “Trigger“ window, you can adjust the frequency using the trigger knob.
The internal clock mode of the generator is triggered by the falling edge and can be set in the digital pattern generator settings window before simulation or during simulation in the “Clock“ window on the instrument’s front panel. There are two external clock modes: edge-triggered and falling edge-triggered. To use an external clock, connect the output signal of the external clock generator to the CLKIN input of the pattern generator and select one of the two clock modes (edge-triggered or falling edge-triggered) in the pattern generator settings window or in the “Clock“ window on the instrument’s front panel.
Let’s look at the synchronization modes of the digital pattern generator. In internal synchronization mode, the pattern switches at specified time intervals. If the clock is internal, the internal clock generator will be reset at the moment of switching.CASCADE pin goes high, and the first bit of the pattern is output to the generator’s output. Figure 6 shows the timing diagrams of the digital pattern generator in different synchronization modes.
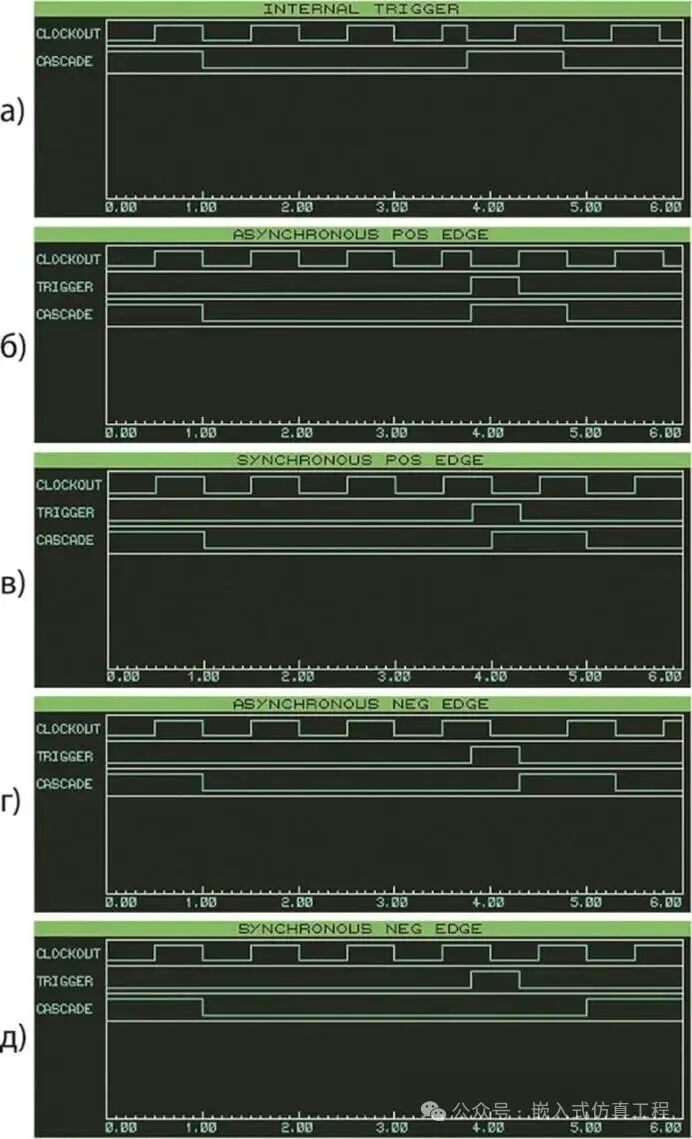
Figure 6. Timing diagrams of the digital pattern generator in different synchronization modes:a) Internal synchronization mode;b) External asynchronous rising edge synchronization;c)External synchronous rising edge synchronization;d) External asynchronous falling edge synchronization;e) External synchronous falling edge synchronization
The digital generator allows you to specify the output for specific parts of the pattern. This operation is performed in the display area of the pattern generator’s front panel. To do this, use the left mouse button to drag the cursor to the area of the pattern where output is not allowed. The area where output is not allowed will be displayed in light color (Figure 7).
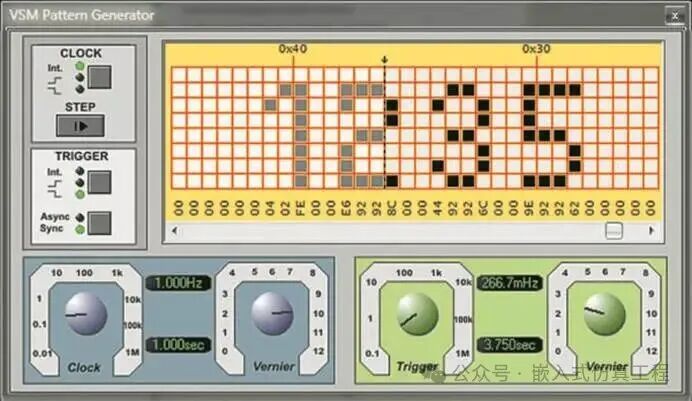
Figure 7. The part of the template where output is prohibited in the digital pattern generator front panel display area
During simulation, you can use the “Clock“ window on the instrument’s front panel to advance the template using the “Step“ button. The simulation will continue until the clock generator cycle is completed and then stop.
Using Current and Voltage Measurement Probes
When designing devices, it may be necessary to check the DC (AC) voltage or current in parts of the circuit during the schematic development phase. To this end, Proteus provides current (CURRENT) and voltage (VOLTAGE) measurement probes. These probes can be added to the Proteus workspace before running the circuit simulation. Voltage probes can be used for both analog and digital simulations, while current probes are only used for analog simulations.
To add a measurement probe to the program workspace, click its name in the “Probes“ panel (by default, this panel is located on the left side of the program and contains a list of available virtual probes), and then use the mouse to place it in the desired location in the circuit. Click the “Probe Mode“ button on the left toolbar of the ISIS editor to open the “Probes“ panel. It is worth noting that, unlike other virtual instruments, measurement probes do not have their own front panel. Probe parameters are configured in the properties window before running the circuit simulation.
To connect a measurement probe to the circuit, select its name in the “Probes“ panel, hover the cursor over the probe position, and then click the wire. After running the circuit simulation, the measurement results (voltage, current) will be displayed next to the measurement probe icon. For current probes, the direction is very important. The circular arrow on the current probe icon indicates the direction of current measurement.
Each circuit can use multiple probes, including multiple copies of the same device. Each device copy is configured and connected separately.
Figure 8 shows an example of connecting multiple current and voltage probes to the circuit under test. Note the names of the probes. Unconnected probes have a default name of “?“. When a probe is connected to the circuit, the system automatically assigns it the circuit name. If the circuit has no name, the probe is named using the component reference identifier or the name of the pin to which the probe is connected. Designers can also specify custom names for the probes.
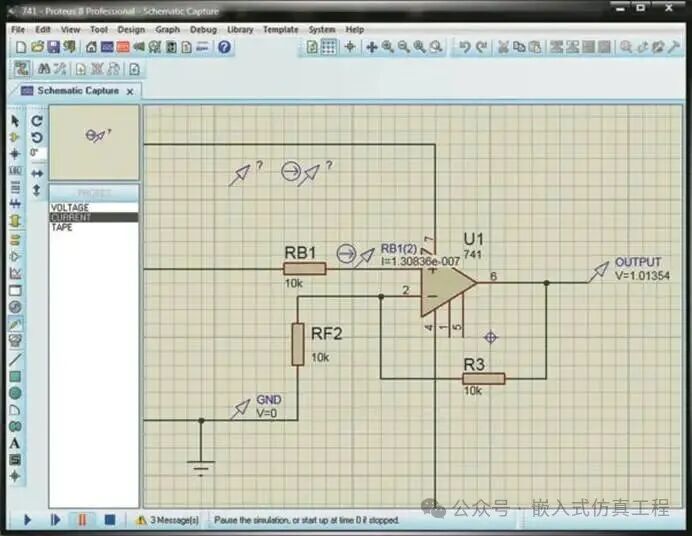
Figure 8. Example of connecting multiple current and voltage probes to the circuit under test
To configure the parameters of the probes, select the probe in the workspace using the left mouse button, right-click to open the context menu, and select “Edit Properties“. This will open the “Edit Current Probe“ window (Figure 9a) and the “Edit Voltage Probe“ window (Figure 9b). For the current probe, you can set the probe name (“Name“ field) and the filename for data logging (“Filename“ field). For the voltage probe, in addition to these two parameters, you can also set the load resistance value (“Load (Ohms)“ field). The data recorded to the file can be played back using the recording generator ( “Tape“).
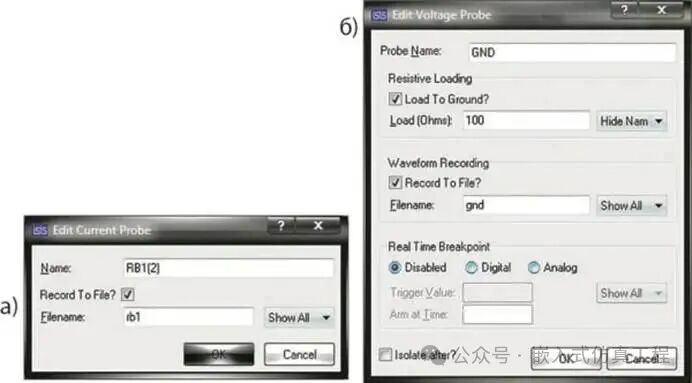
Figure 9. Parameter settings window:a) Current Probe;b) Voltage Probe
Conclusion
Using virtual tools in Proteus allows for direct comparison of theoretical data with actual data during the circuit design process, thereby reducing the number of design iterations, prototyping errors, and speeding up time to market. However, to effectively use virtual tools in Proteus, it is necessary to understand the algorithms implemented in the program, master the working principles of the available tools, and understand the principles of electronic component model construction. Improper use of component models, incorrect configuration of virtual tools, and misuse of computational algorithms can all lead to erroneous modeling results.
Welcome to follow (for operational reference articles: Follow the public account and send message operations), click the blue text at the top “Embedded Simulation Engineering” or long press to identify the QR code to follow