
Source:Testing Learning Network
Introduction: In the section about TP and ALB, I actually forgot to mention the white ball ratio. In fact, there are many items in the testing projects that exist in the form of ratios. Today, let’s discuss how significant these ratio-based projects are and see if there are answers you are looking for.

PART01: White Ball Ratio A/G
The concept of the white ball ratio needs no elaboration, as it is well understood, where globulin is a calculated item. Albumin is an important indicator reflecting the liver’s synthetic capacity. Globulin is closely related to the immune function of the human body. Whether globulin is actively increased (in immune proliferative diseases) or passively increased (due to decreased albumin causing compensatory reactions), it can lead to abnormal ratios.
★ Abnormal decrease in albumin leads to a decrease in A/G: Commonly seen in cirrhosis, hepatitis, hypoproteinemia, malnutrition, ascites, decreased immunity, and various diseases.
★ Increased globulin leads to a decrease in A/G: Common clinical diseases include acute and chronic infections, malignant tumors, autoimmune diseases, chronic liver diseases, and plasma cell diseases (primarily multiple myeloma).
★Increased White Ball Ratio A/G: Less common, can be seen in acute dehydration, adrenal cortex dysfunction, immune suppression, or congenital hypogammaglobulinemia, etc.
PART02: Transaminase Ratio (AST/ALT)
The transaminase ratio has significant clinical significance in previous biochemistry. The AST/ALT ratio has important guiding value for the diagnosis, differential diagnosis, and prognosis of acute and chronic hepatitis.
★ AST/ALT ratio <1: Commonly found in viral hepatitis, including acute viral hepatitis and chronic viral hepatitis. The main reason is that during acute viral hepatitis, although there is liver cell damage, the mitochondria of liver cells remain intact, so the main enzyme released into the blood is ALT present in the cytoplasm of liver cells, and the amount of ALT released significantly exceeds that of AST, leading to a serum ALT content greater than AST. Therefore, when liver cells undergo acute damage, liver function abnormalities primarily manifest as an increase in ALT, and the AST/ALT ratio is <1. In chronic viral hepatitis, most of the liver damage is located in the liver cell membrane, and the mitochondria are basically intact, resulting in mildly elevated or normal transaminases, with an AST/ALT ratio <1. If AST is significantly elevated, it suggests that chronic hepatitis may be entering an active phase.
★ AST/ALT >1, even >2: Commonly found in cirrhosis, the cause is that liver disease caused by viral hepatitis continues to progress to cirrhosis, leading to significant AST release into the blood due to damage to most of the mitochondria in liver cells, thus causing a significant increase in AST, while the increase in ALT is smaller than that of AST, and ALT in the cytoplasm is in a prolonged state of release and has been exhausted. At this time, AST/ALT >1, even >2.
★ AST/ALT ratio ≥3: Indicates liver cancer or severe hepatitis. For liver cancer patients, the serum AST/ALT ratio is ≥3; in severe hepatitis patients, due to a large number of liver cell necrosis, ALT gradually decreases in the blood, while bilirubin progressively increases, leading to the phenomenon of “enzyme-bilirubin separation,” which is a precursor of liver cell necrosis.
PART03: Direct Bilirubin/Total Bilirubin (DBIL/TBIL)
Direct bilirubin usually refers to conjugated bilirubin, which is generated when indirect bilirubin enters the liver and combines with glucuronic acid under the action of glucuronyl transferase. The sum of conjugated and unconjugated bilirubin is the total bilirubin. Clinically, observing the DBIL/TBIL ratio is mainly used to judge the type of jaundice.
★ DBIL/TBIL <20%: Indicates hemolytic jaundice or congenital jaundice.
★ DBIL/TBIL between 20%-50%: Indicates hepatocellular jaundice or mixed jaundice.
★ DBIL/TBIL >50%: Indicates cholestatic jaundice or obstructive jaundice.
★ In addition, in a portion of patients with normal TBIL, about 30%-50% have DBIL/TBIL >20%, suggesting early hepatitis, non-jaundiced hepatitis, decompensated cirrhosis, or early liver cancer.
PART04: LDH in Pleural Effusion/Serum LDH, ADA/Serum ADA
★ LDH is an enzyme in cells, which can remove hydrogen from lactic acid and convert it into pyruvate. If inflammation causes cell necrosis, or tumor cell death, then LDH will be released from the necrotic cells into the pleural fluid through the blood. Exudate is caused by inflammation or tumors, which contain many necrotic cells, therefore LDH in exudate is often >200; if >500, it indicates a high number of necrotic cells, necessitating consideration of tumor necrosis or bacterial infection leading to significant cell death. Clinically, a pleural fluid/serum LDH ratio >0.6 is often used to differentiate exudate from transudate.
★ ADA is one of the purine nucleotide degradation enzymes, widely present in various cells and body fluids in the human body, with the highest activity in lymphocytes; when immune cells are stimulated, the ADA activity within the cytoplasm increases. Measuring the ADA activity in pleural (or abdominal) fluid is a specific indicator for diagnosing tuberculous pleuritis (or peritonitis). The ADA content in tuberculous pleural effusion is often 40U/L or higher. Clinically, blood ADA is often measured in conjunction, and the ratio of the two is used as one of the bases for determining tuberculous pleuritis. Generally, when the pleural fluid ADA/serum ADA >1, it can clearly diagnose tuberculous pleuritis and differentiate it from cancerous or heart failure-related pleural effusions. The accuracy and specificity of this diagnosis are superior to that of positive tuberculosis antibodies.
PART05: GGT/AST Ratio
GGT/AST is commonly used in clinical differential diagnosis of obstructive jaundice and alcoholic injury.
★ GGT/AST >2, and the patient has a history of alcoholism, consider alcoholic cirrhosis.
★ GGT/AST <2, and accompanied by decreased cholinesterase and increased IgG, consider progressive and mildly infectious cirrhosis.
★ Additionally, in acute alcoholic hepatitis, GGT/AST can be greater than 6, while in early cholestasis patients, GGT/AST is 3~6, and in long-term obstruction patients, GGT/AST can be greater than 6.
PART06: LDH/AST Ratio
★ LSH/AST ratio, is commonly used clinically to differentiate hemolytic jaundice from hepatitis or obstructive jaundice. Generally, a ratio >12 at 25°C or >5 at 37°C is the diagnostic standard for hemolytic jaundice.
★ In 2011, a study by obstetrician Martin Jr. at the University of Mississippi Medical Center found that the LDH/AST ratio in blood can effectively differentiate between preeclampsia/HELLP syndrome and pregnancy-related TTP, with an LDH/AST ratio >22.12 favoring a TTP diagnosis. Compared to ADAMTS-13 activity, the LDH/AST ratio closely meets the ideal standard for screening suspected TTP patients.
PART07: ALT/ALP Ratio
ALT is a specific indicator reflecting liver cell damage. ALP is often used to reflect liver bile duct obstruction and bone metabolism. The ALT/ALP ratio is mainly used for differentiating the type of jaundice.
★ When ALT rises to more than twice the normal upper limit, if ALT/ALP ≥5 indicates hepatocellular liver damage.
★ When ALT rises to more than twice the normal upper limit, if ALT/ALP ≤2 indicates cholestatic liver damage.
★ When ALT rises to more than twice the normal upper limit, if ALT/ALP is between 2~5, it indicates mixed liver damage.
PART08: CK-MB/CK Ratio
CK and CK-MB have been discussed extensively, and the reasons for CK-MB > CK activity have also been mentioned multiple times.
★ When CK >200u/L, CK-MB/CK <5%, consider muscle disease.
★ When CK >200u/L, 5% < CK-MB/CK <30%, the likelihood of acute myocardial infarction is high.
★ When CK >200u/L, 30% < CK-MB/CK <100%, consider the presence of CK-BB or macro CK.
★ When CK-MB/CK >100%, it indicates methodological defects that overlook the abnormal elevation of CK-BB, or the appearance of macro CK caused by gastrointestinal tumors, leading to a false increase in CK-MB.
PART09: LDH Related Ratios
★ LD1/LD2 >1.0, is commonly used as a diagnostic basis for myocardial infarction, with a higher positive rate and reliability for acute myocardial infarction diagnosis than simply measuring LDH1 or CK-MB.
★ LDH5/LDH4 is often used in the diagnosis of liver lesions, where LDH5/LDH4 >1 often suggests acute hepatitis, and LDH4 > LDH5 (i.e., LDH5/LDH4 <1) suggests primary liver cancer.
★ Regarding LDH, when its activity increases, do not only consider myocardial abnormalities causing the abnormal results, but also blood diseases and metastatic tumors.

PART10: Lipase/Amylase Ratio (LPS/AMY)
In clinical laboratories, amylase and lipase are often tested together for diagnosing pancreatitis, improving diagnostic sensitivity and specificity. Generally, blood amylase begins to rise 2-12 hours after the onset of acute pancreatitis and lasts for 3-5 days. However, some pancreatitis patients may have normal or only mildly elevated amylase.
Lipase begins to rise 4-8 hours after symptoms appear, peaks at 24 hours, and takes 8-14 days to return to baseline levels. In clinical practice, the lipase/amylase ratio is also used to differentiate the causes of pancreatitis.
Generally, if the ratio is less than 2, it is often attributed to gallbladder factors, while greater than 2 is often attributed to alcohol intoxication factors.
PART11: Serum Free Light Chain κ/λ
In the bone marrow, each plasma cell can produce one heavy chain and one light chain, with the light chain having two types, Kappa (κ) and Lambda (λ), where κ light chains account for about 65%, and λ light chains about 35%, with a ratio of about 2:1. Since multiple myeloma (MM) is a malignant monoclonal proliferative disease, it will excessively produce one monoclonal immunoglobulin light chain and simultaneously suppress the production of another light chain, leading to a significant abnormality in the κ/λ ratio in serum and urine light chains.
The quantity of light chains in blood and urine usually reflects the degree of monoclonal proliferation of plasma cells in the bone marrow. The greater the difference in the κ/λ ratio, the more severe the condition. The imbalance of the κ/λ ratio is an important indicator to distinguish MM from other diseases. Generally, when the κ/λ ratio is elevated or decreased by more than 10 times compared to the reference value, there is a high suspicion of the existence of monoclonal immunoglobulin light chains. Moreover, the measurement of the κ/λ ratio is a valuable indicator for the positive detection rate of MM and the differential diagnosis of MM and renal injury.
PART12: Retinol/Retinol Binding Protein
Retinol is vitamin A, and retinol binding protein is the transport protein for vitamin A in the body. It is synthesized by the liver and widely distributed in blood, cerebrospinal fluid, urine, and other body fluids. Measuring retinol binding protein can early detect renal tubular dysfunction and sensitively reflect the degree of damage to the proximal renal tubules. It can also serve as an indicator for early liver function damage and monitoring treatment. Decreased retinol binding protein is mainly seen in vitamin A deficiency, hypoproteinemia, malabsorption syndrome, liver diseases (excluding nutrient surplus fatty liver), obstructive jaundice, hyperthyroidism, infections, trauma, etc. Increased retinol binding protein is mainly seen in renal insufficiency and nutrient surplus fatty liver.
Clinically, the changes in the serum retinol and retinol binding protein ratio are often monitored simultaneously. Under normal circumstances, the retinol/retinol binding protein ratio is >0.9. When renal insufficiency occurs, this ratio is often <0.9.
PART13: Serum Iron/Transferrin Binding Capacity (Transferrin Saturation)
Transferrin saturation refers to the ratio of serum iron to transferrin binding capacity, i.e., the percentage of serum iron divided by total iron binding capacity, with a reference range of 20%-55%. Any condition causing decreased serum iron or changes in transferrin content will lead to changes in transferrin saturation. Under normal circumstances, transferrin saturation fluctuates significantly, with normal fluctuations overlapping with pathological conditions. Its elevation can be seen in aplastic anemia, hemolytic anemia, megaloblastic anemia, etc.; its decrease can be seen in iron deficiency anemia, polycythemia, and inflammation, etc. Clinically, transferrin saturation is often used as one of the diagnostic bases for iron deficiency anemia.
PART14: Free Erythrocyte Protoporphyrin/Hemoglobin (FEP/Hb)
Any disease causing abnormal binding of FEP and iron will lead to impaired hemoglobin synthesis, resulting in anemia in patients. In iron deficiency anemia, due to insufficient iron sources, FEP accumulates in red blood cells.
Lead can inhibit heme production, thus in lead poisoning, both free protoporphyrin and plasma iron will be elevated. In pernicious anemia, nutritional megaloblastic anemia, and leukemia, due to the body’s lack of ability to prepare protoporphyrin, the free protoporphyrin in the blood will be low.Clinically, FEP/Hb is often introduced into diagnostic testing, with FEP >0.9μmol/L (whole blood), FEP/Hb >4.5μg/gHb serving as one of the diagnostic bases for iron deficiency anemia.
PART15: Total Thyroxine/Thyroxine Binding Globulin (TT4/TBG)
TBG is an α-globulin synthesized by liver cells, which is the main binding protein for thyroid hormones in the blood, with about 70% of T4 and T3 bound to it. Changes in TBG concentration significantly affect TT4 and TT3 levels. When TT4 and TT3 test results are inconsistent with clinical manifestations, it is important to exclude the impact of TBG concentration changes on TT4 and TT3 levels; the TT4 (μg/L)/TBG (μg/ml) ratio can be used for judgment.
★ TT4/TBG ratio between 3.1-4.5, indicates normal thyroid function.
★ TT4/TBG ratio between 0.2-2.0, should consider the presence of hypothyroidism.
★ TT4/TBG ratio between 7.6-14.8, should consider hyperthyroidism.
PART16: Free Prostate-Specific Antigen/Total Prostate-Specific Antigen (f-PSA/t-PSA)
Prostate-specific antigen (PSA) is currently a commonly used indicator for screening prostate tumors. The antigens detected in laboratories include both total PSA and free PSA. When t-PSA >10ug/L, the likelihood of prostate cancer is very high. When t-PSA is between 4-10ug/L, both prostate cancer and benign prostatic hyperplasia are possible. At this time, the f-PSA/t-PSA ratio is needed; if the ratio >0.19, the likelihood of prostate cancer is low; conversely, if the ratio <0.19, the likelihood of prostate cancer is high. It should be noted that if t-PSA is within the normal range, the fPSA/tPSA ratio is negligible.
PART17: Fecal Coccus/Bacillus Ratio
The ratio of cocci to bacilli in feces is one of the main indicators reflecting intestinal flora homeostasis. The types and ratios of intestinal flora vary among different age groups. The presence and abundance changes of bacterial species in the intestinal flora can indicate clinical dysbiosis. Under normal circumstances, the coccus-bacillus ratio is about 1:10~1:20. Any treatment or intervention affecting Gram-negative bacteria will lead to changes in the coccus-bacillus ratio.
PART18: International Normalized Ratio (INR)
PT-INR is the international normalized ratio, which can be considered a coagulation parameter specifically provided for warfarin medication.
★ In healthy adults, the INR value is approximately 1.0.
★ In patients with venous thrombosis, the INR value should generally be maintained between 2.0-2.5.
★ In patients with atrial fibrillation, the INR value should generally be maintained between 2.0-3.0.
★ When the INR value exceeds 4.0, it indicates the possibility of uncontrollable bleeding and even death.
★ An INR below 2.0 cannot provide effective anticoagulation.
★★ It is important to note that when monitoring INR values clinically, each patient’s specific situation must be taken into account to implement refined management and personalized treatment.
PART19: Thrombin-Antithrombin Complex/Fibrinolysin-Antifibrinolysin Complex (TAT/PIC)
TAT is a complex formed by thrombin and antithrombin in a 1:1 ratio, with a normal reference range of 0-4ng/mL, and an elevation indicates activation of the coagulation system. PIC is a complex formed by plasmin and α2-plasmin inhibitor in a 1:1 ratio, with a normal reference range of 0-0.8μg/mL, and an elevation indicates activation of the fibrinolytic system. Clinically, the TAT/PIC ratio is often observed to evaluate the degree of coagulation and fibrinolysis activation, high coagulation states, and the degree of fibrinolytic hyperactivity. If the TAT to PIC ratio is less than 5, secondary fibrinolytic hyperactivity should be considered.
PART20: CD4/CD8 Ratio
Clinically, the CD4/CD8 ratio is often used as an indicator of immune regulation, with a judgment threshold of >2.0 or <1.4. Whether >2.0 or <1.4 indicates a disturbance in cellular immune function. CD4/CD8 <1.4 is commonly seen in immunodeficiency diseases (such as HIV often has a ratio <0.5), malignant tumors, aplastic anemia, and some leukemias and viral infections; CD4/CD8 >2.0 is commonly seen in autoimmune diseases such as systemic lupus erythematosus, rheumatoid arthritis, type 1 diabetes, etc.; in addition, in organ transplant patients, if the CD4/CD8 ratio significantly increases after transplantation compared to before, it suggests that the patient may be experiencing rejection reactions.
PART21: Pepsinogen Ratio (PGⅠ/PGⅡ)
Pepsinogen (PG) is a substance secreted by the mucus cells, body, and fundic cells of the stomach that is related to digestion, including two isoenzymes, PGI and PGII. Pepsinogen I (PGI) is secreted by the main cells and neck mucus cells of the gastric fundus and primarily reflects the function of the glandular cells that secrete gastric acid. Therefore, when gastric acid secretion is high, PGI will increase; if gastric acid secretion decreases or gastric mucosal glands atrophy, PGI will decrease. Pepsinogen II (PGII) is secreted by the gastric fundus, cardia, pyloric gland, and duodenal gland. PGII is more closely related to gastric mucosal lesions, so when the entire gastric mucosa atrophies, PGII levels decrease.
★ PGI ≤70ng/mL and PGI/PGII ≤3, indicates atrophy of gastric mucosal cells, suggesting further gastroscopy. Possible reasons: mostly atrophic gastritis, especially noting high-risk factors for atrophic gastritis, intestinal metaplasia, dysplasia, and gastric cancer.
★ PGI ≤70ng/mL and PGI/PGII >3, indicates low secretion of pepsinogen, suggesting regular follow-up. Possible reasons: mostly low gastric acid secretion, with risks of atrophic gastritis and intestinal metaplasia.
★ PGI >240ng/mL, PGII >20ng/mL, indicates damage to the gastric mucosa, suggesting further gastroscopy or abstaining from alcohol, with a follow-up in two weeks. Possible reasons: PG II is relatively stable, but when the gastric mucosa is attacked or damaged, the active phase of PGI will significantly increase. HP infection, superficial gastritis, erosive gastritis, gastric ulcers, duodenal ulcers can all lead to elevated serum PGI and PGII. Recurrent gastric ulcers show significant elevation of PGII, while recurrent duodenal ulcers show significant elevation of PGI and PGII.
★ PGI increases, PGII increases especially significantly, PGI/PGII decreases, possible reasons: Caused by HP infection.
★ Note that when atrophy is limited to the gastric antrum, the PGI and PGI/PGII ratio may appear normal..
PART22: Urine Microalbumin to Creatinine Ratio (ACR)
The urine microalbumin to creatinine ratio is an important project frequently used in laboratories regarding kidney disease, used for early diagnosis and monitoring of chronic kidney disease. After introducing creatinine correction, the detection becomes more accurate (because the excretion of urinary creatinine is relatively constant, this project can to some extent replace the more troublesome 24-hour urine protein quantification).
★ ACR <30mg/g (random urine), indicates normal kidney function.
★ ACR of 30-300mg/g indicates the presence of microalbumin.
★ ACR ≥300mg/g indicates clinical proteinuria, requiring further examination of other items.
PART23: Urine Protein Selectivity Index (SPI)
In the case of mild kidney disease, only a small amount of large molecular proteins, primarily albumin, will be present in the urine, termed selective proteinuria. When kidney disease is more severe, a large amount of large molecular proteins will be discharged along with albumin, termed non-selective proteinuria. Currently, the clinical practice often uses the clearance ratio of urine IgG and urine Tf as the urine protein selectivity index, calculated using the formula: SPI = (urine IgG/blood IgG) / (urine Tf/blood Tf).
★ SPI ≤0.1 indicates highly selective proteinuria.
★ SPI <0.1 in kidney disease patients indicates mild glomerular damage, with mostly good treatment and prognosis, such as nephrotic syndrome, acute glomerulonephritis, etc.
★ SPI >0.2 indicates non-selective proteinuria, suggesting severe glomerular damage, with mostly poor prognosis, such as diabetic nephropathy.
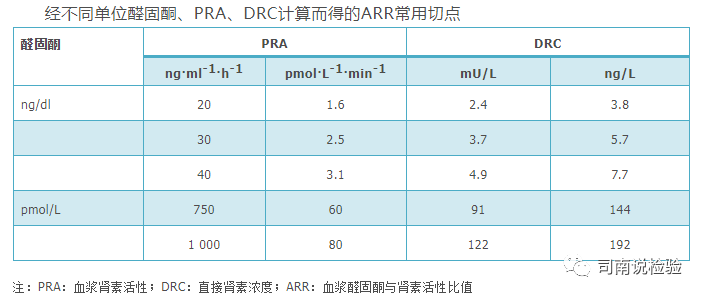
PART24: Plasma Aldosterone to Renin Ratio (ARR)
The expert consensus on the diagnosis and treatment of primary aldosteronism (2020 version) lists ARR as the preferred screening indicator for primary aldosteronism. ARR measurement includes the ratio of aldosterone to plasma renin activity (PRA) and the ratio of aldosterone to renin concentration (DRC). Currently, PRA is measured using radioimmunoassay, reflecting the level of active renin in plasma by the number of angiotensinogen converted to angiotensin I in a unit time and unit volume.
According to the 2016 Clinical Guidelines for Primary Aldosteronism, when the measured renin activity and aldosterone concentration units are ng·ml-1·h-1 and ng/dl, the most commonly used ARR cutoff is 30; when the renin concentration and aldosterone concentration units are mU/L and ng/dl, the most commonly used ARR cutoff is 3.7 (image source from 2020 expert consensus).
Conclusion:
There are many ratios present in tests, and their main significance is to assist clinical doctors in quickly judging diseases or early identification of diseases. There is not much to say about the testing ratio projects; the above text has covered what needs to be said. Let’s reiterate the old saying, details determine success or failure, seek truth in testing, and uphold integrity in verification!

 END
END

ShareCollectLikeWatch
If you find this article valuable and want to see more timely content, remember to click “Like” and “Watch”, and then star this public account  so that the latest articles will appear at the top of your subscription account list as soon as they are released.