PMID:37488863
DOI:10.4103/1673-5374.375343
Abstract
Research indicates that microglia and macrophages participate in the multifaceted brain injury repair process following intracerebral hemorrhage (ICH). The E26 transformation-specific sequence-related transcription factor Spi1 regulates the polarization and maturation of microglia/macrophages. However, the role of Spi1 in ICH is unclear. In this study, the researchers found that Spi1 may regulate the recovery from neuroinflammation and neurological functional impairment caused by ICH by modulating the microglial/macrophage transcriptome. The study found that the high expression of Spi1 in microglia/macrophages after ICH is associated with the activation of many pathways that promote phagocytosis, glycolysis, autophagy, debris clearance, and sustained myelin regeneration. Notably, microglia with high levels of Spi1 expression were characterized by the activation of pathways related to various hemorrhage-associated cellular processes, such as complement activation, angiogenesis, and coagulation. In summary, the findings suggest that Spi1 plays a crucial role in the inflammatory response of microglia/macrophages after ICH. New insights into the regulation of Spi1 and its target genes may enhance our understanding of neuroinflammation following ICH and provide new therapeutic targets for patients with ICH.
Background
Intracerebral hemorrhage (ICH) accounts for 15-20% of all strokes and is characterized by high mortality, morbidity, and disability rates worldwide. Therefore, there is an urgent need to comprehensively understand the potential mechanisms of injury after ICH to improve diagnosis and treatment. Previous studies have shown that neuroinflammation caused by macrophage infiltration and local microglia contributes to the development of multifaceted injury following ICH. After hemorrhagic injury, resident microglia and macrophages rapidly migrate to the site of injury, leading to morphological and functional changes. During the acute phase of ICH, microglia/macrophages promote secondary injury and hematoma expansion by secreting immune regulatory molecules such as cytokines and chemokines, further increasing the risk of mortality and early disability. In contrast, in the later stages after ICH, activated microglia/macrophages phagocytose red blood cells, dead cells, and debris, eliminate edema, maintain the homeostasis of the microenvironment around the hematoma, support the repair of damaged neurons, restore white matter integrity, and promote functional recovery after ICH. Therefore, studying the regulation of microglia/macrophage function is crucial for understanding the pathophysiology of ICH.
The E26 transformation-specific sequence family transcription factor gene Spi1 encodes the PU.1 protein, which plays a key role in the development of myeloid and lymphoid cells. Numerous studies have shown that Spi1 is essential for the function and survival of macrophages. Spi1 promotes the polarization and survival of mature macrophages. In macrophages, Spi1 induces miR-233 and inhibits E2F1, which regulates the cell cycle process. In the central nervous system (CNS), Spi1 expression is restricted to microglia, and its expression level affects the transcription, activation, and phenotype of microglia. Reducing Spi1 expression in microglia leads to decreased phagocytic capacity, while increasing Spi1 expression in microglia enhances yeast-like phagocytosis. In Alzheimer’s disease, Spi1 regulates the expression of interleukin-33 (IL-33), thereby activating MHC-II+ phagocytic microglia and enhancing microglia-mediated amyloid-β clearance. Overexpression of Spi1 in human cortical organoids produces microglia-like cells that protect the cortex from Aβ-associated cellular and molecular damage. Although Spi1 has been shown to be expressed in the brain, its role in ICH remains unclear. Understanding how Spi1 affects the transcriptional response of microglia/macrophages can provide more specific targets for ICH treatment.
In recent decades, high-throughput technologies have been widely used to monitor transcriptomic and proteomic changes at the genomic level. In this study, the researchers analyzed six datasets related to ICH in the NCBI Gene Expression Omnibus (GEO) database to comprehensively explore the role of Spi1 in the transcriptomic changes of microglia/macrophages after ICH and brain inflammation. This study aims to systematically investigate the impact of Spi1 on the function of microglia/macrophages after ICH to deepen our understanding of the pathophysiology of ICH and provide innovative opportunities for ICH treatment.
Research Methods and Ideas
(1) Collect and identify differentially expressed genes: Use RNA-Seq and ChIP-seq datasets from the GEO database to perform differential expression gene analysis using the DESeq2 and limma packages.
(2) DEG enrichment and protein-protein interaction network analysis: Use the clusterProfiler package for GO and KEGG enrichment analysis, and the STRING database for protein-protein interaction network analysis.
(3) Gene set variation analysis and single-sample gene set enrichment analysis: Use GSVA and ssGSEA to analyze gene set changes and pathway activity.
(4) Estimate immune cell scores: Use methods such as CIBERSORTx, xCell, and ImmuCellAI to estimate immune cell proportions.
(5) Weighted gene co-expression network analysis and key transcriptional regulator discovery: Use WGCNA and LISA to analyze gene co-expression networks and identify transcriptional regulators.
(6) Assess PU.1 promoter binding sites: Use ChIP-seq datasets and the ChIPseeker package to analyze PU.1 binding sites.
(7) Single-cell RNA-seq analysis: Use the cellranger and Seurat packages for single-cell RNA-seq data analysis.
(8) ICH model: Establish a collagenase-induced intracerebral hemorrhage mouse model.
(9) Immunofluorescence staining: Use antibodies such as Iba1, Spi1, NeuN, GFAP, CC-1, and TMEM119 for immunofluorescence staining.
(10) Statistical analysis and visualization: Use R software for statistical analysis and RStudio for visualization.
Research Results
1. Microglia and Macrophages Participate in Neuroinflammation and Brain Tissue Repair After ICH
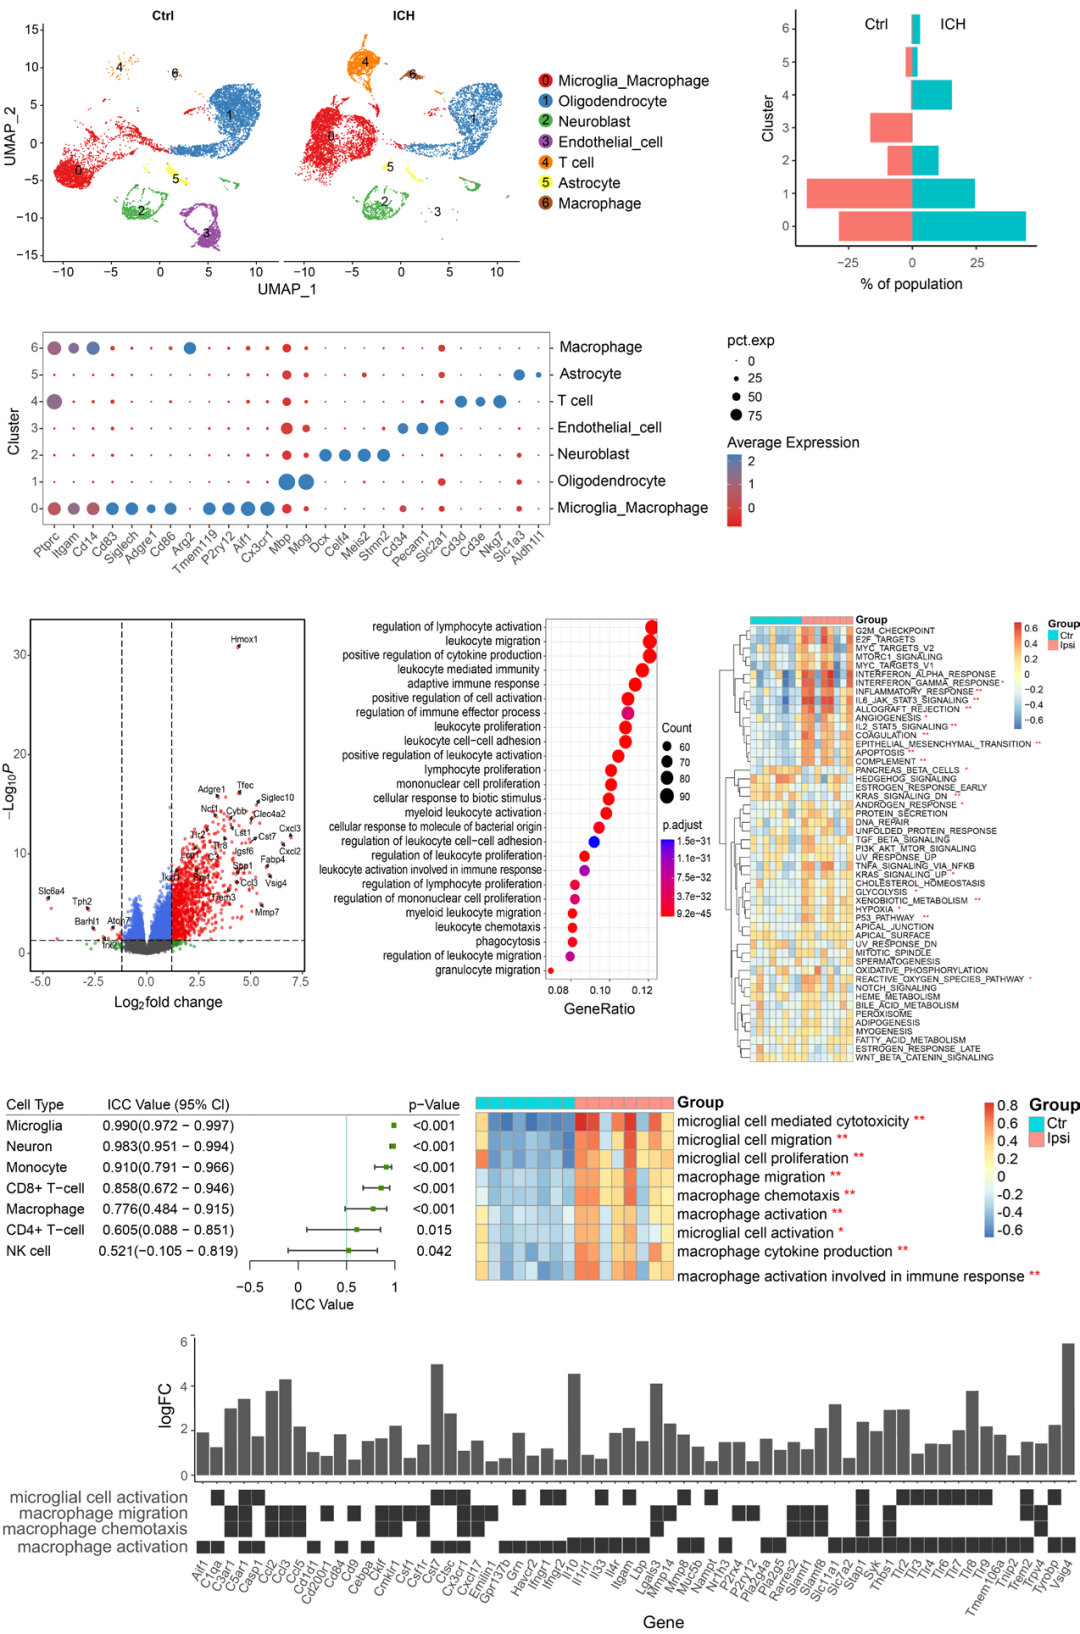
Download the scRNA-seq dataset GSE167593 to explore the main cell types infiltrating the brain parenchyma of control and hemorrhage groups of mice after ICH. Using Uniform Manifold Approximation and Projection (UMAP) for clustering and projection, seven different clusters were defined based on marker gene expression, along with a cluster representing dividing cells (Figure 1A and B). All seven clusters contained cells from the brains of both control and hemorrhage group mice (Figure 1C). It was observed that over 45% of the cells in the microglia/macrophage cluster of the hemorrhage group mice’s brains were microglia/macrophages, indicating that these cells are the main cell types rapidly migrating to the site of injury after ICH.
Then, the researchers downloaded the dataset GSE149317, which contains data from 16 pairs of S-D rats collected from the ipsilateral and contralateral brain hemispheres three days after ICH, to explore neuroinflammation after ICH. The dataset was rigorously filtered to remove genes with low expression levels; only genes expressed in more than two samples (count >10) were retained. Differentially expressed genes (DEG) between the ICH group and control group were identified through functional enrichment analysis. A total of 961 upregulated genes and 6 downregulated genes were identified. The EnhancedVolcano package was used to generate a volcano plot of the DEGs (Figure 1D). GO database analysis indicated that the overexpressed genes were primarily involved in immune responses, such as leukocyte activation, chemotaxis, and phagocytosis (Figure 1E). GSVA of all 50 hallmark gene sets showed that inflammation response, apoptosis, complement, angiogenesis, coagulation, and hypoxia gene sets were all upregulated in the ICH group samples (Figure 1F).
The researchers further calculated immune cell scores using three methods: CIBERSORTx, ImmuCellAI, and xCell. Additionally, the researchers performed GSVA on the gene expression matrix using cell markers obtained from CellMarker and PanglaoDB. The consistency between the results of the three methods was evaluated by calculating the ICC in R. The results showed that the proportions of monocytes (ICC value: 0.91, 95% confidence interval (CI): 0.79–0.97, P < 0.001), CD8+ T cells (ICC value: 0.86, 95% CI: 0.67–0.95, P < 0.001), and macrophages (ICC value: 0.77, 95% CI: 0.48–0.91, P < 0.001) had good consistency, indicating that these three cell types increased in number after ICH. GSVA results showed that the number of microglia in ICH group samples (ICC value: 0.99, 95% CI: 0.972–0.997, P < 0.001) significantly increased, indicating the presence of microglia in the brain injury sites caused by ICH, leading to a decrease in the number of neurons in these areas (ICC value: 0.98, 95% CI: 0.951–0.994, P < 0.001; Figure 1G).
The above results suggest that inflammation response is triggered after ICH, with microglia and macrophages being the primary immune cells mediating immunity. However, how these cell types affect brain injury caused by ICH remains unclear. Therefore, GSVA was used to assess the immune processes associated with microglia/macrophages. As shown in Figure 1H, macrophage activation, chemotaxis, migration, and cytokine production were enriched in the samples around the hematoma. Similarly, microglia-mediated cytotoxicity, activation, and migration were also significantly enriched in the samples around the hematoma. This indicates that microglia/macrophages are recruited and activated at the injury sites, thereby initiating secondary brain injury processes and subsequent brain tissue repair. Figure 1I shows the expression changes of DEGs involved in immune-related pathways in macrophages and microglia.
2. WGCNA Reveals Spi1 as a Key Transcriptional Regulator During ICH
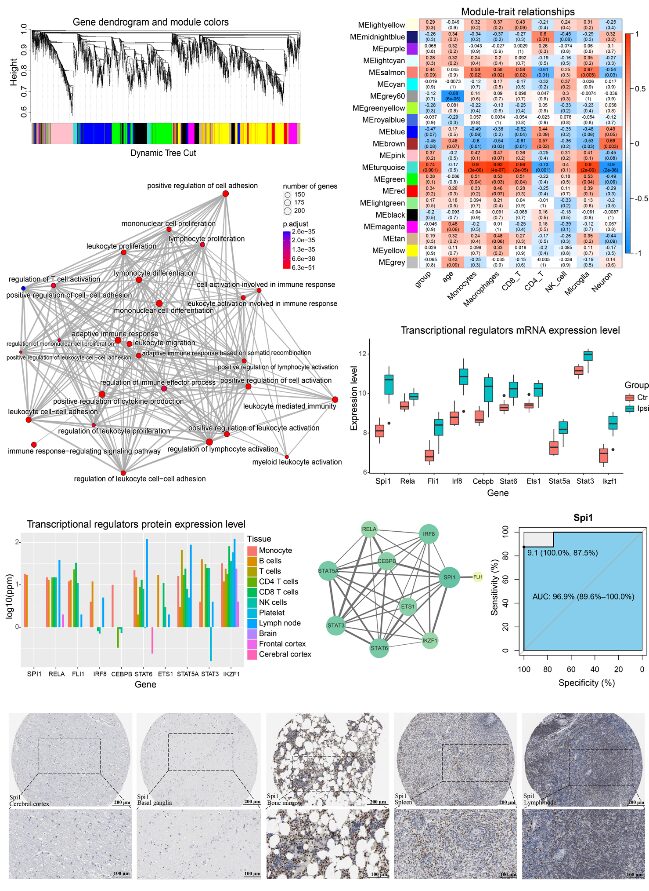
To further explore the co-expression of mRNAs related to ICH, WGCNA was applied to the GSE149317 dataset. After filtering low-abundance genes, a total of 15,187 valid genes remained. These valid genes were log2 transformed and imported into WGCNA for co-expression analysis. The researchers selected a soft threshold power value of β=9 (scale-free R2 = 0.87) to ensure a scale-free network. Each leaf in the hierarchical clustering tree represents a gene, with each color representing a module (Figure 2A).
The scores of infiltrating immune cells were set as phenotypic features to estimate the most important modules associated with ICH and immune cells. The turquoise module was closely related to immune cell scores, indicating that this gene set may correspond to the functions of macrophages and microglia (Figure 2B). The turquoise module was also associated with ICH, suggesting that macrophages and microglia may contribute to the pathophysiology of ICH. Functional annotation showed that the turquoise module was related to immune responses, including leukocyte activation, cell adhesion, and cytokine production (Figure 2C).
To detect the transcription factors (TF) and candidate regulators (CR) that may regulate gene expression in the turquoise module, the researchers conducted LISA. Based on the P-value, 504 potential transcriptional regulators (TR) that may participate in this process were identified. A strict screening strategy was employed in the study to identify key TRs that regulate the turquoise module, including kWithin above the median, LISA P-value <0.01, and TRs encoded by genes within the turquoise module. Using these strategies, ten TRs were identified: Spi1, Rela, Fli1, Irf8, Cebpb, Stat6, Ets1, Stat5a, Stat3, and Ikzf1. These ten TRs were highly expressed in the ICH group samples (Figure 2D), indicating their key roles in the pathophysiology of ICH.
Further analysis of the expression levels of TR proteins in the central nervous system and immune system was conducted using the GeneCards database. These ten TR proteins were highly expressed in immune cells (Figure 2E). Although Spi1 is expressed at low levels in normal brain tissue, it significantly increases after ICH. The PPI network constructed from these TRs (Figure 2F) shows that Spi1 is a hub gene with expression levels higher than those of other TRs.
By analyzing immunohistochemical images of various human tissues obtained from the Human Protein Atlas, the expression level of Spi1 in the brain was further confirmed. Spi1 is relatively lowly expressed in the cerebral cortex and basal ganglia. In contrast, Spi1 is highly expressed in the bone marrow, spleen, and lymph nodes (Figure 2G). Additionally, the area under the ROC curve for Spi1 in diagnosing ICH was 0.969 (Figure 2H).
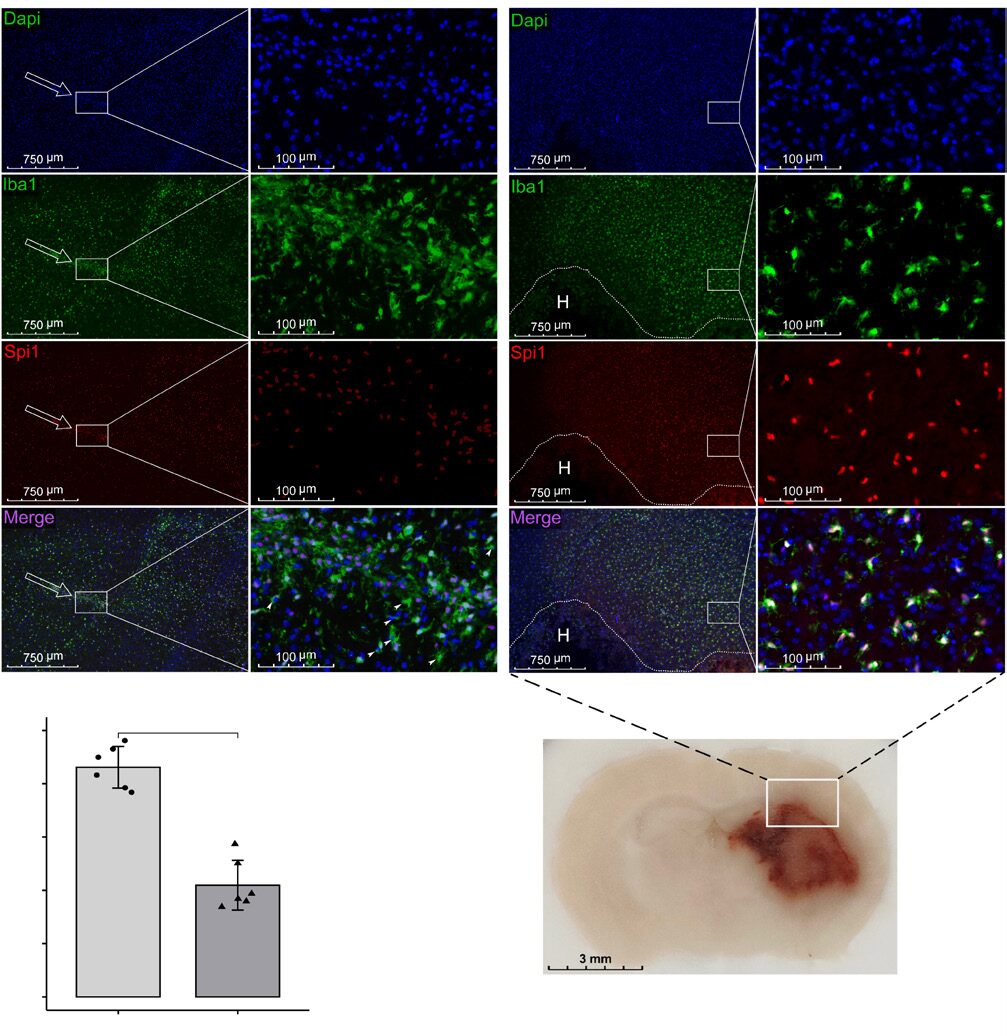
To further validate the changes in Spi1 expression and determine its subcellular localization, collagenase was injected into mice, and they were sacrificed 72 hours later for immunofluorescence staining (n=6). Consistent with the above results, the expression level of Spi1 in normal brain was low (Figure 3A). In contrast, Spi1 signals co-localized with Iba1-positive cells in the area surrounding the hematoma and increased sharply after ICH (Figure 3A and B). These results suggest that Spi1 regulates the activation and infiltration of microglia/macrophages after ICH.
3. Spi1 is a Major Regulator of Monocyte/Macrophage Function
To reveal the mechanisms by which monocytes/macrophages induce brain injury after hemorrhage, the researchers obtained the GSE163256 dataset from the GEO database. This dataset contains gene expression profiles of CD14+ monocytes/macrophages obtained from the peripheral blood and hematoma of ICH patients. The researchers analyzed the data from 15 groups of hematoma and blood samples on day 3 of the experiment.
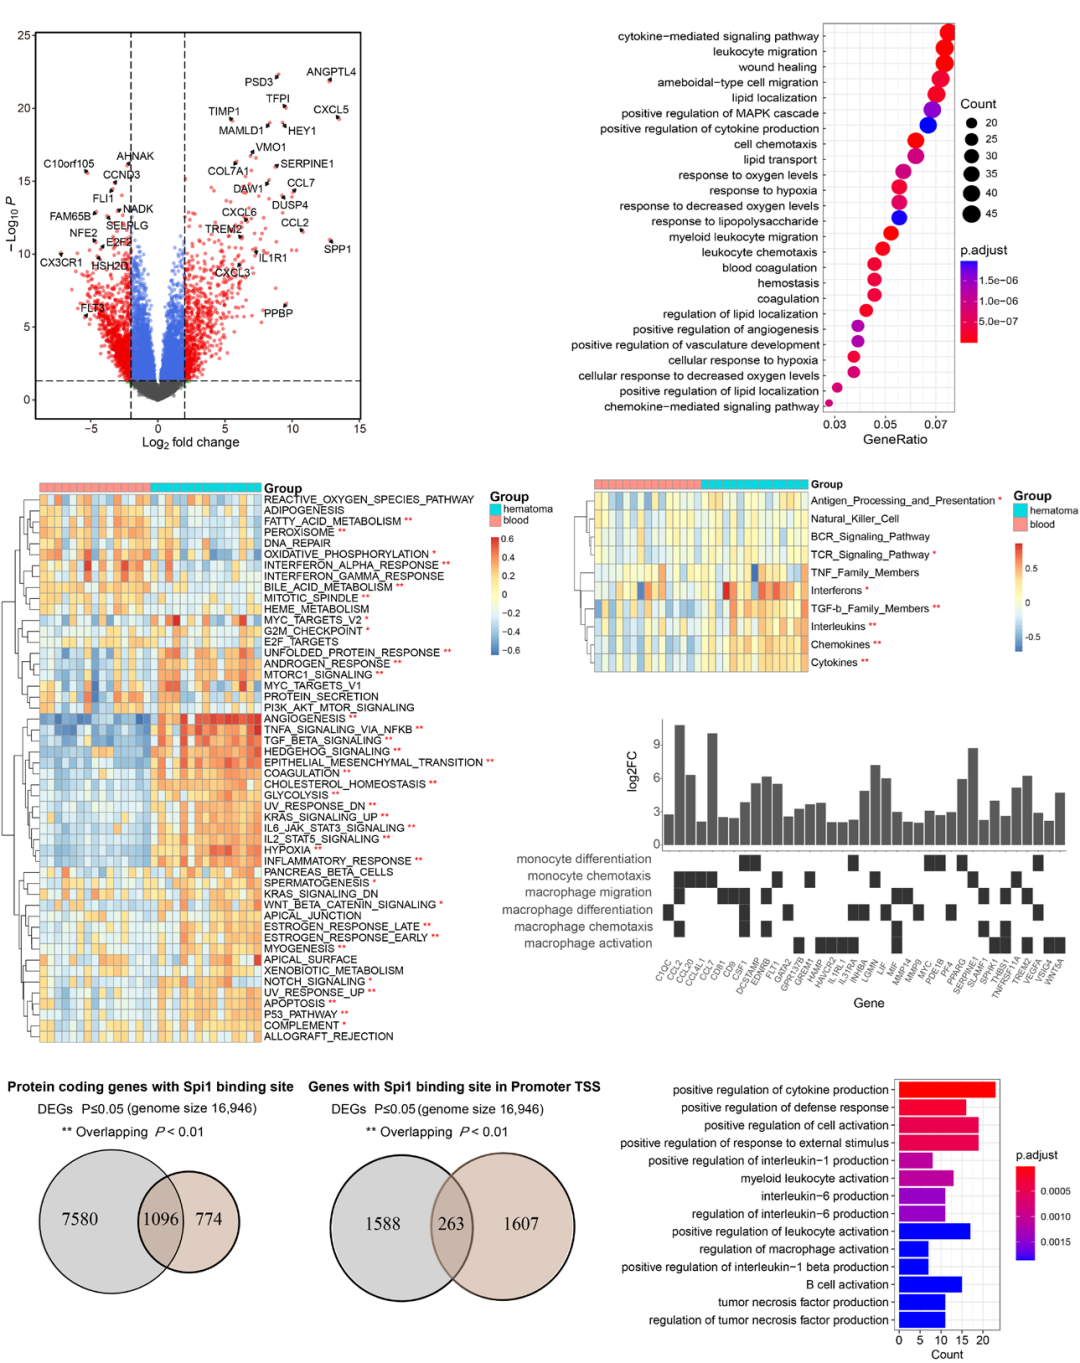
Differential gene expression analysis revealed 734 upregulated genes and 1136 downregulated genes (Figure 4A). GO database analysis showed that the overexpressed genes were significantly enriched in cytokine activity, leukocyte migration, wound healing, cell chemotaxis, response to hypoxia, and coagulation (Figure 4B). GSVA of the 50 hallmark gene sets indicated that angiogenesis, inflammation response, apoptosis, TGF-β signaling, coagulation, and hypoxia gene sets were upregulated (Figure 4C).
Furthermore, the researchers demonstrated the activation of immune-related pathways by performing GSVA on the expression profiles of data from the ImmPort database. Cytokines, chemokines, interleukins, and TGF-β family members were significantly enriched in the hematoma fluid (Figure 4D). As shown in Figure 4E, the GSVA scores for chemotaxis and differentiation of monocytes/macrophages, monocyte aggregation, and macrophage migration in hematoma samples were all higher than those in peripheral blood.
Next, the researchers used the ChIP-seq dataset GSE100889 to identify potential direct targets of Spi1/PU.1. Figure 4F shows that 59% of the promoters of DEGs were enriched with PU.1 binding motifs (overlapping P-value= 5.6×10⁻¹²), suggesting that Spi1 may regulate the expression of these genes. Additionally, 14% of the genes in the ICH dataset exhibited PU.1 binding sites (Figure 4G, overlapping P-value= 4.6×10⁻⁶). GO database analysis indicated that these 263 genes were significantly enriched in cytokine production, myeloid leukocytes, B cell, and macrophage activation (Figure 4H).
4. Spi1 Alters Microglial Cell Cycle and Immune Response
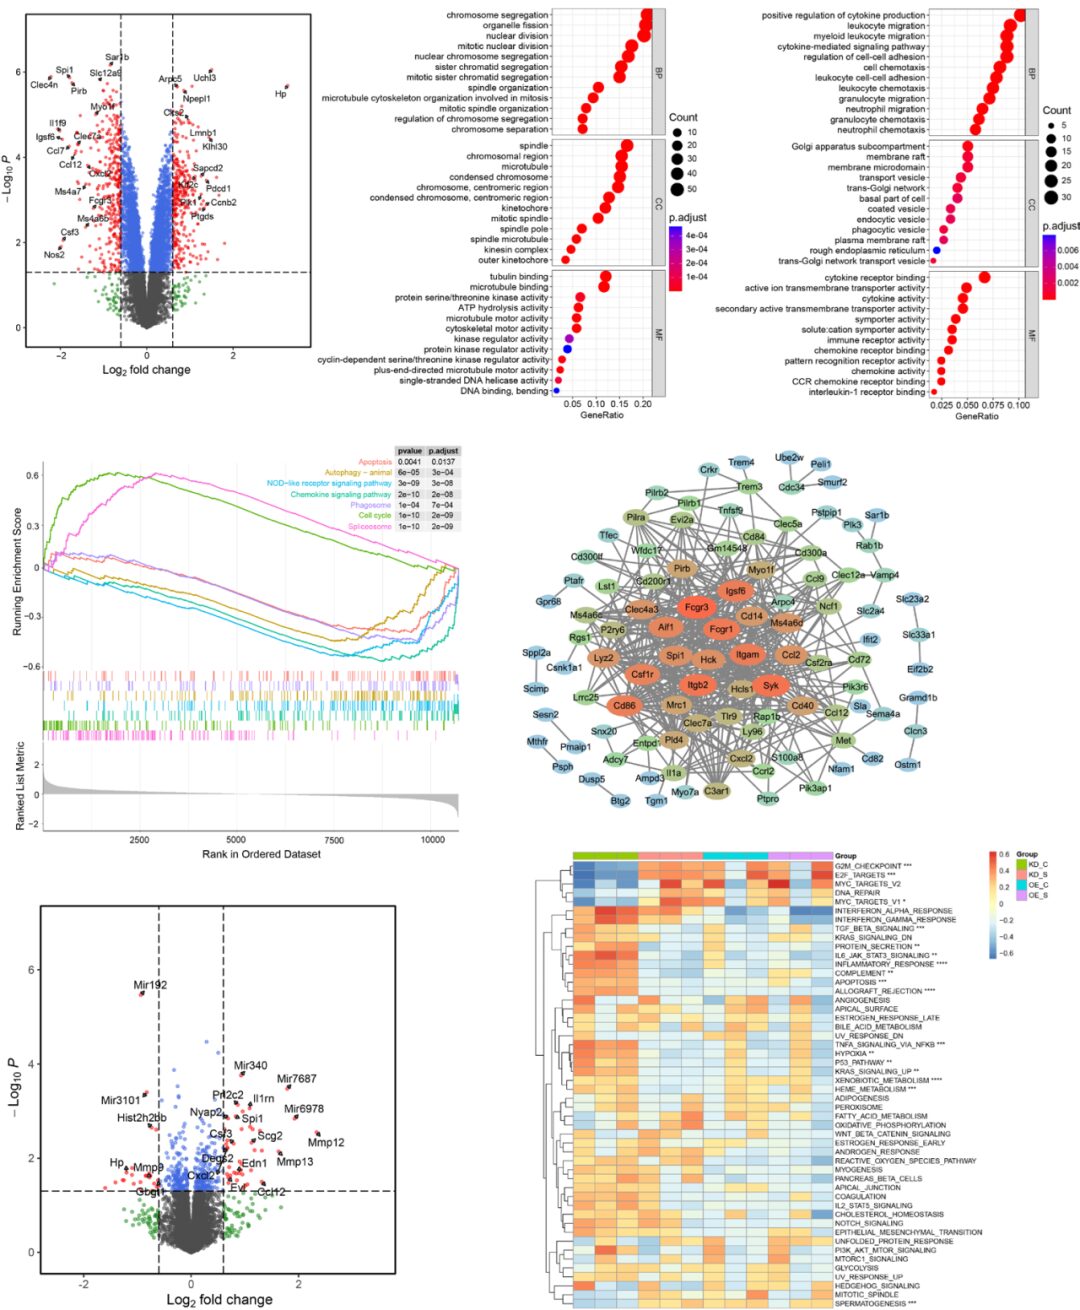
Next, the researchers explored how changes in Spi1 expression affect the transcriptome of microglia using the GSE162526 dataset obtained from the GEO database. This dataset includes data from FACS-sorted BV2 cells that underwent transient shRNA-mediated Spi1 knockdown (KD) or Spi1 cDNA (OE) overexpression.
In the Spi1 KD and scrambled control groups, 320 genes were upregulated and 351 genes were downregulated (Figure 5A). According to Gene Ontology analysis, the upregulated genes were significantly enriched in chromosome segregation, organelle fission, nuclear division, and spindle (Figure 5B). The downregulated genes were primarily enriched in cytokine production, leukocyte migration, and cell chemotaxis (Figure 5C). KEGG pathway analysis GSEA indicated that the significantly enriched functions in the Spi1 KD group included positive regulation of the spliceosome and cell cycle, as well as negative regulation of chemokine signaling, autophagy, phagocytosis, and apoptosis (Figure 5D). Next, the microglial PU.1 ChIP-seq dataset (GSM1533906) was compared with the DEGs. Then, a PPI network of the 141 downregulated genes in the KD group was established, and hub genes were identified based on the STRING database using Cytoscape (Figure 5E). The six identified hub genes—Fcgr1, Itgam, Itgb2, Syk, Hck, and Trem3—are known effectors of the pathogen phagocytosis pathway in microglia. In the Spi1 overexpression and scrambled control groups, 41 genes were upregulated and 24 genes were downregulated (Figure 5F). The ssGSEA of hallmark gene sets indicated that multiple cell cycle checkpoint pathways, such as MYC target V1, G2/M checkpoint, and E2F target pathways, were activated in microglia with Spi1 KD. Inflammatory responses, apoptosis, complement, TNFα-NF-κB signaling, and hypoxia were enriched in the paired control group (Figure 5G).
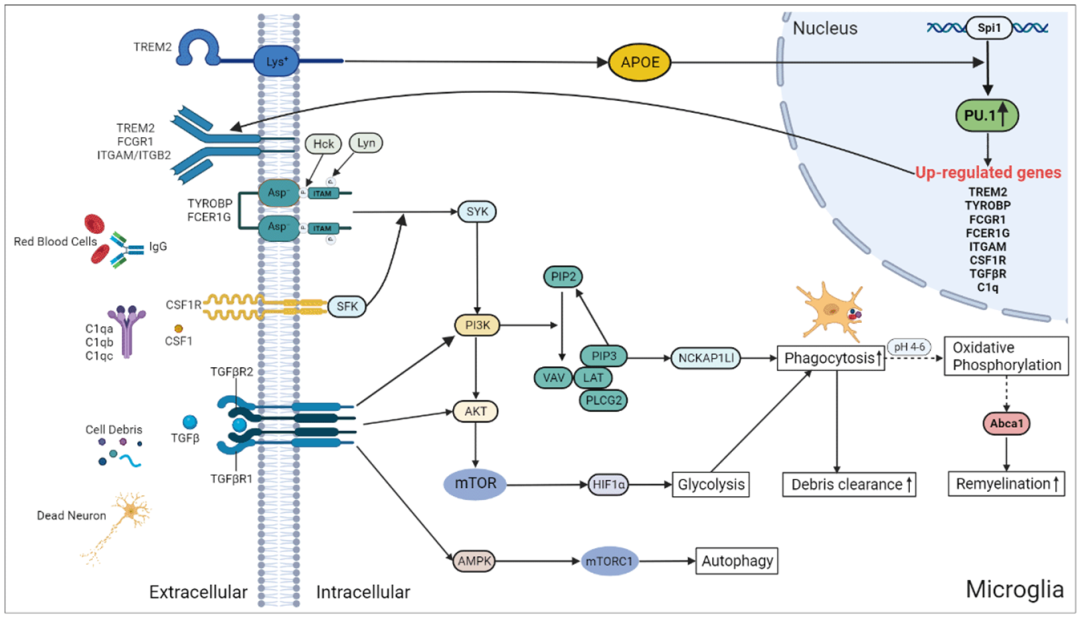
5. Spi1 Promotes Brain Recovery Through Phagocytosis, Glycolysis, and Autophagy
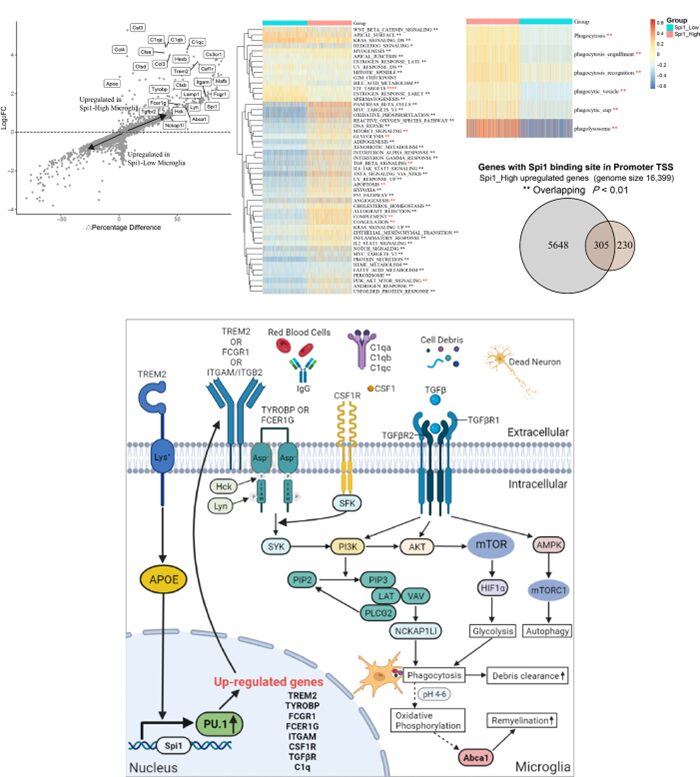
To study the role of Spi1 in microglial function, the researchers reanalyzed the single-cell RNA-seq count matrix of mice with hemorrhagic stroke (GSE167593) using the Seurat package. A total of 1303 microglia were divided into two groups based on Spi1 expression: Spi1-Low (n=651 cells) and Spi1-High (n=652 cells). As shown in Figure 6A, compared to the Spi1-Low group, the Spi1-High group had 535 upregulated and 422 downregulated genes. The ssGSEA of hallmark gene sets showed that TGF-β, mTORC1, and PI3K/AKT/mTOR signaling were activated in Spi1-High microglia (Figure 6B). The Spi1-High microglia also exhibited gene expression changes associated with various remodeling changes, such as glycolysis, angiogenesis, coagulation, and apoptosis. Furthermore, the GSVA scores for phagocytosis-related pathways were significantly higher in the Spi1-High group than in the Spi1-Low group (Figure 6C). This indicates that high levels of Spi1 expression promote the phagocytic capacity of microglia. As shown in Figure 6D, 57% of the upregulated genes in the Spi1-High group had PU.1 binding sites in their promoter regions (overlapping P-value=3.5E-23). In summary, our findings suggest that high Spi1 expression is associated with numerous pathways that promote phagocytosis, glycolysis, and autophagy, including the TGF-β and PI3K/AKT/mTOR signaling pathways (Figure 6E). By interacting with TREM2/TYROBP, FCGR1/FCER1G, CSF1/CSF1, and TGFβ/TGFβR, Spi1 may regulate phagocytosis through the PI3K/AKT/mTOR signaling cascade, thereby participating in a series of processes related to cellular functional recovery, such as enhanced debris clearance and sustained myelin regeneration.
Conclusion
Overall, this study demonstrates that Spi1 is a key immune-related intervention target in ICH, altering the transcriptome of microglia/macrophages and promoting phagocytosis after ICH, while PI3K/AKT/mTOR signaling may be involved in this process. These findings should be confirmed in future studies that will explore the effects of Spi1 knockout and overexpression on neuroinflammation and other related outcomes in ICH.
Translator’s Profile
Rudewen, a Ph.D. candidate in Neurosurgery at Huashan Hospital affiliated with Fudan University, under the supervision of Professor Hu Jin, mainly engages in clinical and basic research on cranial trauma and intracerebral hemorrhage.