The “Code for Seismic Design of Buildings” GB50011-2016, sections 5.1.4 and 5.1.5, stipulates the relationship between the seismic impact coefficient, intensity, site category, design earthquake grouping, structural natural vibration period, and damping ratio. I have developed a UI-selectable plotting tool, which may not be aesthetically pleasing but is functional.
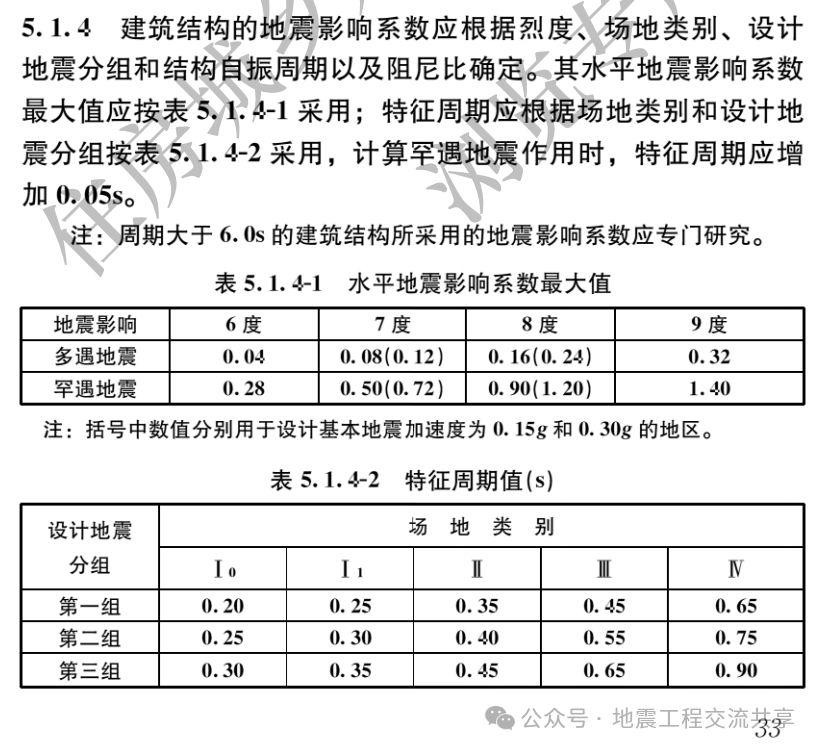
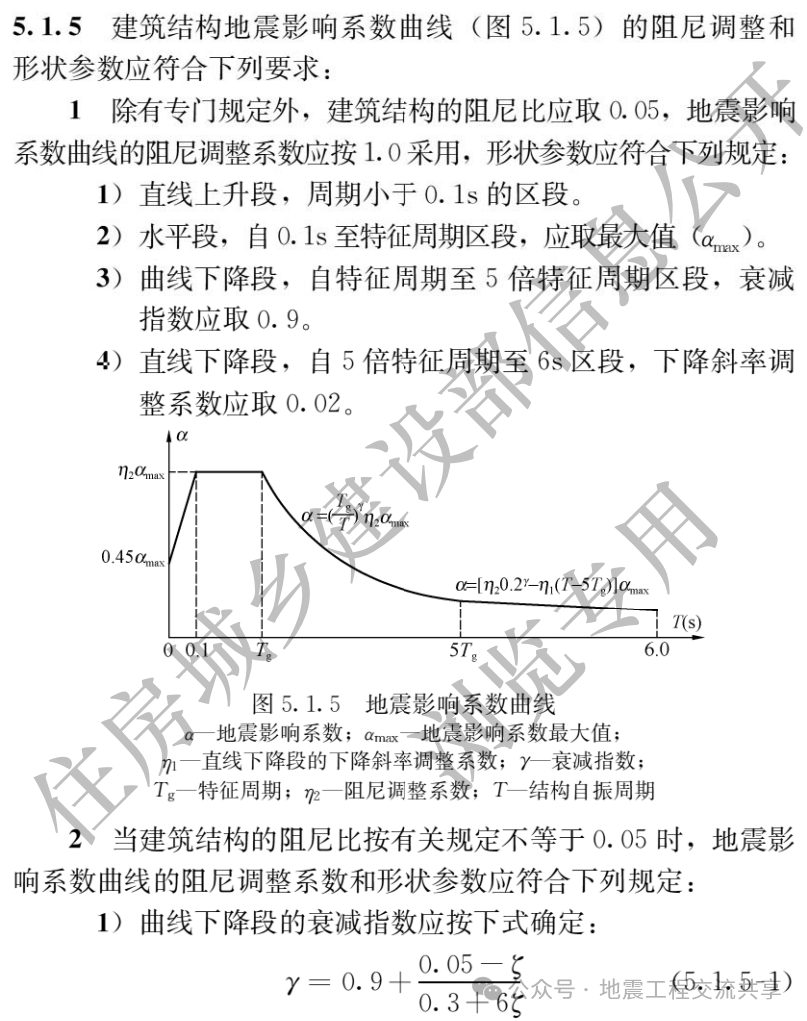
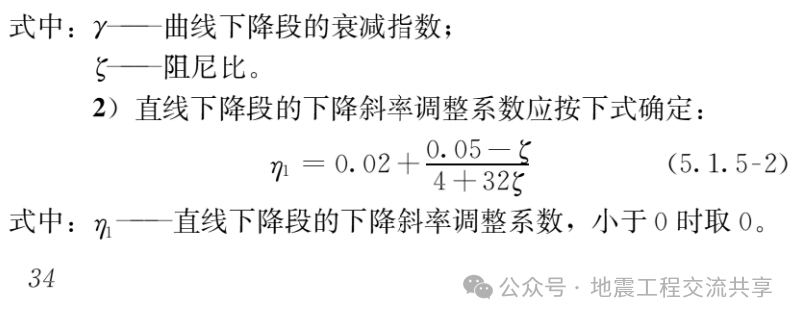
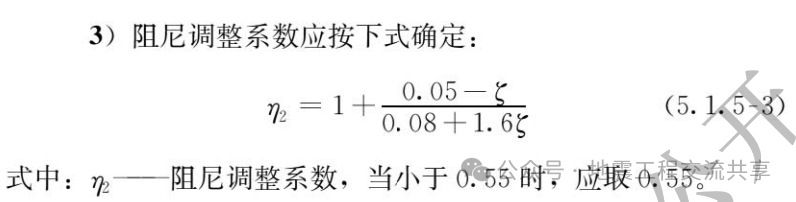
The MATLAB plot is as follows:
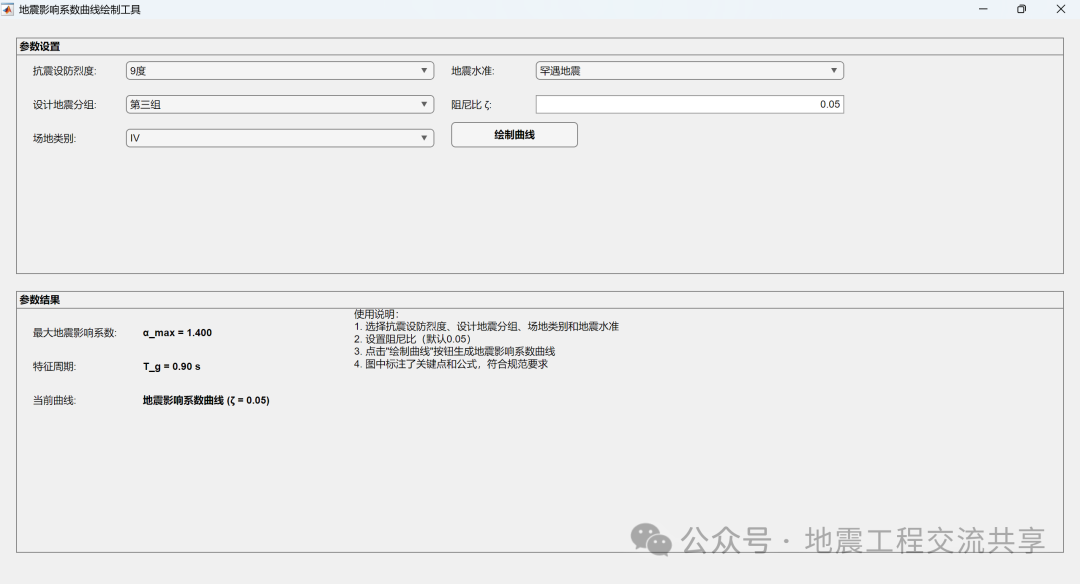
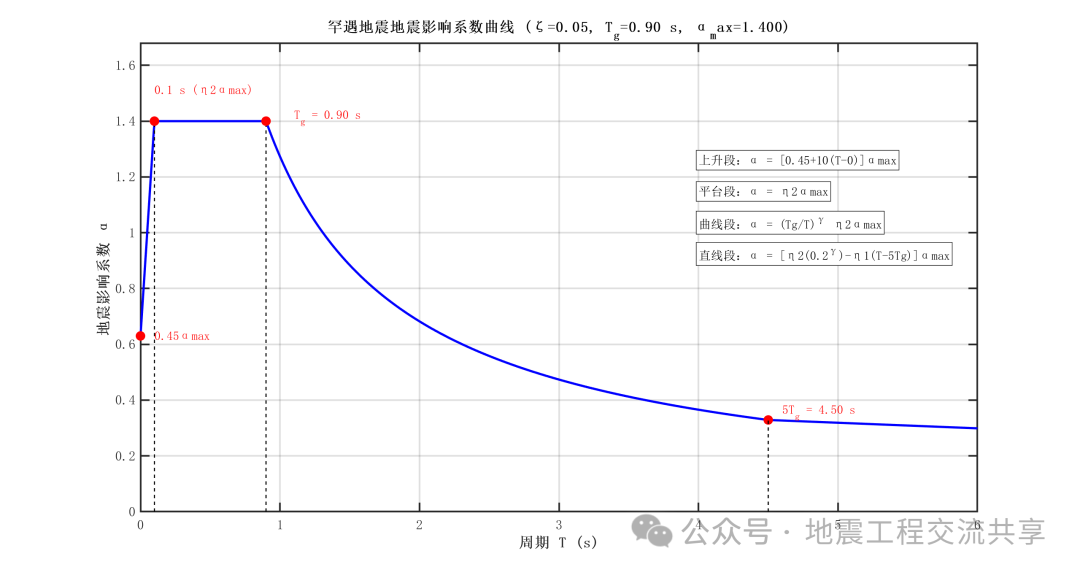
The MATLAB code is as follows:
classdef SeismicAlphaApp < matlab.apps.AppBase
    % Seismic Impact Coefficient Curve Plotting Tool

    properties (Access = public)
        UIFigure          matlab.ui.Figure
        ParameterPanel    matlab.ui.container.Panel
        ResultPanel       matlab.ui.container.Panel
        IntensityDD       matlab.ui.control.DropDown
        GroupDD           matlab.ui.control.DropDown
        SiteDD            matlab.ui.control.DropDown
        LevelDD           matlab.ui.control.DropDown
        ZetaEdit          matlab.ui.control.NumericEditField
        PlotBtn           matlab.ui.control.Button
        AlphaMaxLabel     matlab.ui.control.Label
        TgLabel           matlab.ui.control.Label
        FormulaLabel      matlab.ui.control.Label
    end

    properties (Access = private)
        AlphaTbl          % α_max Table
        TgTable           % Characteristic Period Table
    end

    methods (Access = private)

        % ---------- Initialization ----------
        function setupAlphaTable(app)
            app.AlphaTbl = containers.Map();
            app.AlphaTbl('6 degrees_Most Likely Earthquake')          = 0.04;
            app.AlphaTbl('6 degrees_Design Earthquake')          = 0.12;
            app.AlphaTbl('6 degrees_Rare Earthquake')          = 0.28;

            app.AlphaTbl('7 degrees(0.10g)_Most Likely Earthquake')   = 0.08;
            app.AlphaTbl('7 degrees(0.10g)_Design Earthquake')   = 0.23;
            app.AlphaTbl('7 degrees(0.10g)_Rare Earthquake')   = 0.50;

            app.AlphaTbl('7 degrees(0.15g)_Most Likely Earthquake')   = 0.12;
            app.AlphaTbl('7 degrees(0.15g)_Design Earthquake')   = 0.33;
            app.AlphaTbl('7 degrees(0.15g)_Rare Earthquake')   = 0.72;

            app.AlphaTbl('8 degrees(0.20g)_Most Likely Earthquake')   = 0.16;
            app.AlphaTbl('8 degrees(0.20g)_Design Earthquake')   = 0.45;
            app.AlphaTbl('8 degrees(0.20g)_Rare Earthquake')   = 0.90;

            app.AlphaTbl('8 degrees(0.30g)_Most Likely Earthquake')   = 0.24;
            app.AlphaTbl('8 degrees(0.30g)_Design Earthquake')   = 0.68;
            app.AlphaTbl('8 degrees(0.30g)_Rare Earthquake')   = 1.20;

            app.AlphaTbl('9 degrees_Most Likely Earthquake')          = 0.32;
            app.AlphaTbl('9 degrees_Design Earthquake')          = 0.90;
            app.AlphaTbl('9 degrees_Rare Earthquake')          = 1.40;
        end

        function setupTgTable(app)
            % Rows: Group 1, Group 2, Group 3
            % Columns: I₀ I₁ II III IV
            app.TgTable = [0.20 0.25 0.35 0.45 0.65;
                           0.25 0.30 0.40 0.55 0.75;
                           0.30 0.35 0.45 0.65 0.90];
        end

        function [alpha_max, T_g] = getParameters(app)
            intensity = app.IntensityDD.Value;
            group     = app.GroupDD.Value;
            site      = app.SiteDD.Value;
            level     = app.LevelDD.Value;

            key = [intensity '_' level];
            alpha_max = app.AlphaTbl(key);

            groups = {'Group 1','Group 2','Group 3'};
            sites  = {'I₀','I₁','II','III','IV'};
            row = find(strcmp(groups, group));
            col = find(strcmp(sites, site));
            T_g = app.TgTable(row, col);
        end

        function updateDisplay(app)
            [alpha_max, T_g] = app.getParameters();
            zeta = app.ZetaEdit.Value;

            app.AlphaMaxLabel.Text = sprintf('α_max = %.3f', alpha_max);
            app.TgLabel.Text       = sprintf('T_g = %.2f s', T_g);
            app.FormulaLabel.Text  = sprintf('Seismic Impact Coefficient Curve (ζ = %.2f)', zeta);
        end

        % ---------- Plotting ----------
        function plotCurve(app)
            [alpha_max, T_g] = app.getParameters();
            zeta = app.ZetaEdit.Value;

            % Damping adjustment coefficient
            if abs(zeta - 0.05) < 1e-5
                gamma = 0.9; eta1 = 0.02; eta2 = 1.0;
            else
                gamma = 0.9 + (0.05 - zeta) / (0.3 + 6*zeta);
                eta1  = 0.02 + (0.05 - zeta) / (4 + 32*zeta);
                eta2  = max(1 + (0.05 - zeta) / (0.08 + 1.6*zeta), 0.55);
            end

            % Calculate α(T)
            T     = linspace(0, 6, 1000);
            alpha = zeros(size(T));
            for k = 1:numel(T)
                t = T(k);
                if t < 0.1
                    alpha(k) = 0.45*alpha_max + 10*(eta2*alpha_max - 0.45*alpha_max)*t;
                elseif t <= T_g
                    alpha(k) = eta2*alpha_max;
                elseif t <= 5*T_g
                    alpha(k) = (T_g/t)^gamma * eta2*alpha_max;
                else
                    alpha(k) = max(eta2*0.2^gamma*alpha_max - eta1*(t-5*T_g), 0);
                end
            end

            % Create figure
            fig = figure('Name', 'Seismic Impact Coefficient Curve', ...
                         'NumberTitle', 'off', ...
                         'Position', [200, 200, 900, 700], 'Color', 'w');
            ax = axes('Parent', fig);
            plot(ax, T, alpha, 'b-', 'LineWidth', 2);
            hold(ax, 'on');
            grid(ax, 'on');

            % ---------- Key Points ----------
            % 1) 0.1 s
            alpha_01 = 0.45*alpha_max + 10*(eta2*alpha_max - 0.45*alpha_max)*0.1;

            % Add 0.1s marker line
            plot(ax, [0.1, 0.1], [0, alpha_01], 'k--', 'LineWidth', 1);

            plot(ax, 0.1, alpha_01, 'ro', 'MarkerSize', 8, 'MarkerFaceColor', 'r');
            text(ax, 0.1, alpha_01 + 0.08*alpha_max, '0.1 s (η2αmax)', ...
                 'FontSize', 11, 'FontName', 'SimSun', 'Color', 'r');

            plot(ax, 0.0, 0.45*alpha_01, 'ro', 'MarkerSize', 8, 'MarkerFaceColor', 'r');
            text(ax, 0.1, 0.45*alpha_01, '0.45αmax', ...
                 'FontSize', 11, 'FontName', 'SimSun', 'Color', 'r');

            % 2) T_g
            plot(ax, [T_g T_g], [0 eta2*alpha_max], 'k--', 'LineWidth', 1);
            % plot(ax, [0 T_g], [eta2*alpha_max eta2*alpha_max], 'k--', 'LineWidth', 1);
            plot(ax, T_g, eta2*alpha_max, 'ro', 'MarkerSize', 8, 'MarkerFaceColor', 'r');

            % Adjust T_g label position
            if T_g < 1.0
                text_x = T_g + 0.2;
            else
                text_x = T_g + 0.1;
            end
            text(ax, text_x, eta2*alpha_max + 0.01*alpha_max, ...
                 sprintf('T_g = %.2f s', T_g), ...
                 'FontSize', 11, 'FontName', 'SimSun', 'Color', 'r');

            % 3) 5T_g
            if 5*T_g <= 6
                a5 = (T_g/(5*T_g))^gamma * eta2*alpha_max;
                plot(ax, 5*T_g, a5, 'ro', 'MarkerSize', 8, 'MarkerFaceColor', 'r');
                plot(ax, [5*T_g 5*T_g], [0 a5], 'k--', 'LineWidth', 1);

                % Determine text label direction based on position
                if 5*T_g > 4.5
                    text(ax, 5*T_g - 0.5, a5 + 0.02*alpha_max, ...
                         sprintf('5T_g = %.2f s', 5*T_g), ...
                         'FontSize', 11, 'FontName', 'SimSun', 'Color', 'r', ...
                         'HorizontalAlignment', 'right');
                else
                    text(ax, 5*T_g + 0.1, a5 + 0.02*alpha_max, ...
                         sprintf('5T_g = %.2f s', 5*T_g), ...
                         'FontSize', 11, 'FontName', 'SimSun', 'Color', 'r');
                end
            end

            % ---------- Formula Explanation (Right Side Blank) ----------
            xTxt = 4.0;
            yTop = 0.9*alpha_max;
            dy = 0.08*alpha_max;

            % Add text box background
            text(ax, xTxt, yTop, 'Rising Segment: α = [0.45+10(T-0)]αmax', ...
                 'FontSize', 11, 'FontName', 'SimSun', 'BackgroundColor', 'white', ...
                 'EdgeColor', 'black', 'Margin', 2);
            text(ax, xTxt, yTop-dy, 'Platform Segment: α = η2αmax', ...
                 'FontSize', 11, 'FontName', 'SimSun', 'BackgroundColor', 'white', ...
                 'EdgeColor', 'black', 'Margin', 2);
            text(ax, xTxt, yTop-2*dy, 'Curve Segment: α = (Tg/T)^γ η2αmax', ...
                 'FontSize', 11, 'FontName', 'SimSun', 'BackgroundColor', 'white', ...
                 'EdgeColor', 'black', 'Margin', 2);
            if 5*T_g < 6
                text(ax, xTxt, yTop-3*dy, 'Linear Segment: α = [η2(0.2^γ)-η1(T-5Tg)]αmax', ...
                     'FontSize', 11, 'FontName', 'SimSun', 'BackgroundColor', 'white', ...
                     'EdgeColor', 'black', 'Margin', 2);
            end

            % ---------- Axes and Title ----------
            xlabel(ax, 'Period T (s)', 'FontSize', 14, 'FontName', 'SimSun', 'FontWeight', 'bold');
            ylabel(ax, 'Seismic Impact Coefficient α', 'FontSize', 14, 'FontName', 'SimSun', 'FontWeight', 'bold');
            level = app.LevelDD.Value;
            title(ax, sprintf('%s Seismic Impact Coefficient Curve (ζ=%.2f, T_g=%.2f s, α_max=%.3f)', ...
                              level, zeta, T_g, alpha_max), ...
                  'FontSize', 14, 'FontName', 'SimSun', 'FontWeight', 'bold');
            xlim(ax, [0 6]);
            ylim(ax, [0 alpha_max*1.2]);
            set(ax, 'FontName', 'SimSun', 'FontSize', 12, 'LineWidth', 1.5);
            box(ax, 'on');
            hold(ax, 'off');
        end
    end

    % ---------- UI Construction ----------
    methods (Access = public)

        function app = SeismicAlphaApp
            app.UIFigure = uifigure('Name', 'Seismic Impact Coefficient Curve Plotting Tool', ...
                                    'Position', [100, 100, 850, 650]);

            app.setupAlphaTable();
            app.setupTgTable();
            app.createParameterPanel();
            app.createResultPanel();
            app.setupCallbacks();
            app.updateDisplay();
        end

        function createParameterPanel(app)
            app.ParameterPanel = uipanel(app.UIFigure, ...
                'Title', 'Parameter Settings', ...
                'Position', [20, 350, 810, 280], ...
                'FontSize', 12, 'FontWeight', 'bold');

            % Seismic Design Intensity
            uilabel(app.ParameterPanel, 'Text', 'Seismic Design Intensity:', ...
                    'Position', [20, 230, 100, 22], 'FontSize', 11);
            app.IntensityDD = uidropdown(app.ParameterPanel, ...
                'Items', {'6 degrees','7 degrees(0.10g)','7 degrees(0.15g)','8 degrees(0.20g)','8 degrees(0.30g)','9 degrees'}, ...
                'Position', [130, 230, 150, 22], 'Value', '7 degrees(0.10g)', 'FontSize', 11);

            % Design Earthquake Group
            uilabel(app.ParameterPanel, 'Text', 'Design Earthquake Group:', ...
                    'Position', [20, 190, 100, 22], 'FontSize', 11);
            app.GroupDD = uidropdown(app.ParameterPanel, ...
                'Items', {'Group 1','Group 2','Group 3'}, ...
                'Position', [130, 190, 150, 22], 'Value', 'Group 1', 'FontSize', 11);

            % Site Category
            uilabel(app.ParameterPanel, 'Text', 'Site Category:', ...
                    'Position', [20, 150, 100, 22], 'FontSize', 11);
            app.SiteDD = uidropdown(app.ParameterPanel, ...
                'Items', {'I₀','I₁','II','III','IV'}, ...
                'Position', [130, 150, 150, 22], 'Value', 'II', 'FontSize', 11);

            % Earthquake Level
            uilabel(app.ParameterPanel, 'Text', 'Earthquake Level:', ...
                    'Position', [300, 230, 100, 22], 'FontSize', 11);
            app.LevelDD = uidropdown(app.ParameterPanel, ...
                'Items', {'Most Likely Earthquake','Design Earthquake','Rare Earthquake'}, ...
                'Position', [400, 230, 150, 22], 'Value', 'Most Likely Earthquake', 'FontSize', 11);

            % Damping Ratio
            uilabel(app.ParameterPanel, 'Text', 'Damping Ratio ζ:', ...
                    'Position', [300, 190, 100, 22], 'FontSize', 11);
            app.ZetaEdit = uieditfield(app.ParameterPanel, 'numeric', ...
                'Value', 0.05, 'Limits', [0.02, 0.2], ...
                'Position', [400, 190, 150, 22], 'FontSize', 11);

            % Plot Button
            app.PlotBtn = uibutton(app.ParameterPanel, 'push', ...
                'Text', 'Plot Curve', ...
                'Position', [300, 150, 150, 30], ...
                'FontSize', 12, 'FontWeight', 'bold');
        end

        function createResultPanel(app)
            app.ResultPanel = uipanel(app.UIFigure, ...
                'Title', 'Parameter Results', ...
                'Position', [20, 20, 810, 310], ...
                'FontSize', 12, 'FontWeight', 'bold');

            uilabel(app.ResultPanel, 'Text', 'Maximum Seismic Impact Coefficient:', ...
                    'Position', [20, 250, 120, 22], 'FontSize', 11);
            app.AlphaMaxLabel = uilabel(app.ResultPanel, ...
                'Text', '', 'Position', [150, 250, 200, 22], ...
                'FontSize', 11, 'FontWeight', 'bold');

            uilabel(app.ResultPanel, 'Text', 'Characteristic Period:', ...
                    'Position', [20, 210, 120, 22], 'FontSize', 11);
            app.TgLabel = uilabel(app.ResultPanel, ...
                'Text', '', 'Position', [150, 210, 200, 22], ...
                'FontSize', 11, 'FontWeight', 'bold');

            uilabel(app.ResultPanel, 'Text', 'Current Curve:', ...
                    'Position', [20, 170, 120, 22], 'FontSize', 11);
            app.FormulaLabel = uilabel(app.ResultPanel, ...
                'Text', '', 'Position', [150, 170, 400, 22], ...
                'FontSize', 11, 'FontWeight', 'bold');

            % Instruction Text
            infoText = ['Usage Instructions:\n' ...
                        '1. Select seismic design intensity, design earthquake group, site category, and earthquake level\n' ...
                        '2. Set damping ratio (default 0.05)\n' ...
                        '3. Click the "Plot Curve" button to generate the seismic impact coefficient curve\n' ...
                        '4. Key points and formulas are annotated in the figure, complying with specification requirements'];
            uilabel(app.ResultPanel, 'Text', sprintf(infoText), ...
                    'Position', [400, 200, 380, 90], ...
                    'VerticalAlignment', 'top', 'FontSize', 10);
        end

        function setupCallbacks(app)
            app.IntensityDD.ValueChangedFcn = @(~,~) app.updateDisplay();
            app.GroupDD.ValueChangedFcn     = @(~,~) app.updateDisplay();
            app.SiteDD.ValueChangedFcn      = @(~,~) app.updateDisplay();
            app.LevelDD.ValueChangedFcn     = @(~,~) app.updateDisplay();
            app.ZetaEdit.ValueChangedFcn    = @(~,~) app.updateDisplay();
            app.PlotBtn.ButtonPushedFcn     = @(~,~) app.plotCurve();
        end
    end
end