Abstract
Background:A nebulizer is a medical device that delivers aerosolized medication directly to the lungs to treat various respiratory diseases. However, breathing patterns, respiratory rates, airway diameters, and the amount of medication delivered by the nebulizer may be related to respiratory diseases.
Methods:In this study, we developed a breathing simulator consisting of an airway model, artificial lung, flow sensor, and aerosol collection filter. Various breathing patterns were generated using a linear actuator and cylinder. We tested six home nebulizers (jet nebulizer (2), static mesh nebulizer (2), and vibrating mesh nebulizer (2)). The nebulizers were evaluated under two conditions (i.e., during nebulization and constant delivery of 1.3 mL) using four breathing patterns specified in ISO 27427:2013, including normal adult, asthma patients, and COPD.
Results:One of the vibrating mesh nebulizers exhibited the highest dose delivery efficiency. The medication delivery efficiency of the nebulizer was found to depend on the breathing pattern.
Conclusion:We proposed a quantitative method for assessing drug delivery efficiency and calculation parameters, including considerations for constant delivery and residual volume. This study indicates that delivery rate and breathing pattern should be considered when evaluating the medication delivery efficiency of nebulizers.
Background
Nebulizers are primarily used to treat and manage patients with respiratory diseases such as asthma, chronic obstructive pulmonary disease (COPD), cystic fibrosis, or pneumonia. The advantage of nebulized medications is their direct delivery to the lungs. Nebulizers can be categorized into jet, ultrasonic, and mesh nebulizers based on their working principles. Jet nebulizers have a larger delivery rate and variability in mass distribution, depending on the combination of nozzles and compressors, but they are noisy, vibrate during use, and have a large residual volume. Mesh nebulizers were developed to overcome these limitations by generating aerosols through holes in a mesh or plate. Mesh nebulizers are classified into passive (static) or active (vibrating) based on their working principle. Passive (static) mesh nebulizers use ultrasonic horns to indirectly vibrate static meshes, while active (vibrating) mesh nebulizers have meshes mounted on vibrating piezoelectric rings.
For oral and intravenous administration, drug delivery is clearly 100%, but the therapeutic delivery efficiency of aerosol-based treatments is only 10-15%, depending on the amount of loaded medication. However, due to the direct entry of medication into the lungs, aerosol delivery has a high therapeutic effect, making aerosol therapy based on nebulizers advantageous due to lower drug doses, rapid onset, fewer side effects, and convenience compared to systemic administration. However, the amount of medication delivered by nebulizers varies significantly. Physiological factors such as breathing patterns and airway diameters depend on the type of disease and can affect drug delivery efficiency. Additionally, particle size, delivery rate, residual volume, and nebulization time depend on the type of nebulizer. It has been reported that in vitro simulation of breathing patterns can estimate the in vivo aerosol delivery of nebulizers, which is more convenient and reproducible than in vivo testing. Furthermore, comparative studies using breathing simulators have shown that the amount of medication delivered by mesh nebulizers is equal to or greater than that of jet nebulizers.
The International Organization for Standardization (ISO) 27427:2013 (Anesthesia and Respiratory Equipment — Nebulizer Systems and Components) defines a method for measuring nebulizer delivery and delivery rates but does not include methods for testing drug delivery efficiency. Currently, there are no standard tests for measuring drug delivery efficiency, although some in vivo and in vitro breathing simulator studies have described potential testing methods. In vivo animal models may not adequately reflect the real clinical environment, while in vitro breathing simulator testing provides a more convenient testing method than in vivo methods and yields reproducible results.
In this study, we developed a breathing simulator that meets the capacity control requirements of ventilators. Six types of home nebulizers (jet, static mesh, and vibrating mesh) were tested for nebulization duration using an in vitro adult airway model and four breathing patterns (ISO 27427:2013, normal adult, asthma, and COPD modes).
Results
Breathing Patterns
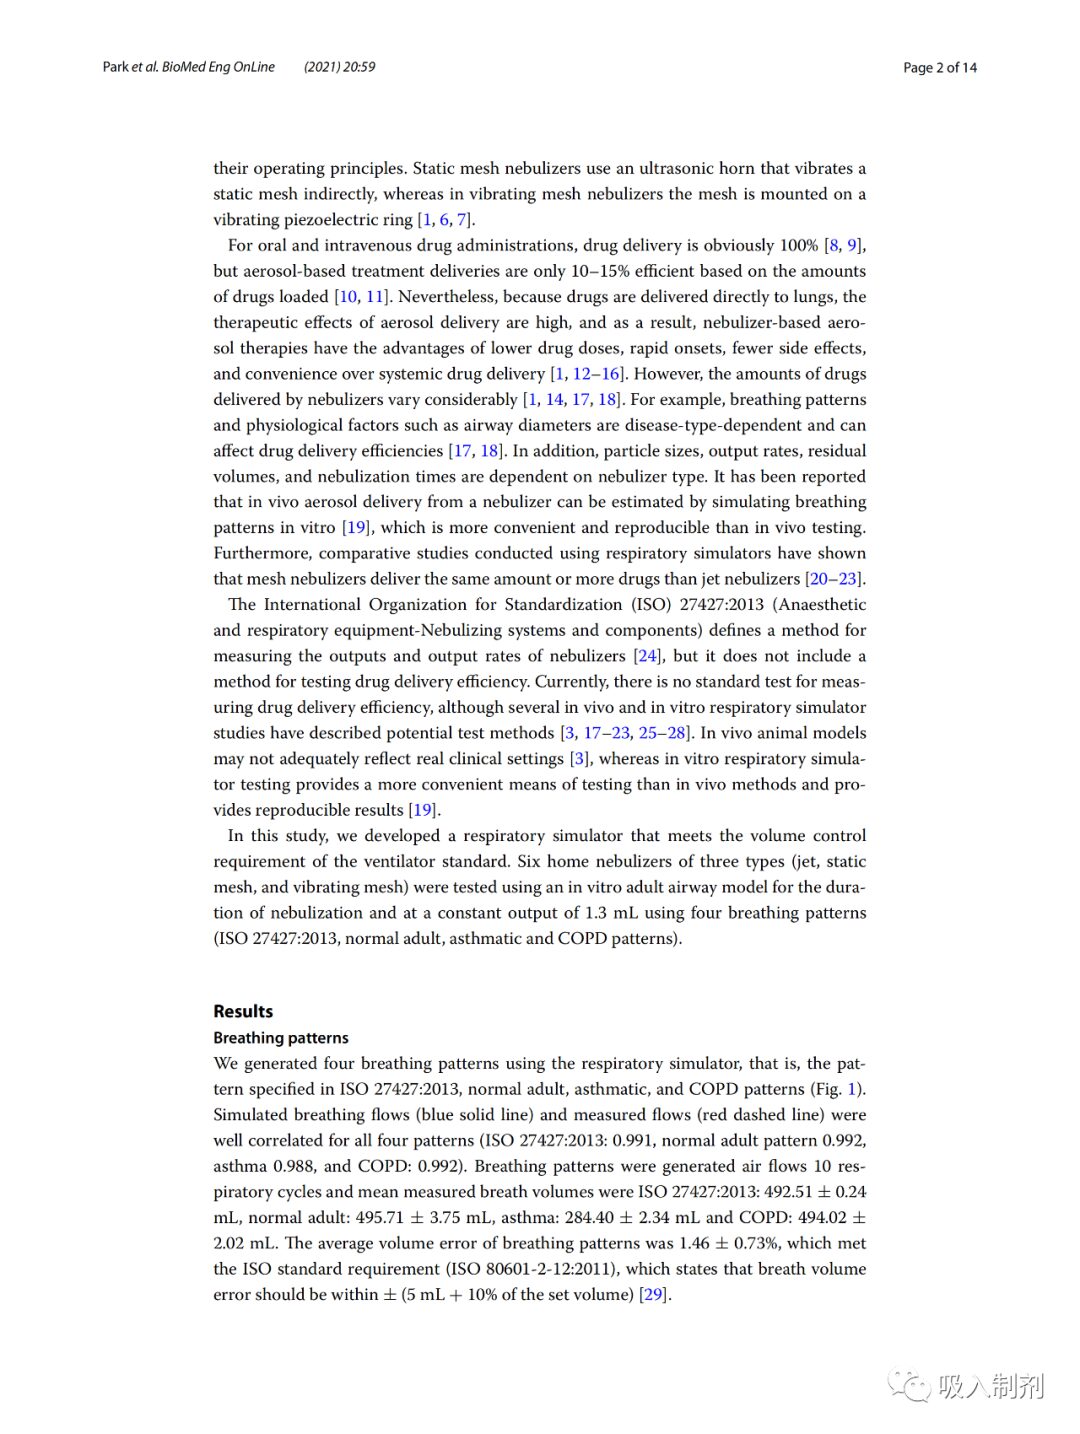
We generated four breathing patterns using the breathing simulator, namely the patterns specified in ISO 27427:2013, normal adult, asthma, and COPD (Figure 1). For all four patterns (ISO 27427:2013: 0.991, normal adult pattern 0.992, asthma 0.988, and COPD: 0.992), there was a good correlation between simulated breathing flow (blue solid line) and measured flow (red dashed line). Over 10 breathing cycles, the average measured tidal volumes were ISO 27427:2013: 492.51 ± 0.24 mL, normal adult: 495.71 ± 3.75 mL, asthma: 284.40 ± 2.34 mL, and COPD: 494.02 ± 2.02 mL. The average volume error of the breathing pattern was 1.46 ± 0.73%, complying with ISO standard requirements (ISO 80601-2-12:2011), which stipulates that the volume error should be within ± (5 mL + 10% of the set volume).
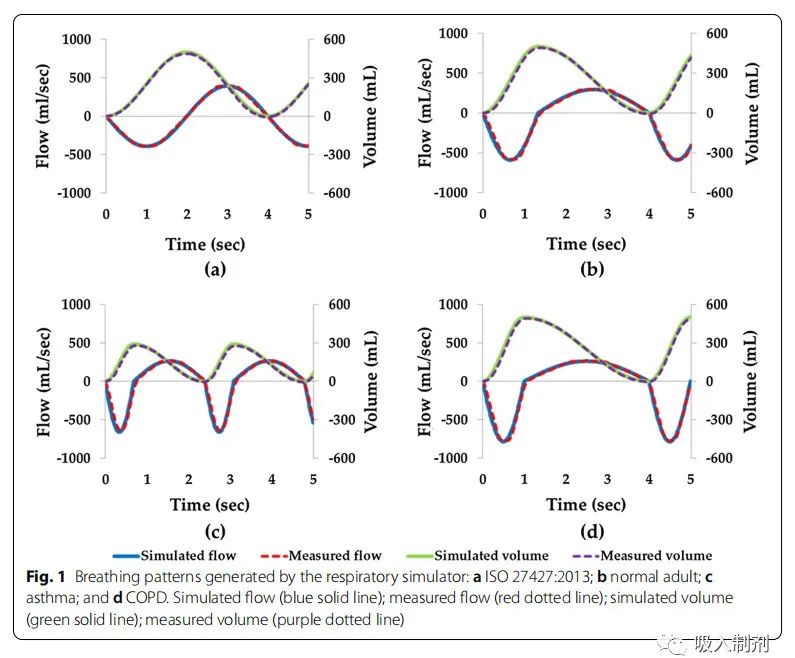
Figure 1 Breathing patterns generated by the breathing simulator: a ISO 27427:2013; b normal adult; c asthma; and d COPD. Simulated flow (blue solid line); measured flow (red dashed line); simulated volume (green solid line); measured volume (purple dashed line)
Comparison of Delivery Efficiency for Different Breathing Patterns
Experiment1
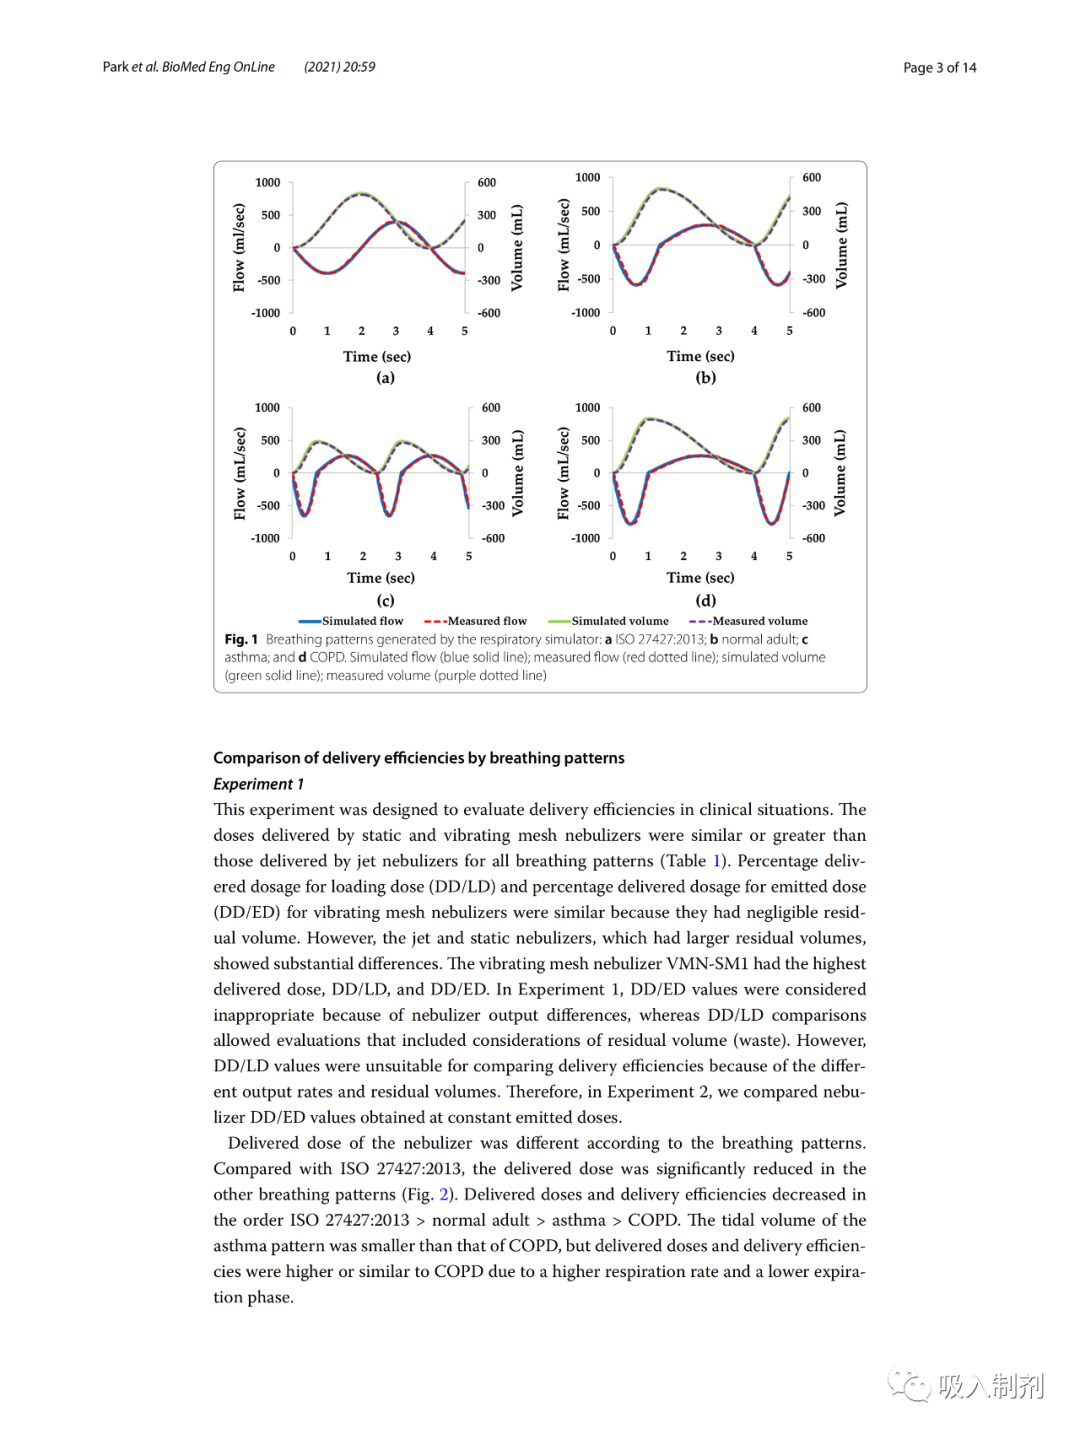
This experiment aimed to assess delivery efficiency under clinical conditions. For all breathing patterns, the doses delivered by static and vibrating mesh nebulizers were similar to or greater than those delivered by jet nebulizers (Table 1). The delivery dose percentage of the vibrating mesh nebulizer (DD/LD) and the delivery dose percentage of the jet nebulizer (DD/ED) were similar, as their residual volumes were negligible. However, jet and static nebulizers with larger residual volumes showed significant differences. The vibrating mesh nebulizer VMN-SM1 had the highest delivery dose, DD/LD, and DD/ED. In Experiment 1 , the DD/ED values were considered inappropriate due to differences in nebulizer delivery, while the DD/LD values were relatively acceptable for evaluation, including consideration of residual volume (wasted portion). However, DD/LD values are not suitable for comparing delivery efficiency due to different output rates and residual amounts. Therefore, in Experiment 2 , we compared the DD/ED values obtained under constant jet doses.
The delivery doses of the nebulizers varied according to the breathing patterns. Compared to ISO 27427:2013, the delivery doses of other breathing patterns were significantly lower (Figure 2). The order of delivery doses and delivery efficiency decreased as follows: ISO 27427:2013 > normal adult > asthma > COPD.
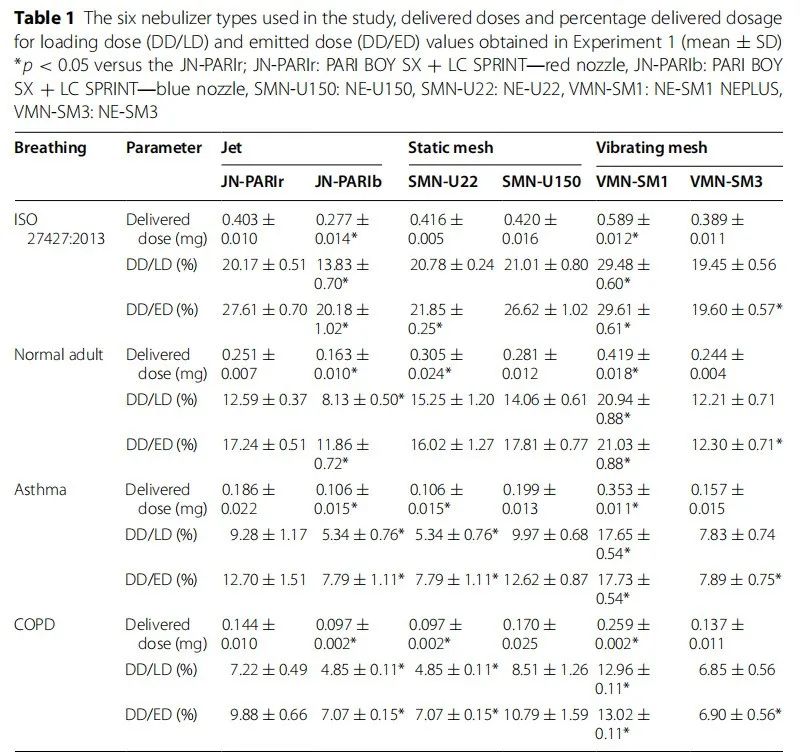
Table 1 Types of nebulizers used in the study, delivery dose percentage of loaded dose (DD/LD), and delivery dose percentage of jet dose (DD/ED) obtained in Experiment 1 (mean ± SD) *p < 0.05 compared to JN -PARIr; JN-PARIr: PARI BOY SX + LC SPRINT—red nozzle, JN-PARIb: PARI BOY SX + LC SPRINT—blue nozzle, SMN-U150: NE-U150, SMN-U22: NE-U22, VMN-SM1: NE- SM1 NEPLUS, VMN-SM3: NE-SM3
Experiment2
Experiment 2 aimed to quantitatively assess the drug solution delivery efficiency. To keep the jet doses the same, even in the mesh nebulizers, the residual volume was intentionally maintained. Thus, DD/LD became lower than in Experiment 1. We compared the drug delivery efficiency of all six nebulizers using the same jet doses (Table 2). For all breathing patterns, the DD/ED of the VMN-SM1 nebulizer was higher than that of other nebulizers.
In Experiment 2, the jet dose (ED) of all nebulizers was set to 1.3 mL to illustrate the residual volume of JN-PARIb. Except for JN-PARIb, the ED of each nebulizer was lower than in Experiment 1. Compared to Experiment 1, the delivery doses (DDs) in Experiment 2 were similarly reduced due to the decrease in ED, thus, the DD/ED values in Experiment 1 and 2 were similar.
The delivery doses and delivery efficiencies for different breathing patterns followed the order of ISO 27427:2013 > normal adult > asthma > COPD, which was the same as observed in Experiment 1 (Figure 3).
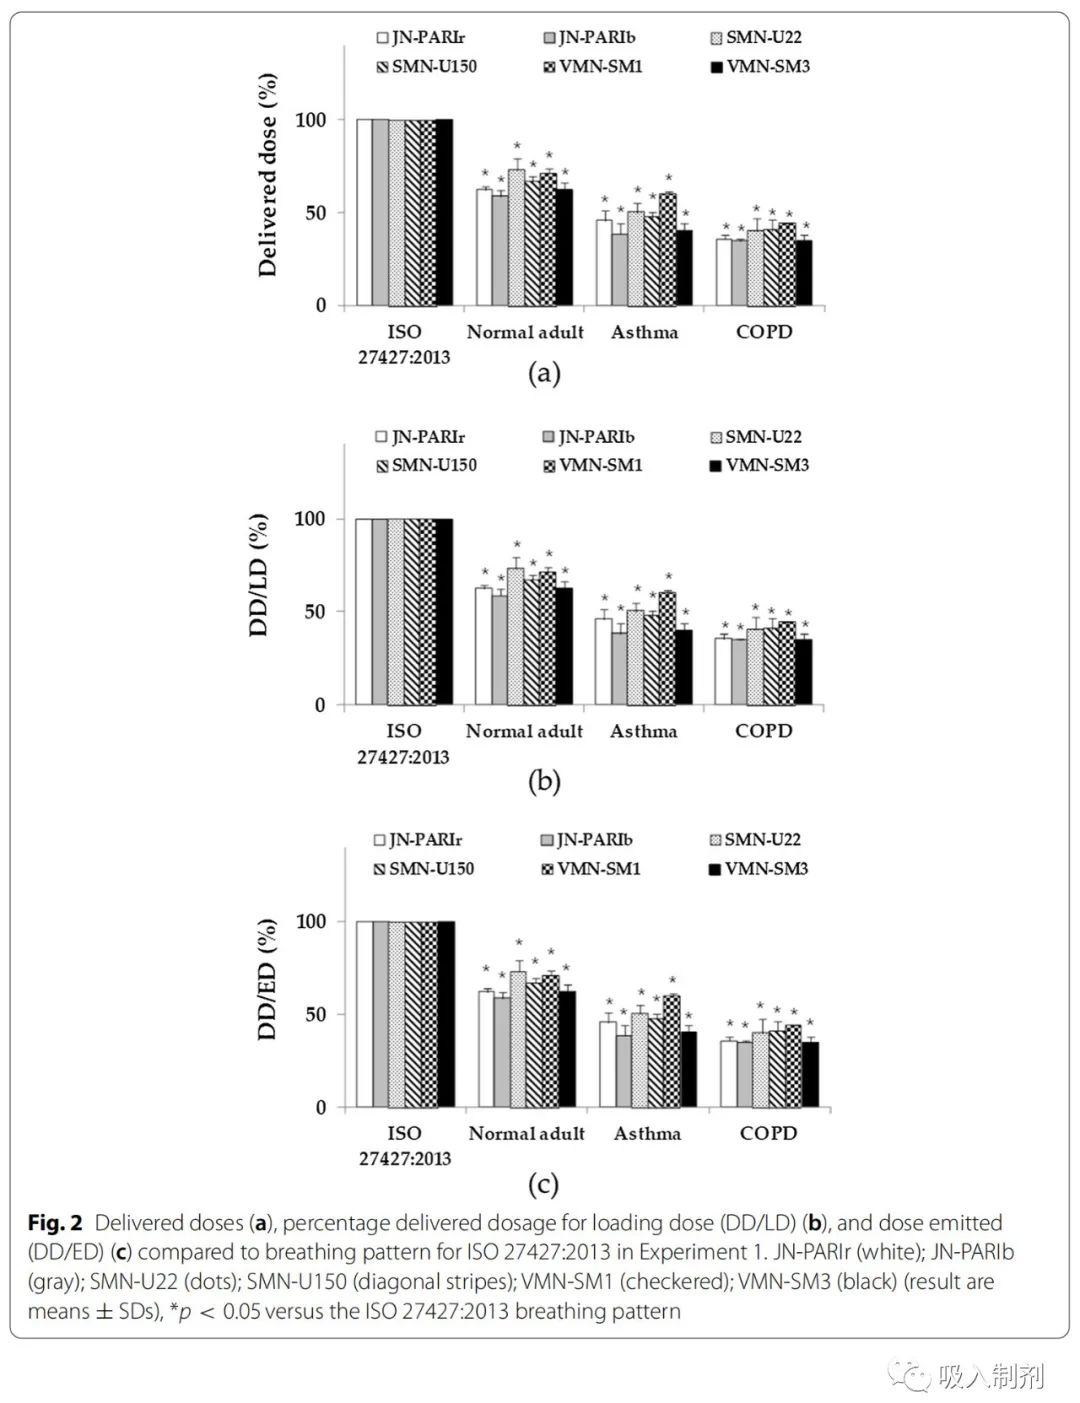
Figure 2 Comparison of delivery doses (a), delivery dose percentage of loaded dose (DD/LD) (b) and delivery dose percentage of jet dose (DD/ED) (c) compared to the ISO 27427:2013 breathing pattern in Experiment 1. JN-PARIr (white); JN-PARIb (gray); SMN-U22 (dots); SMN-U150 (stripes); VMN-SM1 (checkered); VMN-SM3 (black) (results are mean ± SD), *p < 0.05 compared to the ISO 27427:2013 breathing pattern
Discussion
Nebulizers are commonly used at home or in hospitals for treating respiratory diseases. In this study, we developed a breathing simulator that can quantitatively test drug delivery from nebulizers. Six home nebulizers (JN-PARIr, JN-PARIb, SMN-U22, SMN U150, VMN-SM1 and VMN-SM3) were tested using the developed breathing simulator. Other studies have shown that delivery doses are influenced by particle size, breathing patterns, and airway models. Therefore, a breathing simulator capable of generating various stable breathing patterns is needed. The developed breathing simulator generated four breathing patterns, including the patterns mentioned in ISO 27427:2013.
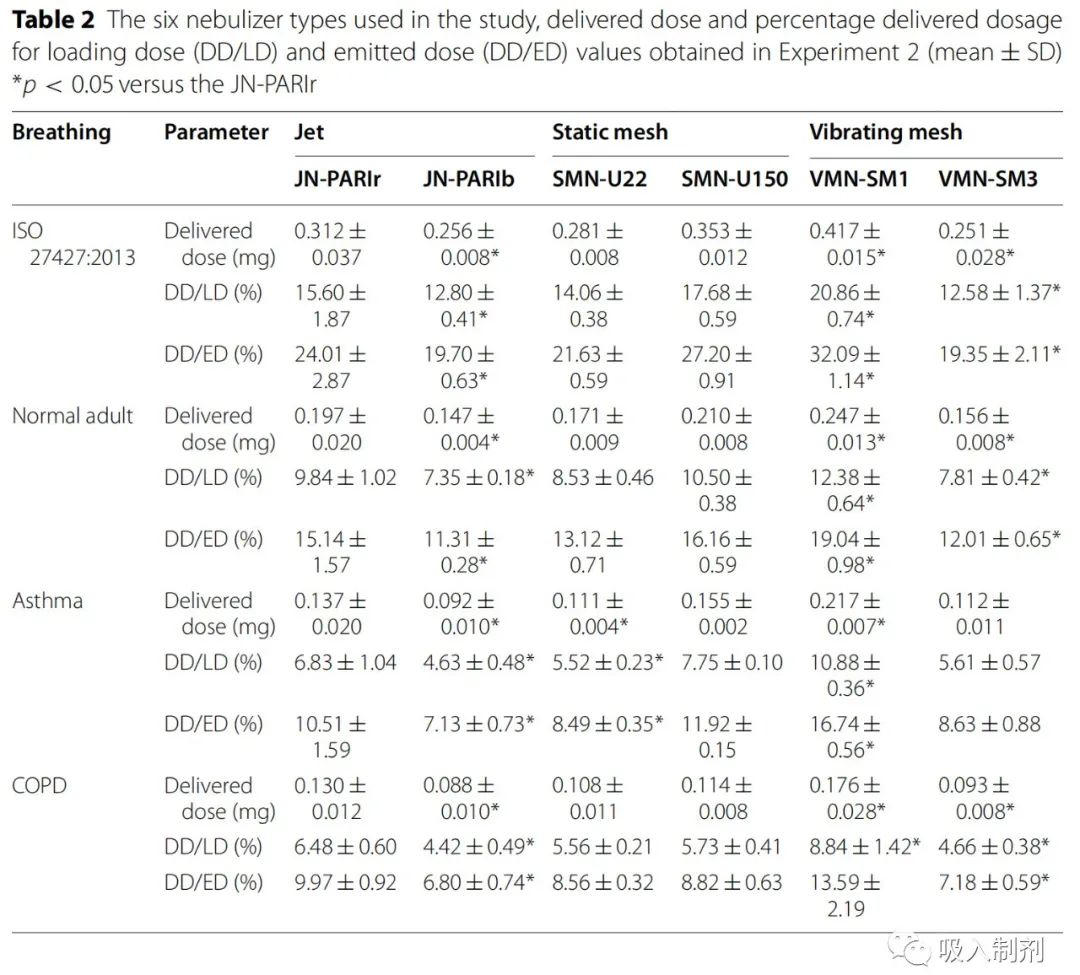
Table 2 Types of nebulizers used in the study, delivery dose (DD/LD) and delivery dose (DD/ED) obtained in Experiment 2 (mean ± SD)*p < 0.05 compared to JN -PARIr
It is difficult to compare the drug delivery efficiency of different types of nebulizers, as there are significant differences in drug delivery among each type of nebulizer. Therefore, we studied the drug delivery efficiency of six nebulizers under two conditions: Experiment 1 (nebulization duration) and Experiment 2 (constant delivery of 1.3 mL). In Experiment 1, jet nebulizers had smaller or similar drug delivery amounts compared to mesh nebulizers (Table 1), which is consistent with previous reports. Notably, it has been reported that even for a single type of nebulizer, the delivery dose depends on particle size, residual volume, and delivery rate. VMN SM1 (vibrating mesh nebulizer) delivered higher doses than other mesh nebulizers. In a previous study, using the ISO 27427:2013 breathing pattern without an airway model, the DD/LD value of the SMN-U22 nebulizer was approximately 41.16% . However, the calculated delivery dose percentage of fine particle fraction (FPF < 5µm) was 15.68% . In this study, based on the amount of medication collected by the filter in the model containing the airway, the DD/LD was approximately 20.8%. The delivery dose may depend on particle size due to the influence of the airway. In this study, we compared drug delivery efficiency using the airway model instead of calculating FPF. In nebulizers with high residual volumes, the differences between DD/LD and DD/ED values are significant, reflecting medication waste. The DD/LD values are applicable for assessing drug usage and considering residual volumes. In Experiment 2, we compared drug delivery efficiency (DD/ED) by setting the delivery of all nebulizers to 1.3 mL . VMN-SM1 had higher delivery doses as its DD/ED value was higher than that of the JN-PARIr nebulizer (Table 2).
In Experiments 1 and 2 , the observed delivery doses depended on the breathing patterns (Figure 2 and Figure 3). In particular, in Experiments 1 and 2 , the delivery doses under disease states were lower than those of the ISO 27427:2013 breathing pattern, which is consistent with previous reports. For the ISO 27427:2013 pattern, the inhalation phase had the longest duration, while the COPD had the shortest, indicating that the delivered dose may depend on the I:E ratio. Furthermore, the delivered amount may depend on tidal volume and respiratory rate. All breathing patterns with longer inhalation phases were associated with higher delivery doses, while longer exhalation phases reduced the delivered dose. The ISO 27427:2013 only defines one breathing pattern, and it has been reported that data obtained using one breathing pattern may lead to inappropriate clinical applications. Our results are consistent with these findings, indicating the need for better testing that simulates patient breathing patterns.
This study used a breathing simulator to determine the in vitro delivery efficiency of nebulizer drugs under conditions representative of actual clinical environments. In practice, breathing patterns are often irregular, which may lead to inconsistent drug delivery. On the other hand, the breathing simulator generates consistent breathing patterns and specific respiratory system diseases. However, we suspect that the dose results we provided may be overestimated since the airway model used did not accurately simulate disease conditions. Additionally, the delivery characteristics may differ between adults and children, depending on the drug characteristics and nebulizer interfaces. Further research is needed to better match breathing patterns with clinically observed conditions, design airway models suitable for respiratory diseases, and determine the effects of different drugs and nebulizer interfaces on drug delivery.
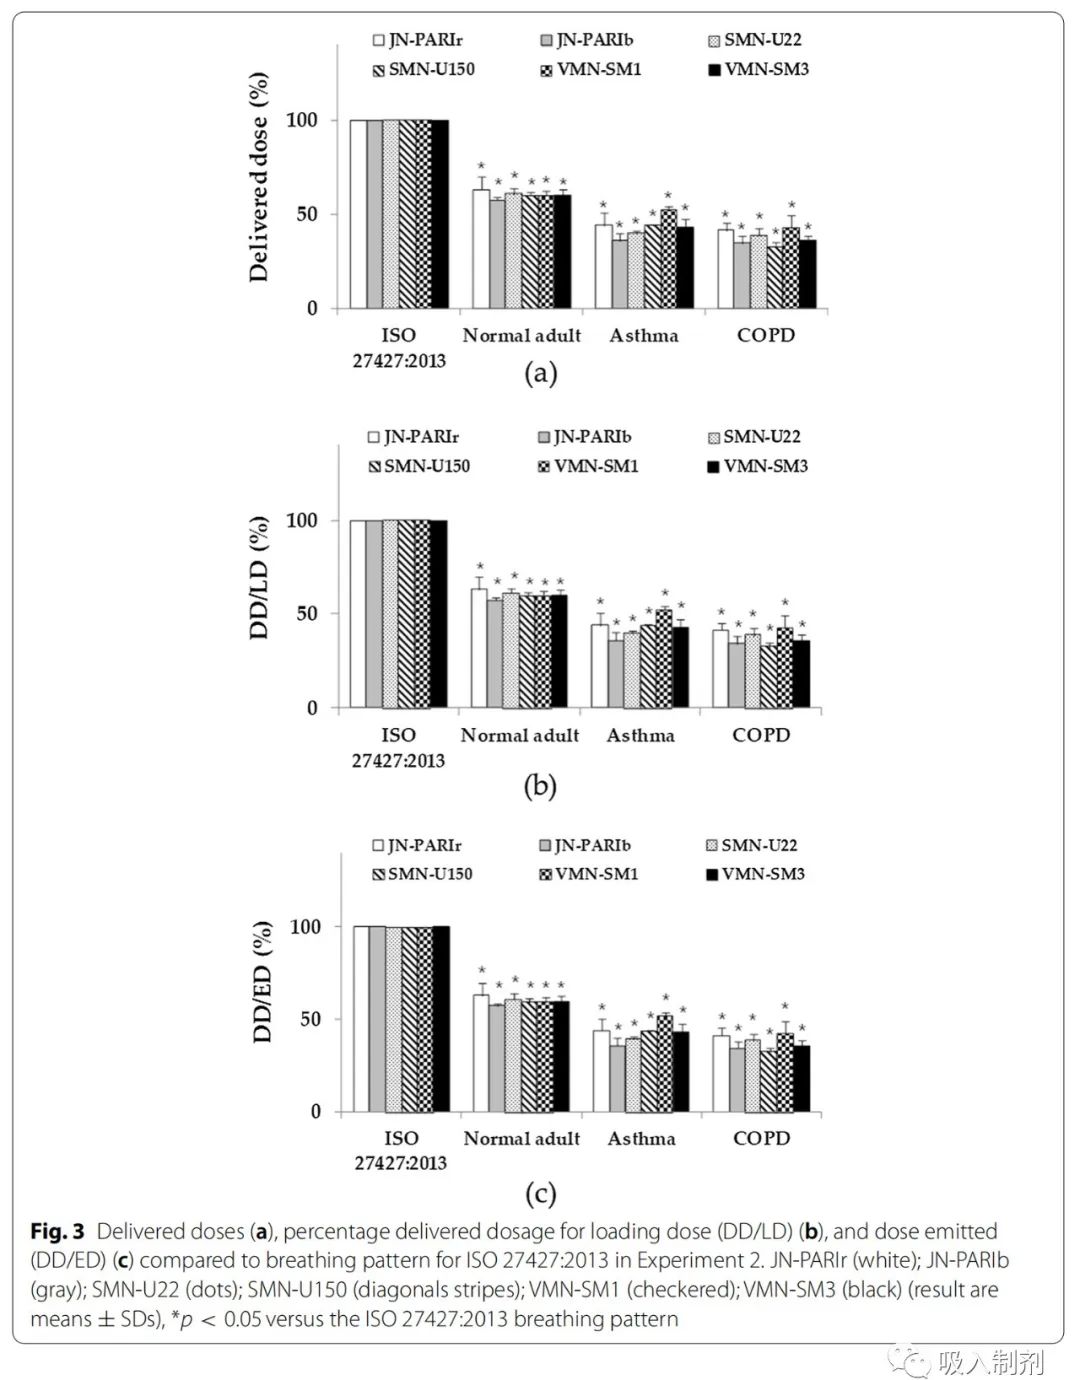
Figure 3 Comparison of delivery doses (a), delivery dose percentage of loaded dose (DD/LD) (b) and delivery dose percentage of jet dose (DD/ED) (c) compared to the ISO 27427:2013 breathing pattern in Experiment 2. JN- PARIr (white); JN-PARIb (gray); SMN-U22 (dots); SMN-U150 (stripes); VMN-SM1 (checkered); VMN-SM3 (black) (results are mean ± SD), *p < 0.05 compared to the ISO 27427:2013 breathing pattern
Conclusion
In the past, it has been difficult to compare the delivery efficiency of nebulizers due to differences in residual volumes and delivery rates. We developed a breathing simulator and compared the delivery efficiency of six home nebulizers using four breathing patterns. In this study, we designed a method to quantitatively determine drug delivery efficiency using defined variables (i.e., DD/LD and DD/ED) for four breathing patterns. Ultimately, our results indicate that delivery rate and breathing pattern should be considered to accurately determine the medication delivery efficiency of nebulizers.
Methods
Development of the Breathing Simulator
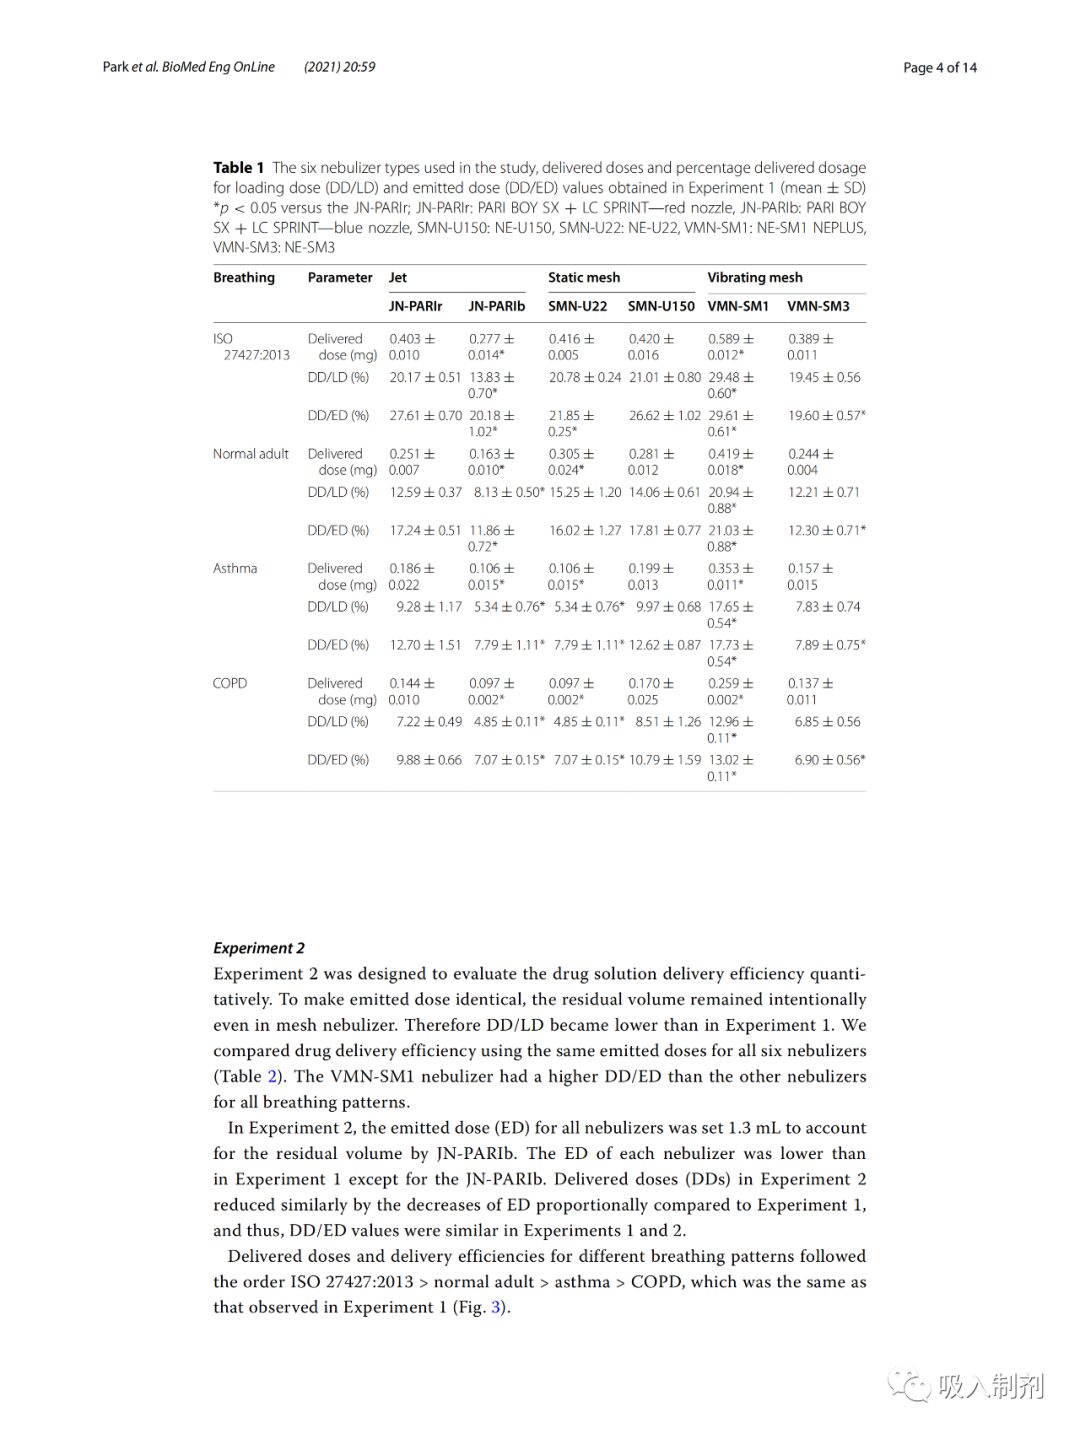
The breathing simulator was driven by a stepper motor (Nema 57 56 Stepper motor, JingJiang Nair Motion Technologies Co., Jingjiang, China), linear actuator (Scipia, Gwangju, Korea), motor driver (TB6600, DFRobot, Shanghai, China), a flow sensor (SMF3000, Sensirion, Stafa, Switzerland), a cylinder (MDB1B50-600, SMC Co., Tokyo, Japan), and an oral-pharyngeal airway model. The airway model was based on the airway dimensions of the oral and tracheobronchial airways from Cheng et al. and was fabricated using a 3D printer (ProJet 3510HD, 3D Systems, South Carolina, Colorado, USA) and UV-cured resin (VisiJet M3, Crystal, 3D Systems, South Carolina, Colorado, USA). A disposable filter (Proguard-EX, GMS Korea, Bucheon, Korea) was located between the oral-pharyngeal airway model and the airflow sensor. For breathing pattern control and flow data acquisition (DAQ), we used the open-source platform Arduino Uno (Arduino.cc, Ivrea, Italy). Figure 4 provides a schematic diagram of the breathing simulator.
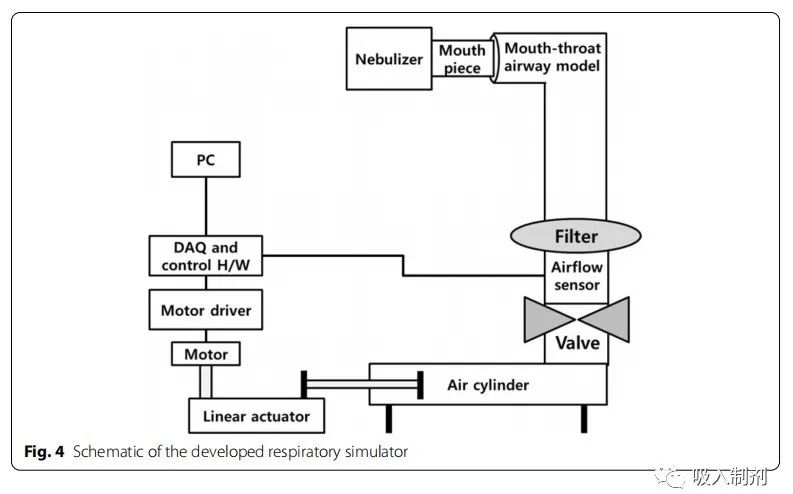
Figure 4 Schematic diagram of the developed breathing simulator
Calibration of the Breathing Simulator
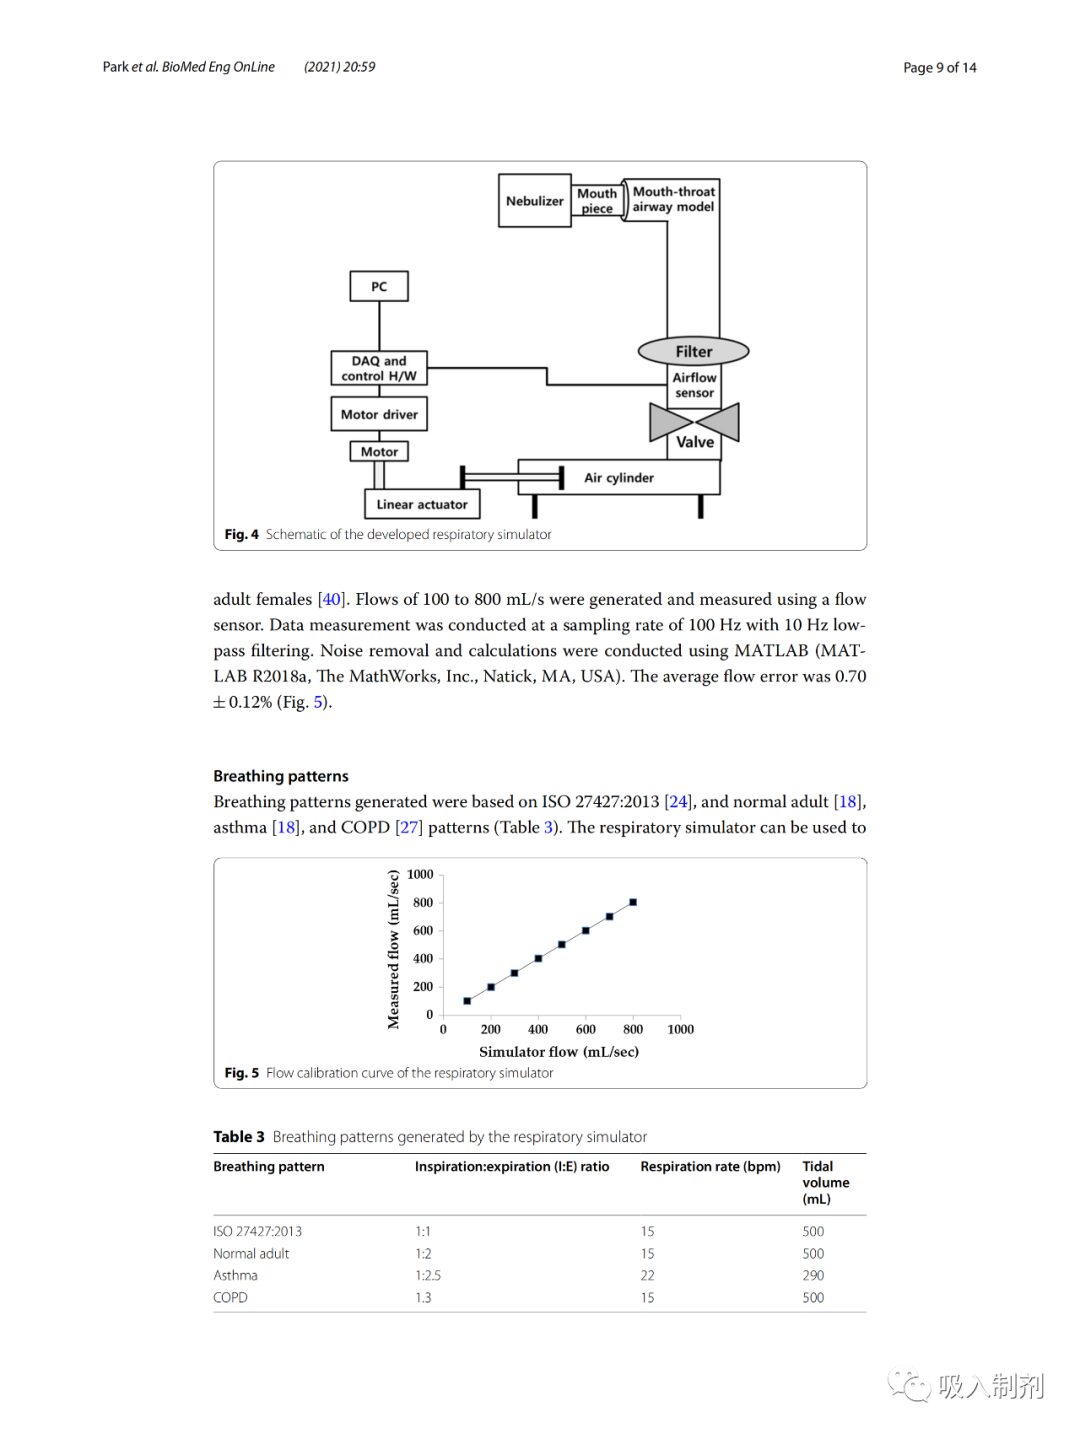
Initially, the amount of air produced by the simulator was calibrated from 100 mL to 800 mL at 100 mL intervals. The tidal volume for healthy adult males is approximately 500 mL, while for adult females it is approximately 400 mL. Flow rates of 100 to 800 mL/s were generated and measured using a flow sensor. Data measurements were taken at a sampling rate of 100 Hz and low-pass filtered at 10 Hz. Noise removal and calculations were performed using MATLAB (MATLAB R2018a, The MathWorks, Inc., Natick, MA, USA). The average flow error was 0.70 ± 0.12% (Figure 5).
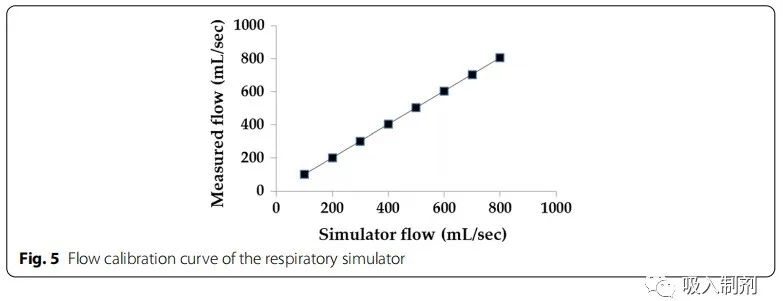
Figure 5 Flow calibration curve of the breathing simulator
Breathing Patterns
The generated breathing patterns were based on ISO 27427:2013 [24], normal adult, asthma, and COPD patterns (Table 3). The breathing simulator can reproduce breathing patterns beyond those mentioned in Table 3. The drug delivery was compared among the four breathing patterns.
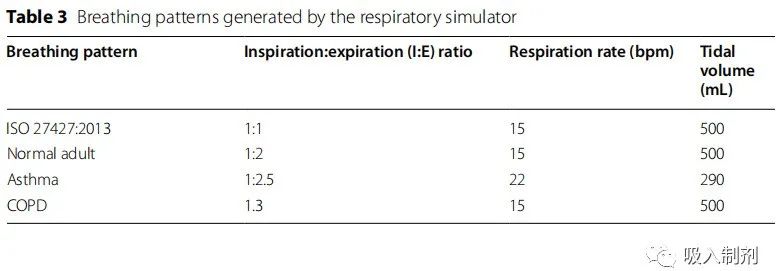
Table 3 Breathing patterns generated by the breathing simulator
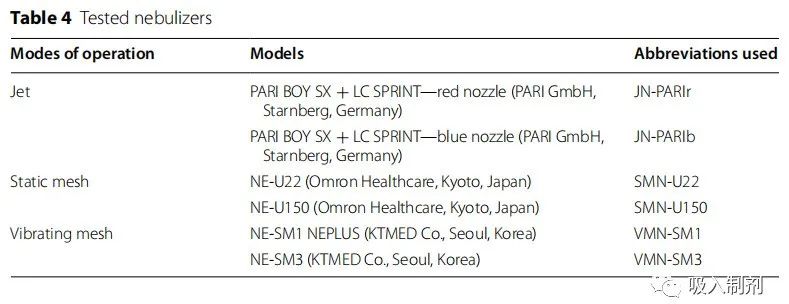
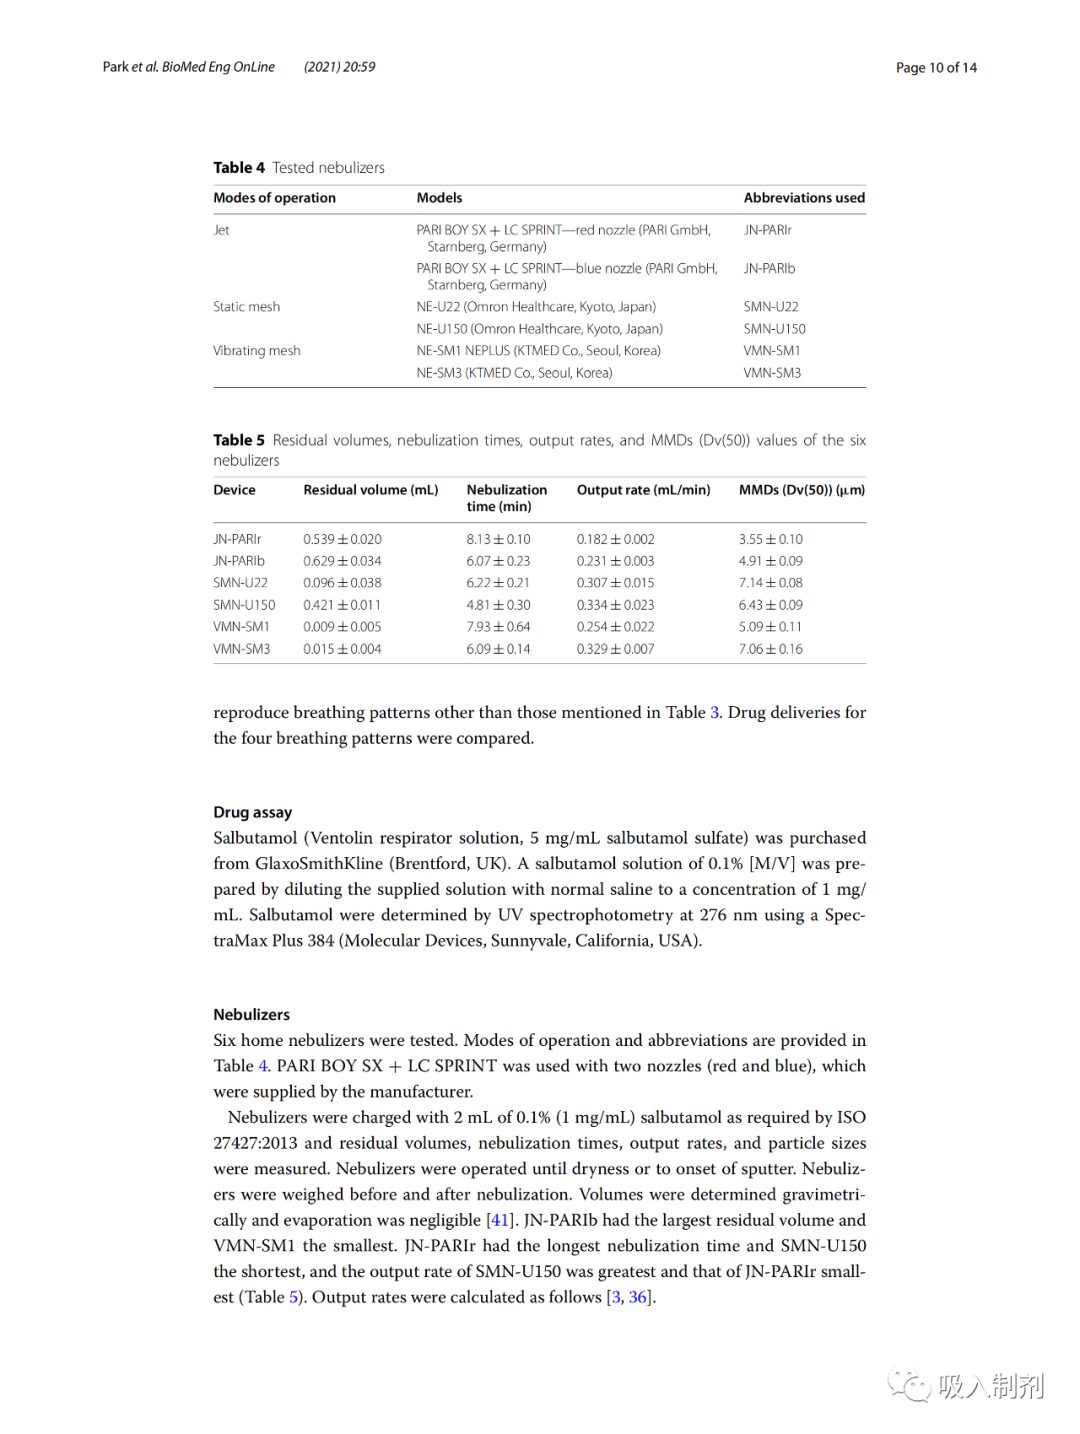
Table 4 Experimental nebulizers
Drug Assay
Albuterol (Ventolin nebulization solution, 5 mg/mL albuterol sulfate) was purchased from Glaxo Smith Kline (Brentford, UK). The supplied solution was diluted to a concentration of 1mg/mL by using normal saline to prepare a 0.1%[M/V] albuterol solution. Albuterol was measured at 276 nm using ultraviolet spectrophotometry with a SpectraMax Plus 384 (Molecular Devices, Sunnyvale, California, USA).
Nebulizers
Six home nebulizers were tested. Operating modes and abbreviations are provided in Table 4 . PARI BOY SX + LC SPRINT was used with two nozzles provided by the manufacturer (red and blue). The nebulizer was filled with 2 mL of 0.1% (1 mg/mL) albuterol in accordance with the requirements of ISO 27427:2013 and measured for residual volume, nebulization time, delivery rate, and particle size. The nebulizer was operated until dryness or splattering began. The nebulizer was weighed before and after nebulization. The volume was determined by weight, with evaporation being negligible. JN-PARIb had the highest residual volume, while VMN-SM1 had the lowest. JN-PARIr had the longest nebulization time, while SMN-U150 had the shortest, and the delivery rate was highest for SMN-U150 and lowest for JN-PARIr (Table 5).
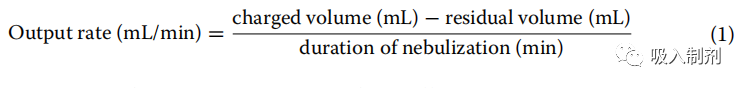
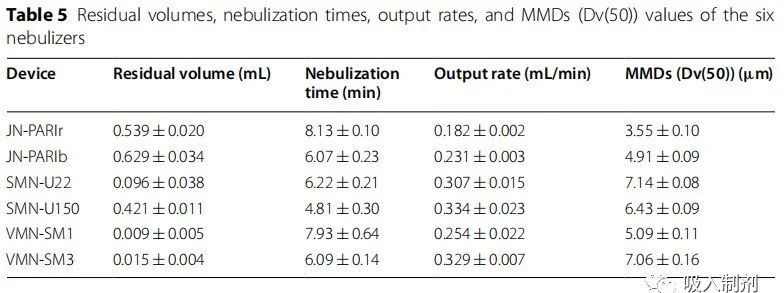
Table 5 Residual volume, nebulization time, output rate, and MMD (Dv(50)) values of six nebulizers
Particle size (mass median diameter (MMD)) was measured using Spraytec (Malvern Instruments, Malvern, UK) using laser diffraction. The Spraytec software (model #STP5311, version 3.1, Malvern Instruments, Malvern, UK, 2009) automatically calculated the 50% volume diameter (Dv(50)) results. SMN-U22 had the largest particle size, while JN-PARIr had the smallest. The results are shown in Table 5 .
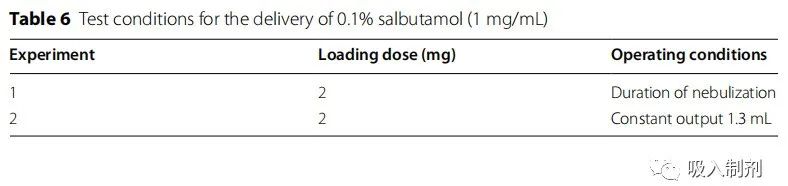
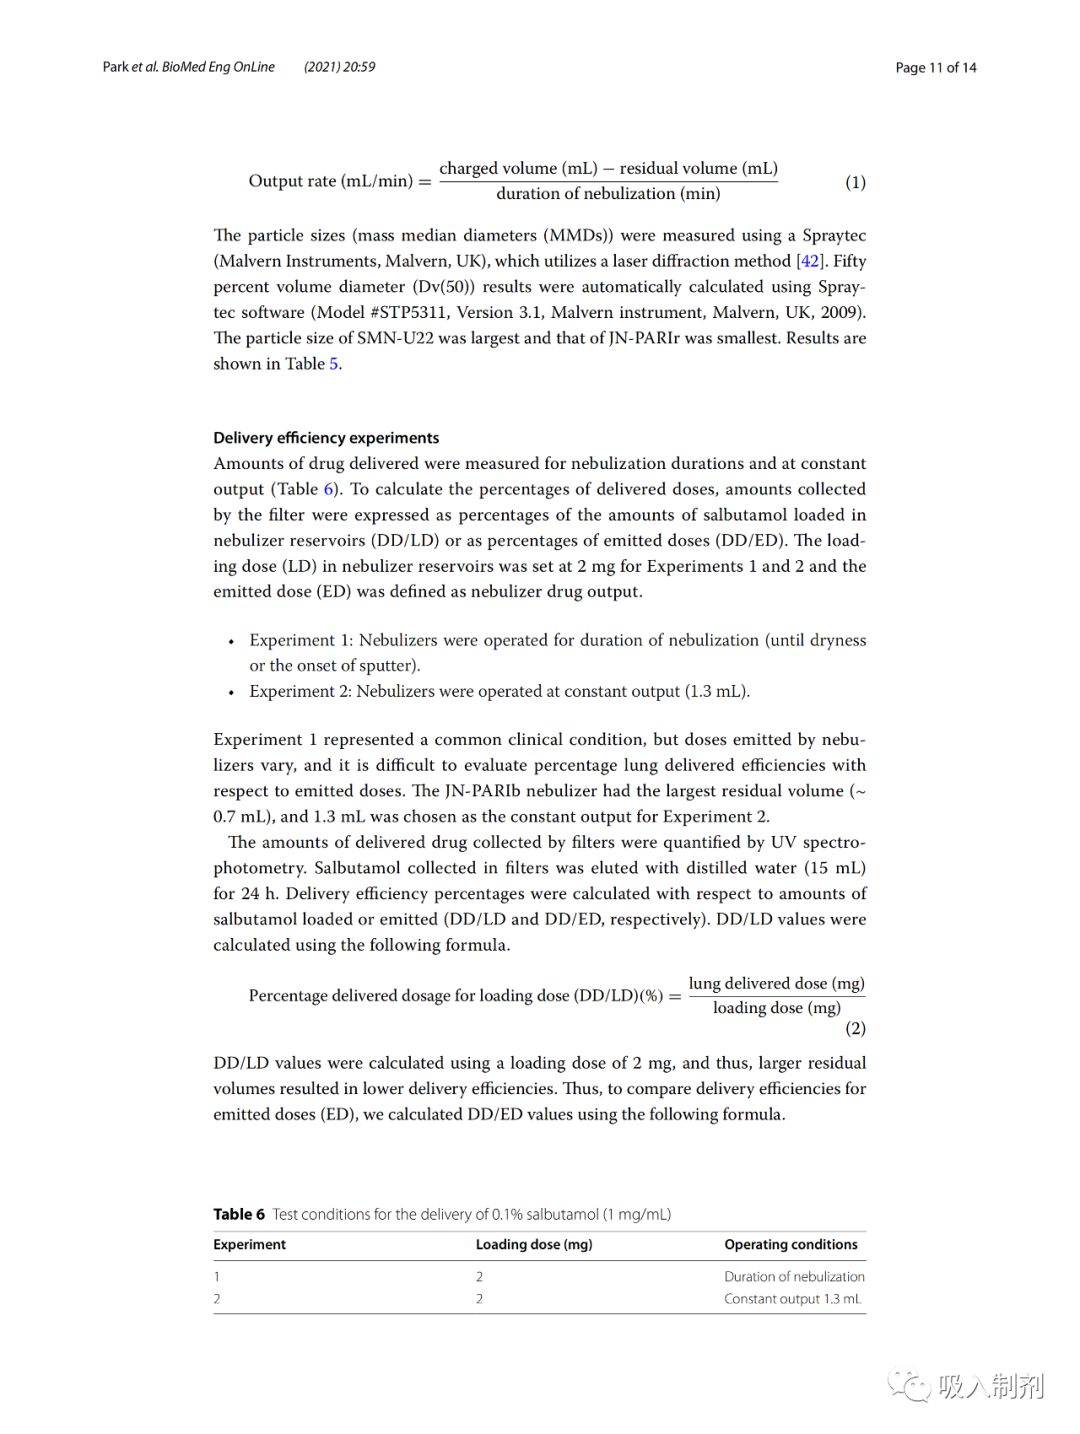
Delivery Efficiency Experiments
Delivery amounts of the drug were measured under nebulization duration and constant delivery (Table 6). To calculate the percentage of delivery doses, the amount collected by the filter is expressed as a percentage of the amount of albuterol loaded in the nebulizer tank (DD/LD) or the percentage of the jet dose (DD/ED). For Experiments 1 and 2, the loading dose (LD) in the nebulizer container was set to 2 mg, and the jet dose (ED) was defined as the medication delivered by the nebulizer.
• Experiment 1: The nebulizer was operated during nebulization (until dryness or splattering began).
• Experiment 2: The nebulizer was operated under constant delivery (1.3 mL) .
Experiment 1 represents a common clinical situation, but the doses delivered by the nebulizer vary, making it difficult to assess the percentage of lung delivery efficiency relative to the jet dose. JN-PARIb had the highest residual volume (~ 0.7 mL), while Experiment 2 selected 1.3 mL as the constant delivery.
The amount of drug delivered collected by the filter was quantified using ultraviolet spectrophotometry. The collected albuterol from the filter was eluted with distilled water (15 mL) for 24 hours. The delivery efficiency percentage is calculated based on the loaded or jet albuterol amount (DD/LD and DD/ED, respectively). The DD/LD value is calculated using the following formula.
The DD/LD value is calculated using a loading dose of 2 mg, therefore, larger residual volumes lead to lower delivery efficiencies. Thus, to compare the delivery efficiency of the jet dose (ED), we calculated the DD/ED value using the following formula.
To compare the drug delivery efficiency of nebulizers under each breathing pattern, the delivery dose percentage of the jet dose was compared to the data obtained according to the ISO 27427:2013 breathing pattern.
Statistical Analysis
Spearman’s correlation coefficient was used to assess the correlation between simulated and measured breathing flows. Lung delivery doses are expressed as means and standard deviations. Data were analyzed using two-way ANOVA and Dunnett’s post hoc test. The analysis was performed using R-studio version 4.0.3 (R-studio, MA, USA, 2020), with p values < 0.05 considered significant.
Disclaimer
The articles published by this public account are for promoting communication and learning among peers in inhalation preparations; they are not for any commercial use. We respect original works. The selected articles are clearly marked with sources and authors, and the copyright belongs to the original authors. If there are any infringement or other issues, please contact us for deletion.
Content is selected by the inhalation preparation editor from the literature. If reproduced, please respect the labor results and indicate the source from Inhalation Preparations public account.
The content of the article represents the author’s views and does not represent the position of this public account.