
As developers, we sometimes get stuck on certain issues, causing us to spend more time in the debugger than writing code. For this reason, we recently took the opportunity to learn some tips from the Android Studio team on how to enhance debugging speed. Next, we will present to you what we believe are the best tips that can save you time and integrate easily into your debugging process.
Filtering and Collapsing Logs
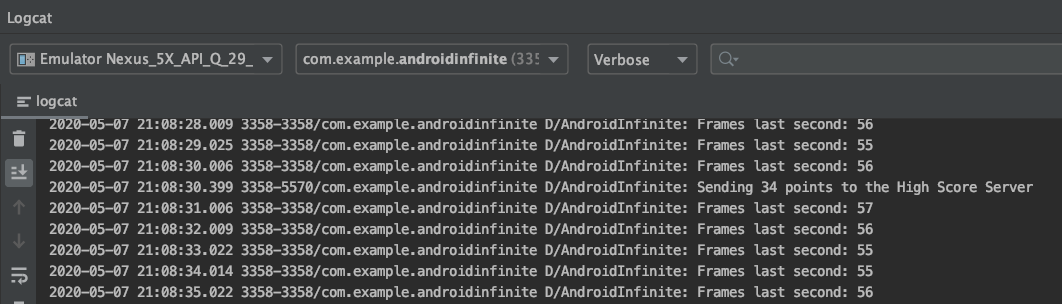
We start with a classic debugging method—a small trick involving printf statements. Suppose there is a game that prints its frame rate and the player’s final score in the logs; the game will output the following in the Logcat window:
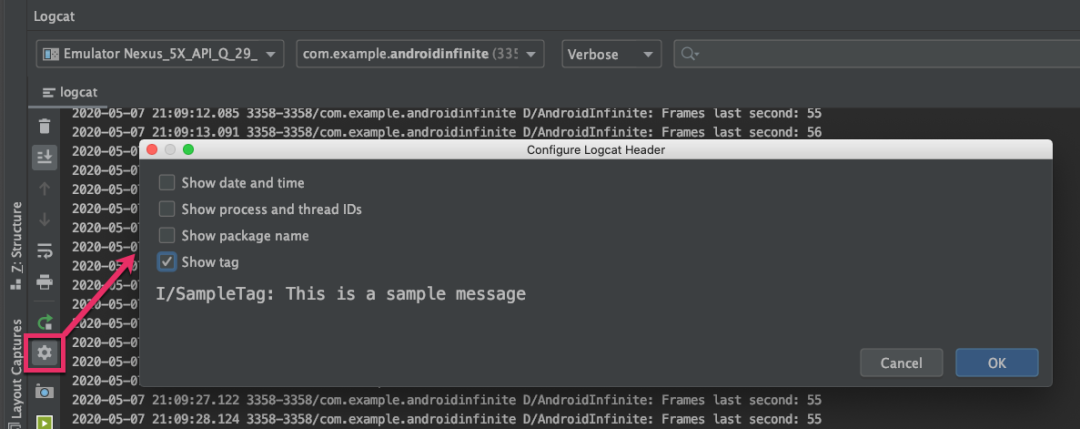
The output information here may contain many details you are not concerned about, such as date and thread ID. You can easily adjust the displayed content by clicking the settings icon in the Logcat toolbar, which will pop up a Configure Logcat Header window where you can deselect the information you don’t want to see:
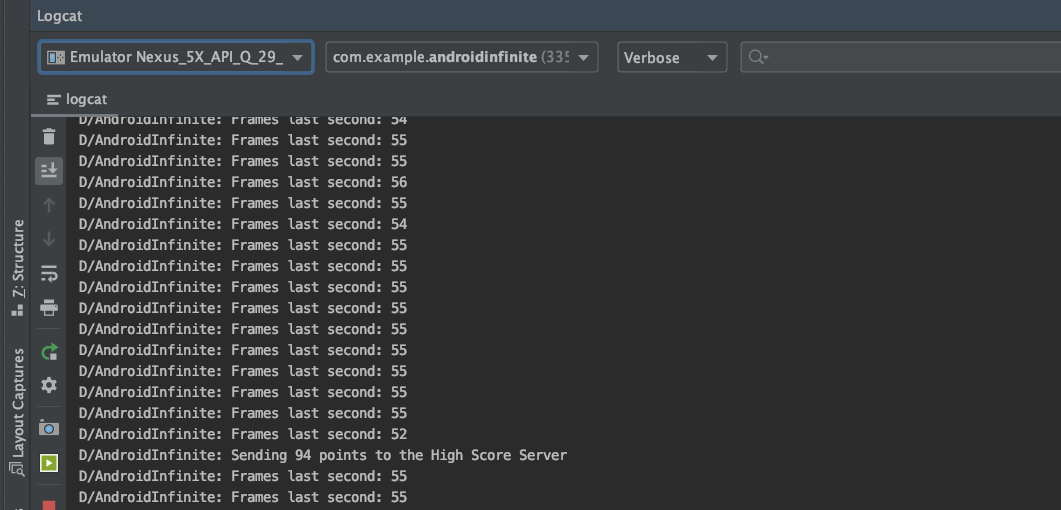
This way, you will get a more concise and relevant log output, as shown below:
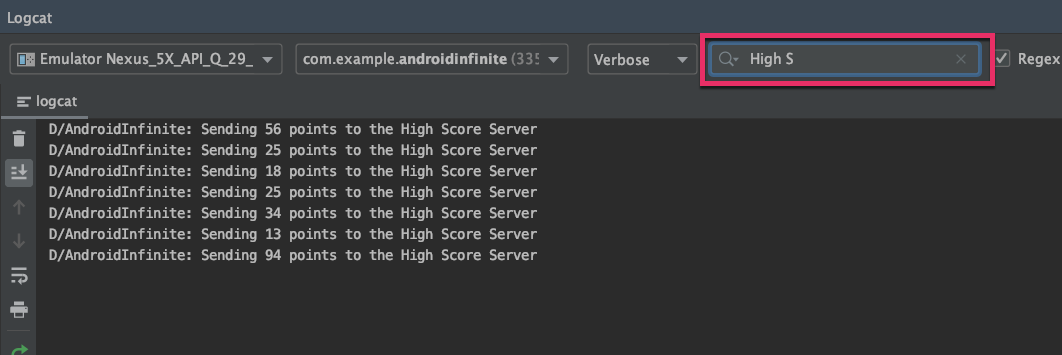
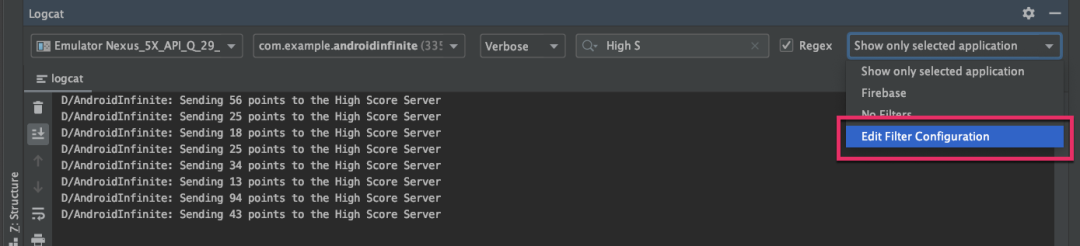
However, there are still many confusing details that hinder our focus on High Score information. You can use the search function to solve this issue by entering a part of the debugging information in the search field to filter the Logcat window:
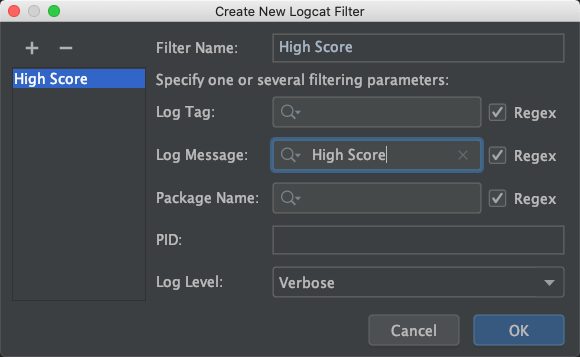
Common search criteria you often use can be added to custom filters through Edit Filter Configuration:
Below are the details for adding filters:
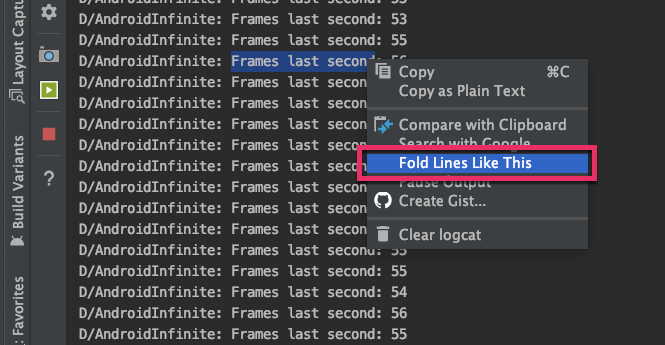
Another way to reduce clutter in logs is to use the collapse feature, which can group similar logs together. You just need to select part of the text in a log, right-click, and choose Fold Lines Like This:
When the Console dialog appears, click OK, and the logs containing the selected text will be organized together:
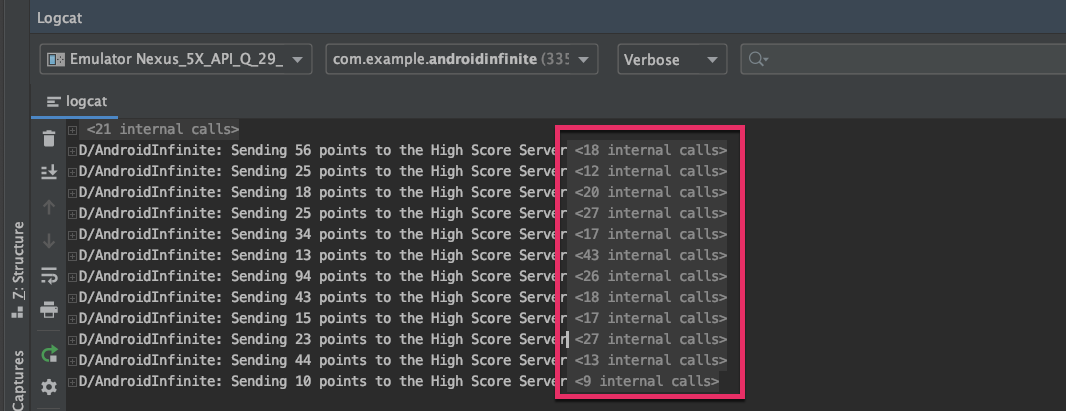
If you later need to view the collapsed information, you can click on a line to expand the content. There is also a button provided for you to expand or collapse the folded lines conveniently.
Attach Debugger to Current Process
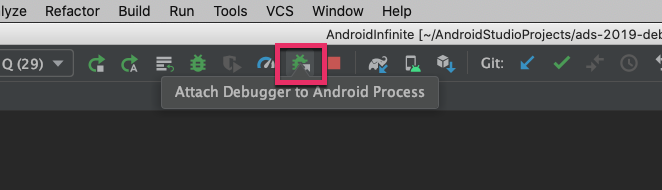
In the Choose Process pop-up, select the process you want to attach the debugger to and click OK. Next, just like in a normal debugging session, the debugger will start hitting your breakpoints.
Move Breakpoints
Conditional Breakpoints
You may need to find bugs related to specific types of events in your application or game. For example, in a game under development, you might want to stop running when the player’s character collides with an object and exhausts their last health point. You add a breakpoint on the collision event, but this will cause the run to stop every time a collision occurs. To avoid this, you can use conditional breakpoints.
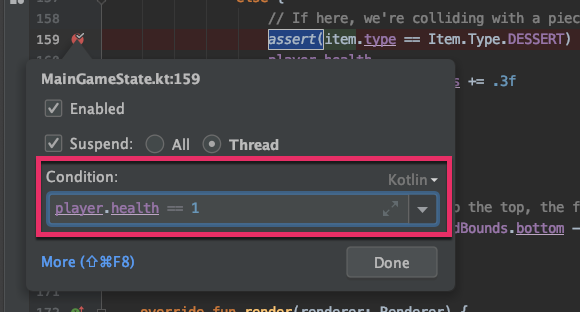
To set a conditional breakpoint, you need to right-click on a breakpoint and add a condition for it. The condition can be any code expression that results in a Boolean value. When the code runs to this line, if the expression evaluates to True, the breakpoint will be triggered.
Here, based on the logic when the player collides with an object, set a condition of player.health == 1 to capture the last collision event before the player’s health drops to 0.
Dependent Breakpoints
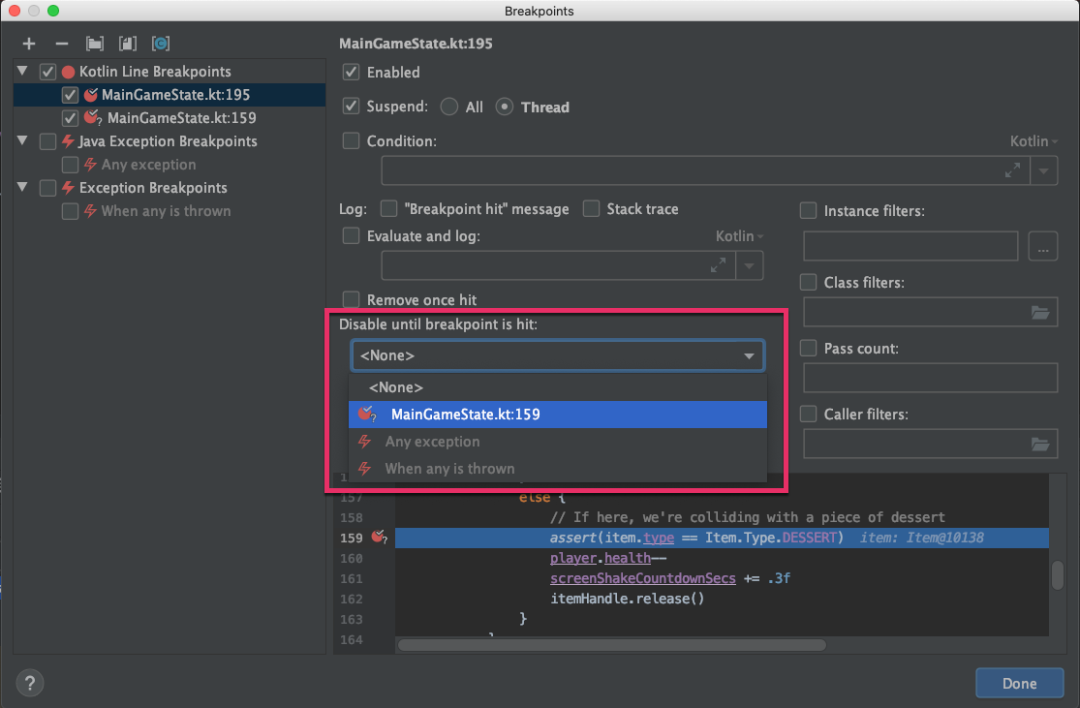
A piece of code can be triggered by different paths, which is not uncommon in application development. If you discover a bug that only triggers on a specific path, randomly placing a breakpoint will cause many meaningless interruptions during runtime. To address this, you can use dependent breakpoints. Dependent breakpoints will only activate after a specific breakpoint is triggered. For instance, you can create a breakpoint that will only be triggered on the path you are interested in, and other breakpoints can depend on this breakpoint, so those breakpoints will also only be triggered on the path you care about.
To set a dependent breakpoint, you need to right-click on the second breakpoint in the path and open the More menu. In the Disable until breakpoint is hit checkbox, select the breakpoint you want to depend on:
You will notice that the icon of the breakpoint changes:

Now, your application will only stop at this breakpoint after the previous breakpoint is triggered.
This feature can also be used in other places that use conditional breakpoints, thus avoiding the need to copy and paste conditional breakpoints to new locations.
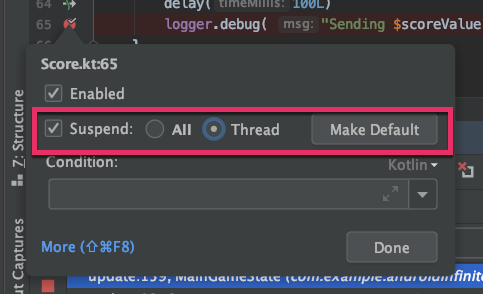
Suspend Threads
If you are debugging a multithreaded application, you will notice that by default, breakpoints will suspend all threads, but sometimes you may not want it to do so. For example, you may want to verify whether other functionalities of the application can work properly while a background thread is blocked, or you want to understand whether the UI can continue rendering while executing a background task.
Evaluate and Log
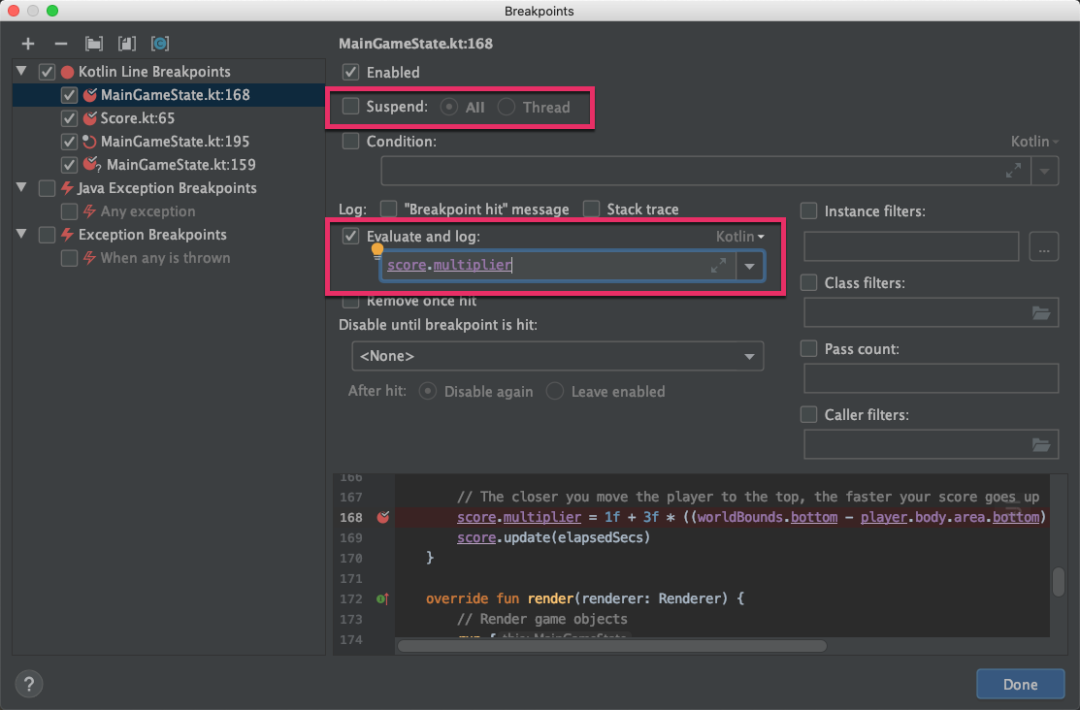
Now, you can add any code expression in the input box, and the corresponding content will be evaluated and logged to the console.
If you just want to quickly verify whether the breakpoint is hit and do not care about the details, you can use the “Breakpoint hit” message to log the triggering of the breakpoint. You can even use Shift + click to make this operation quicker.
Disable Breakpoints
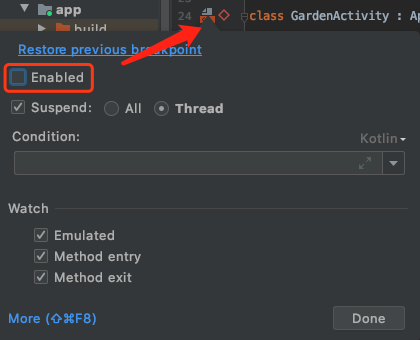
To disable a breakpoint (not delete it), you can right-click on the breakpoint and uncheck the Enabled checkbox from the pop-up. You can also quickly disable a breakpoint by holding Alt (Option on Mac) and clicking the breakpoint.
Breakpoint Groups
You must have encountered a scenario where you are solving a bug and have added several breakpoints, but find yourself at a loss, so you go off to solve another bug. However, soon you start hitting breakpoints added to resolve the first bug. Triggering unrelated breakpoints can be confusing and can take you away from your debugging process.
You can use breakpoint groups to make the development process more comfortable.
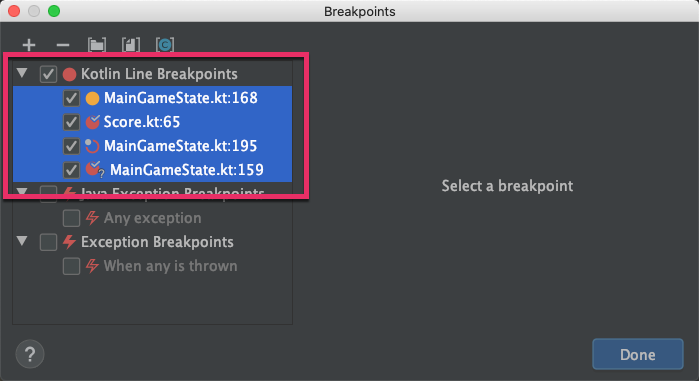
When your program hits the first breakpoint that is unrelated to the current debugging process, right-click and open the More menu. You will see a list of all breakpoints; you can check all breakpoints related to the first bug here:
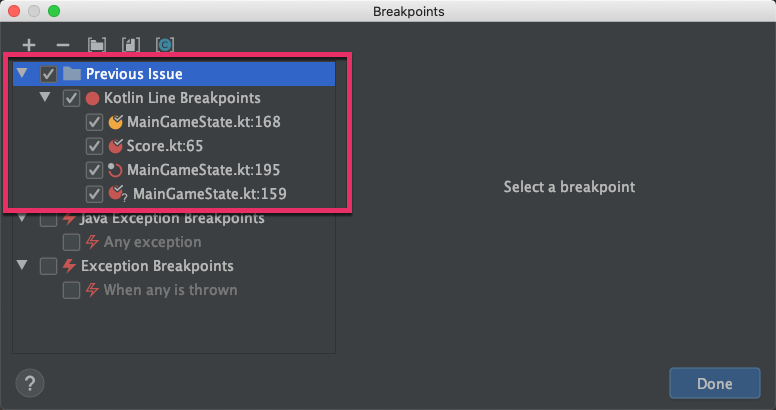
Right-click the selected breakpoints and choose Move to group, then Create new and name the new group, for example, after the bug you are currently dealing with. Now you can easily enable and disable all breakpoints just by clicking.
Of course, you can also use the grouping feature to delete all related breakpoints after you have resolved the bug.
You can check out the following video for more details and demonstrations related to this article:
-
Tencent Video Link
https://v.qq.com/x/page/o3030ha9b5e.html
-
Bilibili Video Link
https://www.bilibili.com/video/av78114615/
-
Android Developer Official Documentation | Debugging Prebuilt APKs
https://developer.android.google.cn/studio/debug/apk-debugger
-
Control Data Display in the Debugger via Data Browsing
https://www.jetbrains.com/help/idea/debugger-data-type-renderers.html
-
How to Use and Understand the Overhead Tab
https://www.jetbrains.com/help/idea/monitor-debugger-overhead.html
-
Android Developer Official Documentation | Android Studio – Debugging Your Applications
https://developer.android.google.cn/studio/debug
-
IntelliJ IDEA Debugging Code
https://www.jetbrains.com/help/idea/debugging-code.html
—END—

It’s not easy to write articles, please support with a “Seen” 👍