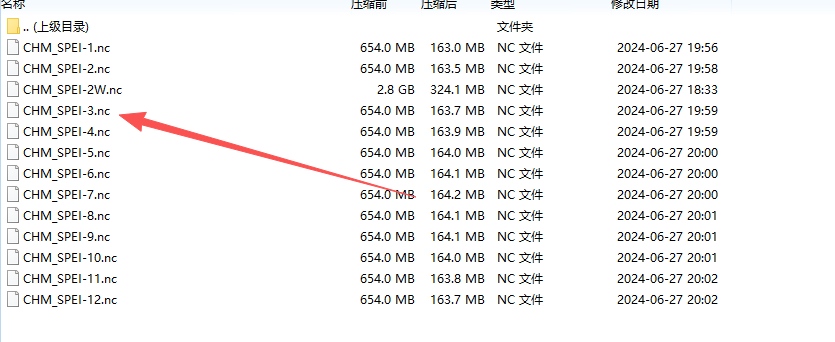
A new high-resolution multi-drought index dataset for mainland China, CHM_Drought. This dataset integrates high-density meteorological station data to construct a complete framework (China Hydrological Meteorological Dataset, CHM) based on fundamental meteorological elements.Website:https://figshare.com/articles/dataset/CHM_Drought/25656951/2CHM_Drought is a comprehensive long-term meteorological drought dataset for mainland China from 1961 to 2022, with a spatial resolution of 0.1°. It includes six key meteorological drought indices: Standardized Precipitation Index (SPI), Standardized Precipitation Evapotranspiration Index (SPEI), Evaporative Demand Drought Index (EDDI), Palmer Drought Severity Index (PDSI), Self-calibrated Palmer Drought Severity Index (SC-PDSI), and Vapor Pressure Deficit (VPD). Among these, SPI, SPEI, and EDDI contain multi-scale features for 2 weeks and 1-12 months. The dataset can be downloaded directly from the website. This article processes the SPEI-3 as an example.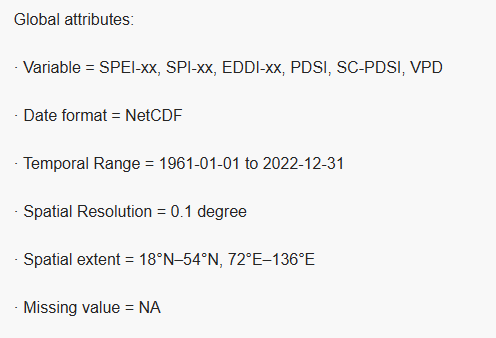 The original data is stored in NC format, with each band representing data from different times. To facilitate usage, it needs to be converted to Tif format. The suffix “1–12” in the indicator names of the CHM_Drought dataset indicates:1–12: Represents a time window in months. For example:SPEI-1 = Standardized Precipitation Evapotranspiration Index accumulated over the past month (reflecting short-term drought).SPEI-3 = Index accumulated over the past three months (reflecting seasonal drought, such as agricultural drought).SPEI-12 = Index accumulated over the past twelve months (reflecting long-term hydrological drought or annual drought trends).Applicable indices: SPI, SPEI, EDDI (these three types of indices support multiple time scales).
 The code processes SPEI-3 (this issue takes the spring SPEI as an example, so it only needs to extract the SPEI for March to May of each year, which is the SPEI for May of each year).
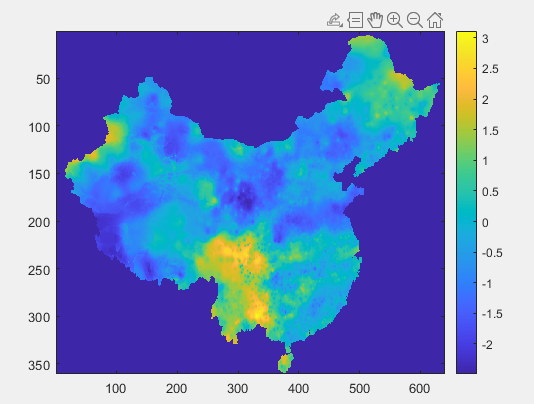 The code is as follows:
clc;clear;ncfile = 'D:\Thesis\paper1\data\SPEI\CHM_SPEI-3.nc';maskname = 'D:\Thesis\paper1\data\SPEI\1961_01.tif';info_nc = ncinfo(ncfile);time = ncread(ncfile,'time'); % Read time variabletime_units = ncreadatt(ncfile,'time','units'); % Get time units, e.g., 'days since 1961-01-01'[A,R] = geotiffread(maskname);info = geotiffinfo(maskname);% Assuming time unit is 'days since 1961-01-01'time_ref_str = extractAfter(time_units,'since ');time_ref = datetime(time_ref_str,'InputFormat','yyyy-MM-dd');time_datetime = time_ref + days(time);years = year(time_datetime);months = month(time_datetime);idx = find(years>=2001 && years<=2022 && months==5);data = ncread(ncfile,'SPEI-3'); % Read data for a specific monthdata = double(data); % Convert to doubleoutpath = 'D:\Thesis\paper1\data\spei5'; % No trailing backslashfor i = 1:length(idx) t = idx(i); data1 = data(:,:,t); data1 = rot90(data1); fname_tif = sprintf('%04d_%02d.tif', year(time_datetime(t)), month(time_datetime(t))); fname_full = fullfile(outpath, fname_tif); geotiffwrite(fname_full, data1, R, 'GeoKeyDirectoryTag', info.GeoTIFFTags.GeoKeyDirectoryTag);end