Processing the SPEI Monthly Scale Dataset of CHM_Drought with MATLAB
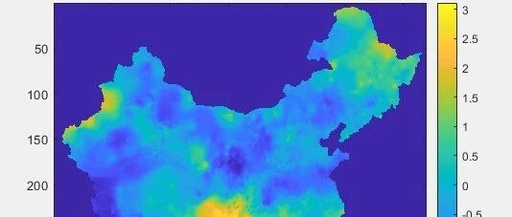
A new high-resolution multi-drought index dataset for mainland China, CHM_Drought. This dataset integrates high-density meteorological station data to construct a complete framework (China Hydrological Meteorological Dataset, CHM) based on fundamental meteorological elements.Website:https://figshare.com/articles/dataset/CHM_Drought/25656951/2CHM_Drought is a comprehensive long-term meteorological drought dataset for mainland China from 1961 to 2022, with a spatial resolution of 0.1°. It includes six … Read more