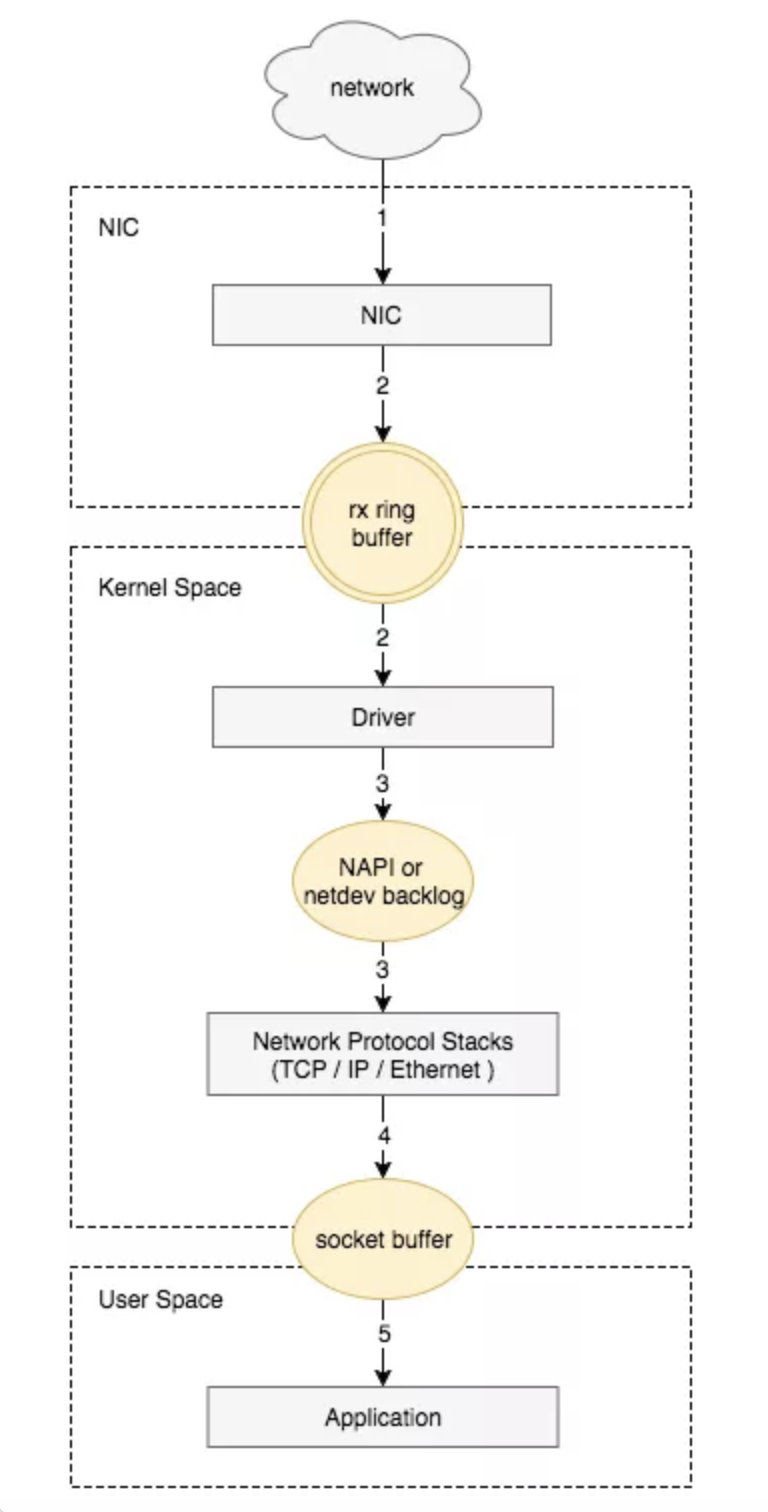
The packet reception process of the Linux network card is as follows:
-
The network card receives the data packet.
-
The data packet is moved from the network card hardware buffer to the server memory (using DMA, without going through the CPU).
-
A hardware interrupt notifies the CPU to process it.
-
The CPU notifies the kernel to process it via a software interrupt.
-
Processed through the TCP/IP protocol stack.
-
The application reads data from the socket buffer using read().
Packet Loss in Network Cards Let’s first look at the output of ifconfig:
# ifconfig eth0eth0: flags=4163<UP,BROADCAST,RUNNING,MULTICAST>  mtu 1500
        inet 10.5.224.27  netmask 255.255.255.0 broadcast 10.5.224.255
        inet6 fe80::5054:ff:fea4:44ae  prefixlen 64 scopeid 0x20<link>
        ether 52:54:00:a4:44:ae  txqueuelen 1000  (Ethernet)
        RX packets 9525661556 bytes 10963926751740 (9.9 TiB)
        RX errors 0  dropped 0  overruns 0  frame 0
        TX packets 8801210220 bytes 12331600148587 (11.2 TiB)
        TX errors 0  dropped 0 overruns 0  carrier 0  collisions 0
Log into the system’s lower level to check if there is a continuous increase in error packets for the management network card, using the command:
# watch -n 1 "ifconfig eth0"
# watch -n 1 ip -s link show eth0
Explanation: watch can output the command's results to the standard output device, often used for periodic command execution/timed execution, -n or --interval specifies the interval time, default runs the program every 2 seconds; eth1 is the name of the network card.-
Normal
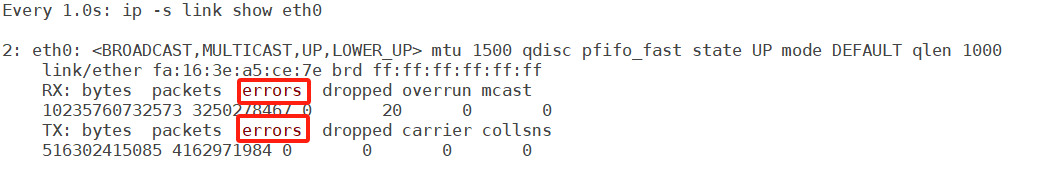
-
Abnormal
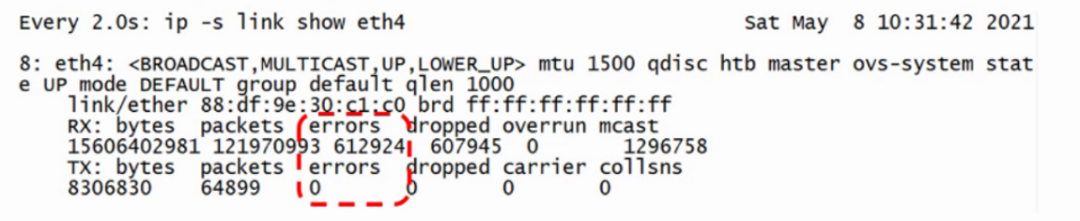
RX (receive) represents received packets, TX (transmit) represents sent packets.
-
RX errors: Indicates the total number of errors in received packets, including too-long-frames errors, Ring Buffer overflow errors, CRC check errors, frame synchronization errors, FIFO overruns, and missed packets, etc.
-
RX dropped: Indicates that the packet has entered the Ring Buffer, but due to insufficient memory or other system reasons, it was dropped during the copying process to memory.
-
RX overruns: Indicates FIFO overruns, caused by the IO transmitted by the Ring Buffer (aka Driver Queue) being greater than the IO that the kernel can handle, and the Ring Buffer refers to the buffer before initiating the IRQ request. Clearly, an increase in overruns means that packets are being dropped by the physical layer of the network card before reaching the Ring Buffer, and one reason for the Ring Buffer being full is that the CPU cannot process interrupts in time, possibly due to uneven distribution of interrupts causing packet loss.
-
RX frame: Indicates misaligned frames.
The difference between dropped and overruns:
-
Dropped indicates that this packet has entered the network card’s receive buffer FIFO queue and has begun to be processed by the system interrupt in preparation for data packet copying (from the network card buffer FIFO queue to system memory), but due to system reasons (such as insufficient memory), this packet is dropped, meaning it is discarded by the Linux system.
-
Overruns indicate that this packet was dropped before it even entered the network card’s receive buffer FIFO queue, meaning the FIFO is full. Why is the FIFO full? Because the system is busy and cannot respond to the network card interrupt in time, causing packets in the network card to not be copied to system memory promptly, leading to a full FIFO which prevents subsequent packets from entering, meaning this packet is dropped by the network card hardware. Therefore, if overruns are non-zero, it is necessary to check CPU load and CPU interrupt conditions.
Ring Buffer Overflow When the network card’s buffer (ring buffer) is set too small, and the rate at which network packets arrive (production) exceeds the rate at which the kernel processes (consumes) them, the Ring Buffer will quickly fill up, and new incoming packets will be discarded. You can check the statistics of packets discarded due to Ring Buffer overflow through ethtool or /proc/net/dev.
[root@xxx~]# ethtool -S ens2 | grep fifo
rx_fifo_errors:0
tx_fifo_errors:0
[root@xxx~]# cat /proc/net/dev | grep ens2
ens2:6592298107    0000002498272833    000000
You can set the buffer size of the ring buffer through ethtool.
# Modify the receive and transmit hardware buffer size of the network card eth0
$ ethtool -G eth0 rx 4096 tx 4096
Pre-set maximums:
RX:4096
RX Mini:0
RX Jumbo:0
TX:4096
Current hardware settings:
RX:4096
RX Mini:0
RX Jumbo:0
TX:4096
Issues During Interrupt Processing
-
What is an interrupt? There are two types of interrupts: hardware interrupts and software interrupts. Hardware interrupts are generated by hardware, such as disks, network cards, and keyboards; software interrupts are generated by currently running processes.
Hardware interrupts are electrical signals generated by hardware that are sent directly to the interrupt controller, which then sends a signal to the CPU. When the CPU detects this signal, it interrupts its current work to handle the interrupt. The processor then notifies the kernel that an interrupt has occurred, allowing the kernel to handle this interrupt appropriately.
When the network card receives a data packet, it generates an interrupt request (hardware interrupt) to notify the CPU, which interrupts the currently running task and informs the kernel of the new data packet. The kernel calls the interrupt handler (software interrupt) to respond and promptly copy the packet from the network card buffer to memory; otherwise, it may be discarded due to buffer overflow. The remaining processing and operations on the packet will be handled by the software interrupt.
-
What is a multi-queue network card? When a network card continuously receives data packets, it generates many interrupts, and a single interrupt request can only be processed by one CPU. Modern machines have multiple CPUs, and having only one CPU handle Ring Buffer data is inefficient, which is why a mechanism called Receive Side Scaling (RSS) or multiqueue was created to address this issue, hence the need for multi-queue.
RSS (Receive Side Scaling) is a hardware feature of the network card that implements multiple queues. By loading the multi-queue network card driver, you can obtain the model of the network card, determine the number of hardware queues, and combine it with the number of CPU cores to finally derive the number of network card queues to activate using Sum=Min(network card queue, CPU core).
When the NIC receives a frame, it can use a hash function to determine which Ring Buffer the frame should go to, and the triggered IRQ can also be distributed to multiple CPUs through the operating system or manual configuration of IRQ affinity. This way, IRQs can be processed by different CPUs, allowing data in the Ring Buffer to be processed by different CPUs, thus improving data parallel processing capabilities.
RSS affects which CPU the NIC sends IRQs to, but does not affect other logic.
-
What is RPS? Receive Packet Steering (RPS) is a mechanism that implements RSS-like functionality in software when the NIC does not support RSS. The benefit is that there are no requirements for the NIC, and any NIC can support RPS, but the downside is that when the NIC receives data, DMA still stores the data in a single Ring Buffer, and the NIC triggers IRQs that are still sent to one CPU, which is still handled by that one CPU calling the driver’s poll to retrieve data from the Ring Buffer. RPS only takes effect after a single CPU retrieves data from the Ring Buffer; it calculates a hash for each packet and sends it to the corresponding CPU’s backlog, notifying the target CPU via Inter-processor Interrupt (IPI) to process the backlog. The subsequent packet processing flow is completed by this target CPU, thus achieving the goal of distributing the load across multiple CPUs. Typically, enabling RPS will increase the burden on all CPUs.
-
IRQ interrupt request affinity binding You can see the interrupt status on each CPU in the /proc/interrupts file.
/proc/irq/[irq_num]/smp_affinity_list can be used to view the currently bound CPU for a specific interrupt.
You can configure IRQ affinity to specify which CPU handles the IRQ. First, find the IRQ number through /proc/interrupts, then write the desired CPU number into /proc/irq/IRQ_NUMBER/smp_affinity, where the value is a hexadecimal bit mask. For example, if you see that the queue rx_0 corresponds to interrupt number 41, you would execute:
echo 6 > /proc/irq/41/smp_affinity
6 indicates CPU2 and CPU1
The mask for CPU 0 is 0x1 (0001), for CPU 1 is 0x2 (0010), for CPU 2 is 0x4 (0100), for CPU 3 is 0x8 (1000), and so on.
-
Softirq count statistics You can see the softirq count statistics for each CPU through /proc/softirqs:
cat /proc/softirqs
CPU0 CPU1
HI:10
TIMER:16505793243521734270
NET_TX:1028206410655064
NET_RX:36187259352446
BLOCK:00
BLOCK_IOPOLL:00
TASKLET:4701341496
SCHED:17064835401003457088
HRTIMER:169804711604871
RCU:42183779923049934909
NET_RX indicates the softirq triggered when the network card receives packets. Generally, this statistic is used to check whether the softirq distribution is even across CPUs; if uneven, some adjustments may be needed. For example, if you see a large discrepancy between CPU0 and CPU1, it may be because this machine’s NIC does not support RSS and lacks multiple Ring Buffers. After enabling RPS, the distribution becomes more even.
-
How to enable RPS RPS is disabled by default. When the machine has multiple CPUs and the statistics from /proc/softirqs show that NET_RX is unevenly distributed across CPUs or if the NIC does not support multiqueue, you can consider enabling RPS.
To enable RPS, you need to adjust the value of /sys/class/net/DEVICE_NAME/queues/QUEUE/rps_cpus. For example, execute:
<span>echo f > /sys/class/net/eth0/queues/rx-0/rps_cpus</span> This means setting the number of CPUs processing the rx-0 queue of the eth0 network card to f, which indicates that 15 CPUs will handle the data for the rx-0 queue. If your CPU count is less than this, it will default to using all CPUs.
-
netdev_max_backlog tuning netdev_max_backlog is the buffer queue before the kernel processes packets received from the NIC by the protocol stack (such as IP, TCP). You can determine if netdev backlog queue overflow has occurred through softnet_stat.
[root@xxx ~]# cat /proc/net/softnet_stat
000000bf 00000000000000000000000000000000000000000000000000000000000000000000000000000000
0000002800000000000000000000000000000000000000000000000000000000000000000000000000000000
000000c7 00000000000000000000000000000000000000000000000000000000000000000000000000000000
0000000000000000000000000000000000000000000000000000000000000000000000000000000000000000
0000003100000000000000000000000000000000000000000000000000000000000000000000000000000000
0000000000000000000000000000000000000000000000000000000000000000000000000000000000000000
0000000000000000000000000000000000000000000000000000000000000000000000000000000000000000
0000000000000000000000000000000000000000000000000000000000000000000000000000000000000000
0000000000000000000000000000000000000000000000000000000000000000000000000000000000000000
000021d8 00000000000000000000000000000000000000000000000000000000000000000000000000000000
0000000000000000000000000000000000000000000000000000000000000000000000000000000000000000
0000092900000000000000000000000000000000000000000000000000000000000000000000000000000000
Each line represents the status statistics for each CPU core, from CPU0 downwards. Each column represents various statistics for a CPU core: the first column represents the total number of packets received by the interrupt handler; the second column represents the total number of packets dropped due to netdev_max_backlog queue overflow; the third column indicates the number of times soft interrupts took netdev_budget packets or took packets for more than 2ms; columns 4-8 are fixed at 0 and are meaningless; the ninth column indicates the number of times the corresponding queue was locked during packet transmission.
The default value of netdev_max_backlog is 1000, and we can modify the kernel parameters to tune it:
<span>sysctl -w net.core.netdev_max_backlog=2000</span>
Link: https://www.cnblogs.com/OpenSourceSite/p/18121680
(Copyright belongs to the original author, please delete if infringed)
WeChat Group
For better communication on operation and maintenance and related technical issues, a WeChat group has been created. Friends who want to join the group can scan the QR code below to add me as a friend (note: join the group).

Blog
CSDN Blog: https://blog.csdn.net/qq_25599925
Juejin Blog: https://juejin.cn/user/4262187909781751
Knowledge Planet: https://wx.zsxq.com/group/15555885545422
Long press to recognize the QR code to visit the blog website for more quality original content.