Hot Article Introduction| Click the title to read
How can programmers break through and improve themselves in the winter of the Internet?
A 41-year-old programmer was laid off, with 15 million in real estate in Beijing, and the programmer asked: Should I retire?
After two months of resignation and a month of sending resumes, the journey of job hunting from Android to web front-end
Original source: https://www.jianshu.com/p/11eb07273478
Book Recommendations
There are not many books on Android performance optimization on the market, because performance optimization involves a wide range of knowledge and tools, making the content of the following books somewhat superficial.
Mobile App Performance Testing and Optimization
-
Overall good, but the examples provided are not commonly seen in daily development work.
-
The chapter on network optimization is written the best, providing many insights after a first read, and I am continuing to delve into it.
Practical Android Mobile Performance
-
Introduces many tools.
-
The examples given are quite common, but the introduction is rather cursory.
-
Includes some unrelated content.
Android Application Performance Optimization
-
Discusses the knowledge and optimization at the JNI level in detail.
-
After removing the JNI parts, the content resembles a series of tips, which is quite scattered.
The Significance of Memory Performance Analysis and Optimization
Overview of memory management
OOM
-
The heap memory allocated to the app by the system has an upper limit, which is not determined by how much memory is free, but can be obtained using getMemoryClass().
-
You can set largeHeap to true in the manifest file to increase the heap memory limit, and getLargeMemoryClass() can obtain this value.
-
Exceeding the virtual machine’s heap memory limit will cause OOM.
Low Memory Killer
-
Android memory management uses paging and memory-mapping techniques but does not use swap; instead, it uses the Low Memory Killer strategy to improve the utilization of physical memory. This means that besides GC and killing processes to recover physical memory, there are no other ways to utilize already occupied memory.
-
When the foreground application switches to the background, the system does not end its process but caches it for the next startup. When the system memory is insufficient, it releases cached processes based on a least recently used plus priority to free memory-intensive applications.
GC
-
High memory usage can slow down GC speed, causing stuttering.
-
Excessive memory usage during object creation can easily trigger GC, impacting app performance.
In Summary
Monitoring and reducing the memory consumption of applications can reduce the probability of OOM, providing a better user experience in memory-constrained scenarios, and extending the application’s background survival time.
Tool Introduction
Investigate RAM usage
-
GC-LOG
-
dumpsys meminfo
-
Profiler
-
jhat
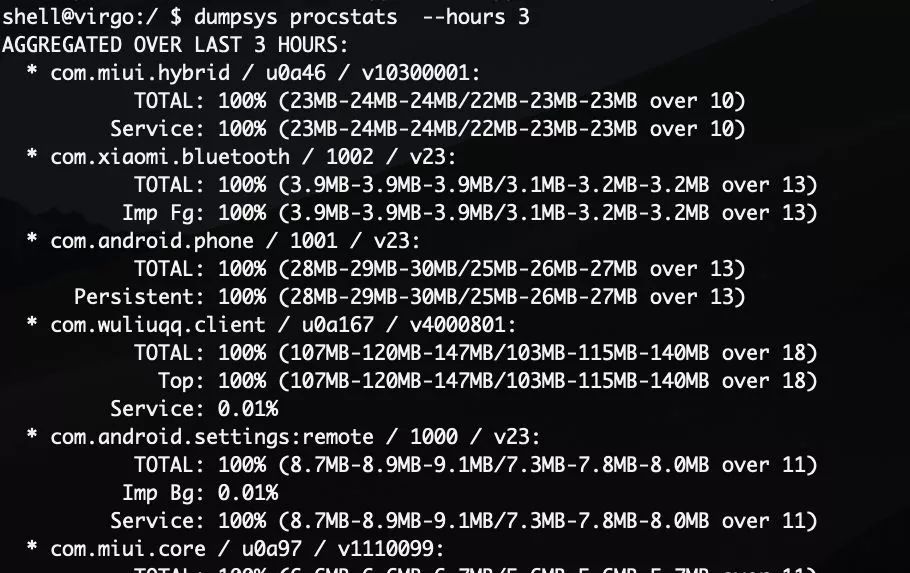
dumpsys procstats
Used to measure the memory consumption of applications over a period of time.
-
PSS: Proportional Set Size actual memory allocated for shared memory.
-
USS: Unique Set Size process private memory PSS=USS+shared memory/shared memory process count.
(Minimum PSS – Average PSS – Maximum PSS / Minimum USS – Average USS – Maximum USS)
LeakCanary
Tool for detecting memory leaks.
MAT
Common tool for analyzing memory dump files.
Usage Method
-
Use Memory Profiler to dump memory data.
-
The exported hprof file is not a standard MAT file and needs to be converted using hprof-conv provided in the SDK.
hprof-conv -z src dst //-z can exclude objects created by the Android frameworkUsage Scenario
-
Overall identification of memory optimization bottlenecks.
-
Tool for scenarios where only dump files are available, or where specific issues cannot be located and only the scene is present without clues.
-
For specialized memory optimization, it feels less effective than code debugging + profiler.
Scenario Analysis Construction
Performance Testing Considerations
-
Need to consider realistic scenarios as much as possible.
-
Need to turn off logs and other debugging components to avoid interference.
Common Performance Testing Methods
-
Switching to the background.
-
Repeatedly executing functions.
-
Long-term execution of functions.
-
Switching between multiple scenarios.
Common Scenarios for Memory Issues
-
Interfaces that include image displays.
-
Scenarios that involve transmitting large amounts of data over the network.
-
Scenarios that require caching data.
Common Memory Issues
Memory Leaks
Causes of Memory Leaks
A lifecycle of an object has ended, but other objects hold its instance, preventing it from being reclaimed during GC. In Android, this usually happens when an Activity has references after it finishes, leading to memory leaks.
Common Scenarios of Memory Leaks
-
Asynchronous operations where the async logic has not finished, while the Activity has ended or been rebuilt.
-
Thread/Handler/AsyncTask/Rxjava/Timer, etc.
-
Using static variables or singletons that directly or indirectly save the Activity instance but are not released in time.
-
Registered broadcasts not unregistered.
-
ObjectAnimator not called cancel.
-
I/O operations not closed or released in time.
-
Memory leaks caused by WebView.
Manifestation of Memory Leaks in Analysis Tools
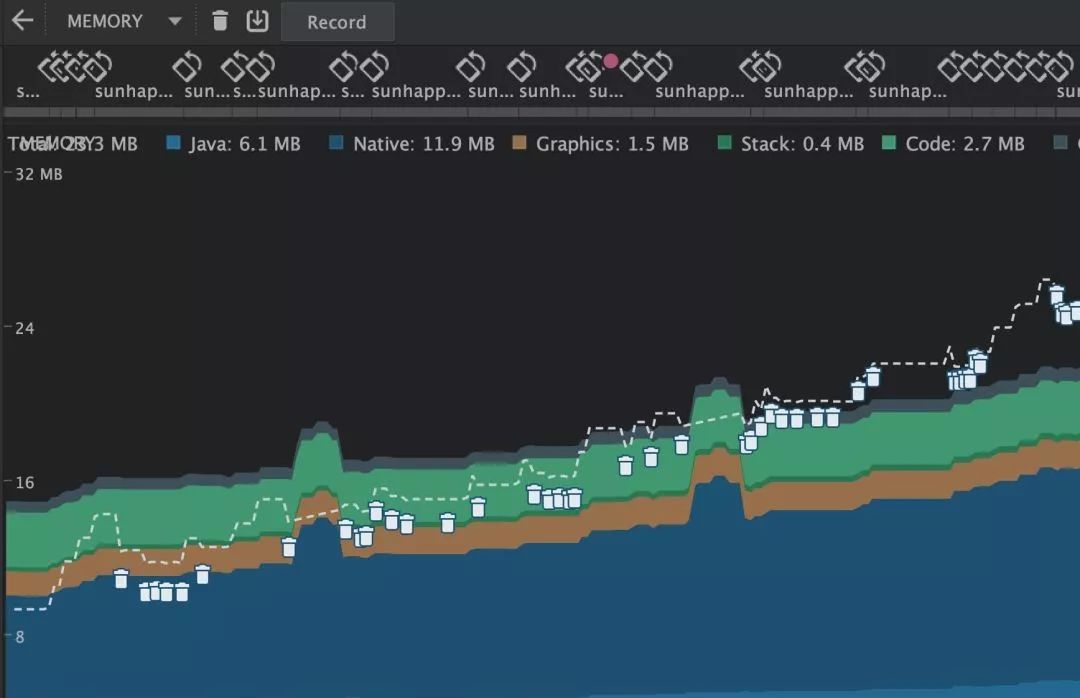
Every time an Activity is rebuilt, memory usage increases, and GC does not reduce memory usage.
Avoiding Memory Leaks
-
LeakCanary
-
StrictMode
-
Use ApplicationContext in places where it is unnecessary to use Activity as Context.
-
Use WeakReference.
-
Use ViewModel + LiveData/RxJava + Rxlifecycle and other tools to implement asynchronous logic to avoid memory leaks.
-
Check operations that need to be handled when destroyed, such as xxx.cancel()/xxx.close()/xxx.unregister()/xxx.remove(), etc.
Memory Thrashing
Causes of Memory Thrashing
Memory thrashing generally occurs when a large number of objects are created in a short time, triggering multiple GCs and causing stuttering.
Scenarios of Memory Thrashing
-
IM notifications need to be forwarded to all WebView interfaces. When the app is just opened, multiple notifications arrive simultaneously, or in group chats with many messages, it can cause frequent GCs in a short time, accompanied by interface stuttering.
Manifestation of Memory Thrashing in Analysis Tools
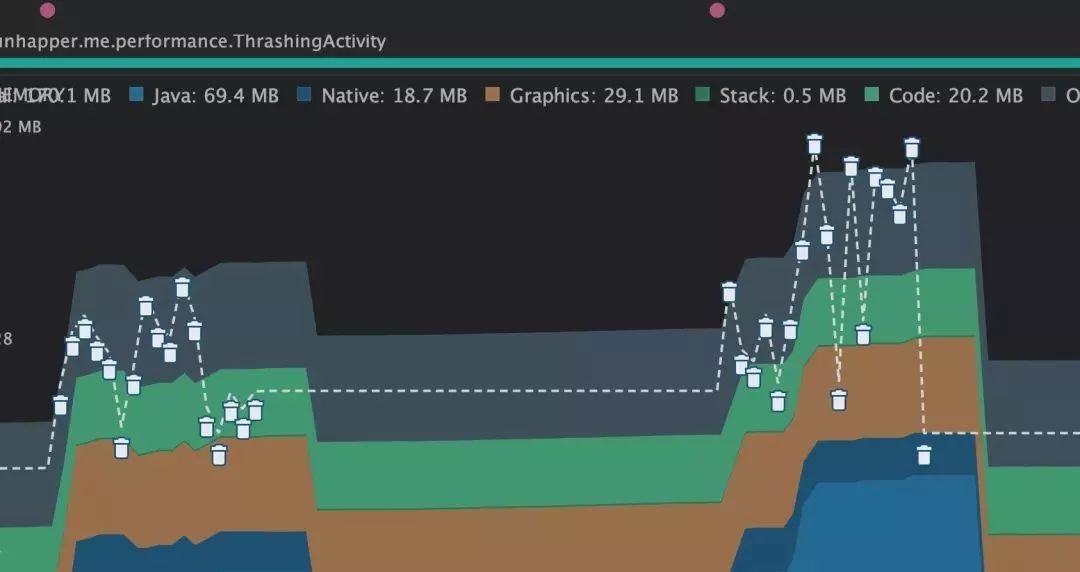
Creating a Memory Thrashing Scenario
public void testThrashing(boolean needLog) { int dimension = 300; int[][] lotsOfInts = new int[dimension][dimension]; Random randomGenerator = new Random(); for (int i = 0; i < lotsOfInts.length; i++) { for (int j = 0; j < lotsOfInts[i].length; j++) { lotsOfInts[i][j] = randomGenerator.nextInt(); } } //Optimization before for (int i = 0; i < lotsOfInts.length; i++) { String rowAsStr = ""; int[] sorted = getSorted(lotsOfInts[i]); for (int j = 0; j < lotsOfInts[i].length; j++) { rowAsStr += sorted[j]; if (j < (lotsOfInts[i].length - 1)) { rowAsStr += ", "; } } if (needLog) { Log.i(TAG, "Row " + i + ": " + rowAsStr); } } } public void optimizeThrashing() { int dimension = 300; int[][] lotsOfInts = new int[dimension][dimension]; Random randomGenerator = new Random(); for (int i = 0; i < lotsOfInts.length; i++) { for (int j = 0; j < lotsOfInts[i].length; j++) { lotsOfInts[i][j] = randomGenerator.nextInt(); } } //Optimization after StringBuilder sb = new StringBuilder(); for (int i = 0; i < lotsOfInts.length; i++) { sb.delete(0, sb.length()); int[] sorted = getSorted(lotsOfInts[i]); for (int j = 0; j < lotsOfInts[i].length; j++) { sb.append(sorted[j]); if (j < (lotsOfInts[i].length - 1)) { sb.append(", "); } } Log.e(TAG, "Row " + i + ": " + sb); } }-
My personal experience is that the stuttering caused by GC is not very noticeable (it may also be because the demo is not too complex, and GC takes little time).
-
I feel that stuttering mainly occurs in complex scenarios, usually accompanied by a large number of operations on the main thread, and frequent GCs caused by memory thrashing can exacerbate the stuttering.
Solutions
-
The simplest solution is to move previous main thread operations to a child thread. Although memory thrashing still exists, the stuttering issue can be greatly alleviated.
-
For memory thrashing itself
-
Avoid creating objects inside loop bodies, and move object creation outside the loop body.
-
When a large number of Bitmaps and other large objects are needed, try to reuse previously created objects.
-
For black boxes (e.g., memory thrashing caused by IM notifications and time-consuming operations on the main thread)
-
Control the triggering frequency to reduce the degree of stuttering.
-
Add a registration mechanism so that notifications are only sent to pages that need to receive them.
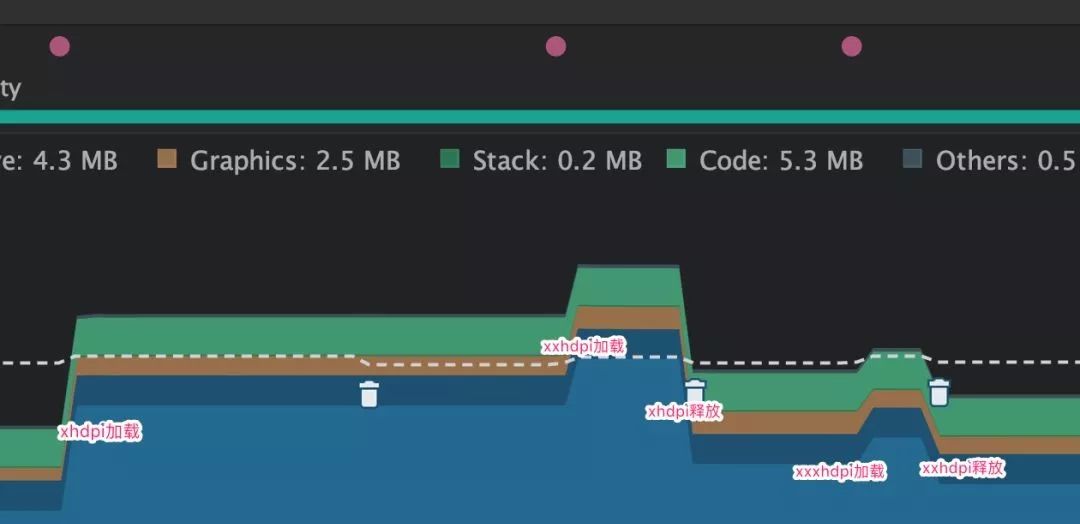
Memory Usage of Image Loading
The Impact of Different DPI Folders on Image Memory
-
Different dpi qualifiers correspond to dpixxxhdpi-640xxhdpi-480xhdpi-320mdpi-160.
-
The width and height of the Bitmap loaded through resId are calculated as bitmap width = actual image width * screen dpi / folder corresponding dpi.
-
Images loaded from the nodpi folder will maintain their original size.
-
Loading Bitmap sizes calculated from 1920*1080 images placed in different folders using a device like Xiaomi Note with a dpi of 440.
| Folder | Corresponding DPI | Bitmap Width | Height | Size | Multiplier |
|---|---|---|---|---|---|
| nodpi | 1920 | 1080 | 8294400 | 1 | |
| xxxhdpi | 640 | 1320 | 743 | 3923040 | 0.47 |
| xxhdpi | 480 | 1760 | 990 | 6969600 | 0.84 |
| xhdpi | 320 | 2640 | 1485 | 15681600 | 1.89 |
| mdpi | 160 | 5280 | 2970 | 62726400 | 7.56 |
Suggestions for using images
-
Try to use cut images under 1080p resolution.
-
Images should preferably be placed in folders above xxhdpi.
-
Large images such as Splash and guide page images should be placed in the nodpi folder, limiting image size by controlling ImageView size.
-
Following the above operations may increase the APK size; images can be converted to webp and compressed.
RGB565
In addition to the image resource folders, the color mode used when loading images also affects Bitmap size. ARGB8888 uses 32 bits, so one pixel requires 4 bytes; RGB565 uses 16 bits, so one pixel only requires 2 bytes. However, RGB565 lacks an alpha channel, which can cause display issues with transparent images, and there are some differences in display quality. Therefore, it is not recommended to modify this property, but it can be used as a special measure for optimization in scenarios with strict memory requirements.
Impact of ProGuard on Memory
Compressing code and resources
-
ProGuard can rename classes, methods, and variables, eliminate useless code and resources, reduce dex size, which not only reduces APK size but also decreases the memory required to load dex.
-
Since the virtual machine loads dex files on demand, and the minimum unit of memory allocation is a page, loading a function’s code will also load unrelated codes in the same memory page. ProGuard can reorder the bytecode of classes in the dex file, making classes with mutual calling relationships more compact in the dex, thus requiring less memory to load the same functionality.
Memory Fragmentation

Davik’s memory recycling algorithm cannot move objects, which can cause a small object to occupy an entire memory page, leading to memory fragmentation. However, ART virtual machines can organize memory space during GC. As the share of systems above 5.0 increases, memory consumption caused by fragmentation can be less of a concern.
Other Memory Issues
Manage your app’s memory
-
Release UI resources when the page is not visible and receives onTrimMemory(TRIM_MEMORY_UI_HIDDEN).
-
Use getMemoryInfo() to obtain memory information, ensuring that you do not allocate large memory and cause OOM.
-
Be cautious in using Services.
-
Use IntentService.
-
Use JobScheduler for background scheduling.
-
Use optimized containers like SparseArray, etc.
-
Code abstraction can lead to additional memory consumption.
-
Use @IntDef, @StringDef instead of enums.
Did you gain something from this article? Please share it with more people.
Our knowledge group is in its third phase, having reached 1100 members, which is not easy to achieve. Many old users have renewed their subscriptions, with a renewal rate of 50%, indicating that everyone recognizes our knowledge group.
Welcome to join our knowledge group as soon as possible.
For more information about the group, please refer to:
Welcome to join the Java and Android architecture community.
How to advance to become an Android version architect of Java?
Two things to mention.

Scan the QR code above to receive advanced resources for Android, Python, AI, Java, etc.
For more learning materials, click below to get “Read the Original”. ”

Thank you, boss, for the thumbs up↓