For more useful knowledge, feel free to follow my knowledge circle.Free, free, free.All knowledge can be downloaded directly. Scan below:

Purpose:To improve key manufacturing indicators of the enterprise within six months.
Y Technology Co., Ltd. is a high-tech comprehensive enterprise mainly engaged in the design and production of color liquid crystal modules (LCM) and communication products, with the main production process being cutting, sealing (COG), and LCM assembly. The company has an annual revenue of 500 million yuan and plans to go public in 2013, with approximately 1,000 employees.The company is a family business, with important positions occupied by family members, some of whom have backgrounds and experiences that do not match their positions, leading to conflicts; the enterprise management is still conducted in a personalistic manner rather than through institutional management, which is relatively flexible; additionally, there is a large number of employees who have served for over five years, following the boss in entrepreneurship and being favored, but a considerable number of old employees are unambitious and very resistant to attempts at innovation; due to the lack of assessable projects and methods, the enterprise management is chaotic and wasteful, but since the company is still making money, some serious problems are concealed and ignored.
In recent years, competition in the industry has intensified, and customer attrition has occurred frequently, with customers becoming increasingly picky and complaints increasing. The top management realized that change was necessary.
In response to the weak management of the company and the need for a public listing, the company’s management attempted to invite a neutral third-party consulting firm to coordinate resources and improve the overall operational management of the enterprise.
2 Current Status of the Enterprise:
After two weeks of in-depth on-site research and personnel interviews by the consulting expert team, the diagnosis results of the company are as follows:
1. Strong product sales capability, with rapid growth in sales to major customers in the past two years, and already possessing a certain scale and reputation in the industry.
2. Basic capabilities in various links of product realization.
3. Departmental setup is relatively complete, and human resources in each department are relatively abundant.
4. The production workshop and production equipment are advanced, and production capacity meets the current customer demand.
5. Procurement channels for key raw materials are relatively smooth.
6. The company is growing quickly, which has a motivating effect on employee morale.
1. The production planning system lacks systematic and scientific management.
2. There are no effective countermeasures for supplier schedule and quality issues, which seriously affect production achievement.
3. The quality system processes need to be sorted and executed properly.
4. On-site management needs improvement in visualization and dataization.
5. The layout is unreasonable, with long transportation distances and poor transport flow: backflow, crossing, etc., and the line arrangement is irrational.
Based on the above current status of the enterprise, after discussions and communications between the consulting team and the senior management of Y Company, it was decided to improve the areas needing enhancement in the form of projects, solving company difficulties through projects while also enhancing the management skills and awareness of the company’s core staff.
Project Name: Management Consulting Project
Project Duration: 2011.2~2011.8
Due to the limited length of this article, only two cases are listed: reducing COG material loss and improving assembly efficiency.
3.1 Reducing COG Material Loss:
3.1.1 Definition: Defects caused during the manufacturing process due to abnormal production equipment, operational errors, etc.; defects caused during transportation; defects caused by incoming material issues that cannot be repaired, which need to be borne by the company, are collectively referred to as process material loss. The calculation formula is as follows:
Process Material Loss Rate (%) = 1 – (Number of Qualified Finished Products / Total Input Quantity)
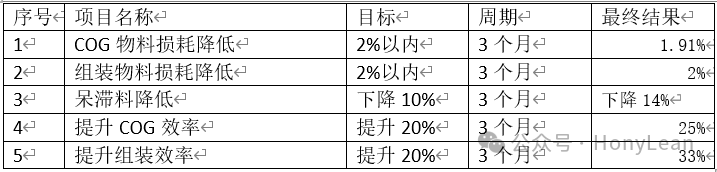
3.1.2 Goal Setting and Decomposition
In the entire production workshop, types of material loss include POL (polarizer), BL (backlight), LCD, FPC, IC, TAB, TP (touch screen), among which POL accounts for 60% of total loss, making it the primary loss. In the COG workshop, among various defect sites, process POL defects and incoming POL defects account for 82% of all defects, thus POL loss indicators are the key monitoring indicators. The overall project goals and decomposition are shown in Figure 1:
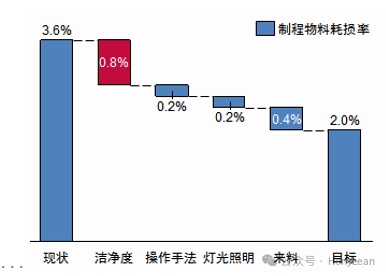
Figure 1: Cause Analysis Diagram
3.1.3 Main Improvement Measures
In the on-site data collection analysis, after conducting multivariable analysis across time, personnel, and products, the following three points were concluded:
The time difference is the largest, with the first 3-4 hours of each line having an extremely high defect rate, with the maximum difference reaching 16.9 times.
Secondly, personnel caused significant differences in defects, with differences between five chip mounters on each line reaching a maximum of 11 times.
Finally, the differences were due to line and model variations, with significant differences between different lines or models, with a maximum of 5 times.
Through collective wisdom and brainstorming, the cleanliness, operational methods, lighting, and incoming materials were preliminarily identified as the main causes affecting the above three differences.
3.1.3.1 Cleanliness Improvement: This is a major key factor causing the above time and model differences, and the following are several key measures to enhance cleanliness:
Ø Increase clean booths at chip mounter workstations.
Ø Introduce humidification pipelines in the workshop.
Ø Replace vacuum cleaners with mops for workshop cleaning.
Ø Regularly clean ion wind machines every month.
3.1.3.2 Operational Method Improvement: On-site observations revealed significant differences in operational methods between high-yield and low-yield workstations, thus, studying and breaking down the operational actions of personnel at high-yield workstations led to the following key improvement measures:
Ø Require that products above 3.2 be wiped down, protective film removed, and LCD wiped again (using two alcohol bottles) before proceeding with chip mounting.
Ø Conduct group DV learning and reinforcement training.
Ø Organize employee skill competitions.
3.1.3.3 Work Environment Improvement: The differences in defects on the lines are mainly reflected in the differences in the work environment. Currently, it has been found that new lines have better yields, and based on the differences between new and old lines, the following countermeasures were formulated:
Ø Replace ordinary desk lamps with halogen lights.
Ø Assign a dedicated person to clean the vacuum packaging boxes with air guns and dust-free cloths.
3.1.4 Improvement Results: After three months of improvement, the material loss rate decreased from 3.6% to 1.91%, effectively controlling the material loss rate in the COG workshop and successfully achieving the goal. This not only improved the workshop yield but also significantly reduced the company’s costs.
3.2 Improving Assembly Efficiency:
Before the project intervention, the entire assembly process became a bottleneck for the company’s shipments, deeply trapped in low process efficiency and incoming material abnormalities, with no significant improvements for a long time, mainly reflected in: 1. The overall efficiency of the assembly production line is low, often failing to complete the PMC daily production tasks, requiring additional overtime requests to meet shipping needs. 2. Severe backlog phenomena occur at each workstation on the assembly line, leading to low line balance rates, making it difficult to identify the real bottleneck workstation and impossible to improve production efficiency. 3. From the input of supporting materials to the line, it takes at least three to four hours before finished products are produced, affecting customer delivery times.
3.2.1 Definition: Assembly efficiency improvement takes UPPH as the key project indicator, as the entire assembly workshop is mainly manual labor. The calculation method is as follows:
UPPH = ∑Equivalent Coefficient * Product Output / Total Input Working Hours
l The equivalent coefficient considers the efficiency differences caused by the difficulty and special structure of manufacturing products, thus setting a coefficient that is a ratio to the standard time product defined as “1” [which can be the product with the largest quantity or the standard time of the department’s UPPH target] to eliminate efficiency differences caused by product complexity.
l Product output refers to the number of normal incoming qualified products, excluding packaged rework products.
l Total input working hours refer to the attendance working hours of the line-related personnel, including direct operating employees, material preparers, and team leaders.
3.2.2 Goal Setting and Decomposition
To better achieve goals and focus resources, this project established a team mainly composed of engineering, production, and quality to carry out improvement projects, selecting the assembly line three, which was relatively stable at that time, as the benchmark line for verification and improvement, and then promoting it throughout the workshop. The following is the decomposition of goals based on the influencing factors as shown in Figure 2.
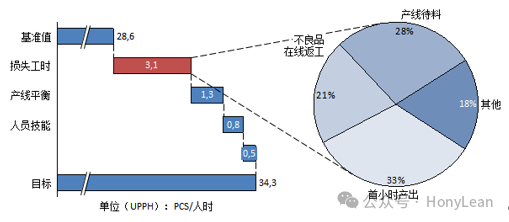
Figure 2: Goal Setting and Decomposition
3.2.3 Main Improvement Measures
After goal decomposition and data collection, based on on-site analysis and collective discussion, several key measures were concluded, including rolling single production introduction, line balance improvement, on-site 5S improvement, and multi-skilled worker training as the focus of improvement, which were then promoted to other production lines.
3.2.3.1 Rolling Single Production Introduction (Seamless Shift Change)
After on-site record analysis, it was found that there was no output in the half hour before the shift, mainly completing re-routing, counting, process training, and material preparation, all of which could be completed outside the line according to the SMED model analysis, meaning that the previous shift could complete these systematic actions without clearing the line. Therefore, a seamless shift change process was developed and trained. This improvement allows the previous shift’s products to remain on the line, with personnel from the next shift entering on a one-to-one basis, achieving continuous flow of products on the entire line and achieving “zero” switching in production.
3.2.3.2 Line Balance Improvement
Initially, the entire line’s WIP (Work in Progress) was very serious, leading to waiting for personnel in the second half of the shift after starting work, while personnel in the first half were waiting as the shift was about to end. After line balance calculations, the line balance was only 65%, with the total bottleneck in the later performance testing. The current process is as follows: soldering – backlight assembly – soldering – pasting brown glue – performance testing – appearance inspection, with key improvement measures:
Ø Optimization of performance testing fixtures: The testing screen was simplified from 7 sides to 4 sides, with testing time per side reduced from 3 seconds to 1.2 seconds, and the number of operators reduced from 4 to 3, eliminating capacity bottlenecks.
Ø Optimization of backlight assembly: The blow dryer was moved from the desktop to below the table (reducing table dust), and backlight fixture operations were introduced, reducing the number of operators from 4 to 3, eliminating capacity bottlenecks.
Ø Optimization of the brown glue application action: Changed from taking 1 piece at a time to taking 5 pieces at a time.
As a result of the above improvement measures, the number of personnel was reduced from 22 to 20, production capacity increased from 600 PCS/H to 800 PCS/person, and line balance rate increased from 65% to 83%.
3.2.3.3 On-site 5S Improvement
Ø It was found on-site that the time spent searching for materials and wasted actions were significant; thus, improvements were made:
Ø Removed the small table next to the workstation.
Ø Implemented the “Three Fixes” for materials on each workstation.
Ø Used red boxes to distinguish defective products.
Ø Changed material handling from warehouse-based to pull-based.
Ø On-site 5S improvements.
3.2.4 Improvement Results
After three months of improvements, the benchmark line increased by 20%, and the overall efficiency of the assembly department improved by 25%. At this time, the assembly department had significant improvements in cost optimization, work site management, and personnel skills.
4 Summary of Successful Experiences
Y Company has made significant changes in key manufacturing indicators within six months, and improvements have also been seen in the on-site environment, employee morale, and management team skills. The achievements are closely related to the TPS model implemented by the consultants. Technical improvements have been a key factor in enhancing project KPIs, personnel improvements have created a proactive improvement atmosphere for project implementation, and systematic improvements have made strong contributions to maintaining and standardizing indicators. For specific details, please refer to the previous article “Key Factors for Successful Implementation of Lean Production in the Mobile Phone Industry”.
Quick Line Change Case (Stamping/Injections/SMT)
XX Company Quality Management Case
Mobile Phone Capacity Improvement Summary Case
XX Company Delivery Capacity Improvement Project Case
Home Appliance Air Energy Water Heater Factory Planning Case
Case Study: Transformation of Small and Medium-Sized OEM Factories to OBM Factories
Wei Hong Lean Case: CELL Line Establishment Project
Wei Hong Lean Case: HY Company Comprehensive Reform, Enhancing Customer Satisfaction
Wei Hong Lean Case: HR Case
Lean Production Case: Establishment of Lean Benchmark Line in M Base
Lean Production Case: Lean Production Practice of Certain Battery Diaphragm
Lean Production Case: Systematic Efficiency Improvement Case of M Company
Case Study: Improvement of Rework Rate for Nitrile Products
Case Study: Improvement Project Practice for Toner Quality
Lean Production Practice in the Snack Food Industry
Lean Production Practice in the Dairy Industry
Supply Chain Case for Mass Customization
G Company Flexible Line Transformation Case
Continuous Improvement Case by Producing According to Orders
Or become a knowledge circle member to read knowledge for yourself!
If free is still not enough to meet your needs, you can join the paid knowledge circle to gain more knowledge!

If you also want to expand your network through reading and learning like me, why not sign up.