Follow/Star Public Account to not miss any messages!

This tutorial was updated and published by the original author strongerHuang in November 2018.
Tags: Keil, MDK-ARM, µVision
Copyright: Commercial use prohibited
Disclaimer:This document is for personal learning use only, for reprints please contact the author via the public account for authorization.
1Introduction
Debugging is a crucial process for programmers, so it is essential to master these debugging features of Keil.
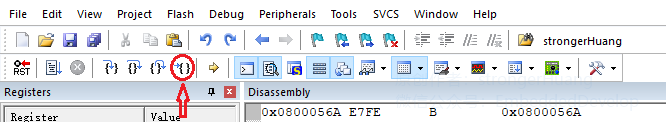
Click the Debug button to enter debugging mode, and the Debug Toolbar will appear as shown below.
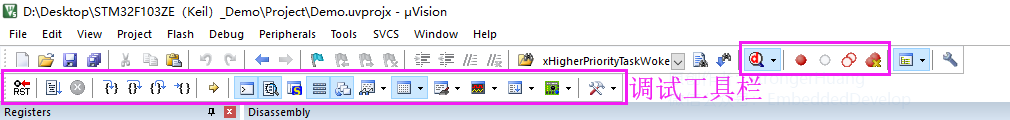
The buttons we need for debugging include those highlighted in the image above, but the commonly used buttons are the first eight on the debugging toolbar: Reset, Run Full Speed, Stop, Step, Step Over, Step Out, Run to Cursor Line, Show Next Statement.
2
Shortcut Keys
The main meanings of these toolbar buttons can be referenced in Keil Series Tutorial 03: Detailed Explanation of Main Window and Toolbar.
The debugging toolbar buttons are located in the Debug menu, and the debugging view window is found in the View menu. You can refer to the article Keil Series Tutorial 04: Overview of Menus.
Similarly, these debugging toolbar buttons can also be accessed via shortcut keys; some do not have default shortcuts and can be added through Configuration. Please refer to the article Keil Series Tutorial 08: Configuration (Part II) for the Shortcut Keys section.
Next, let’s learn those eight debugging buttons, four breakpoint buttons, and some content from the debugging view windows.
3
Eight Debugging Buttons
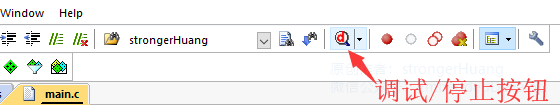
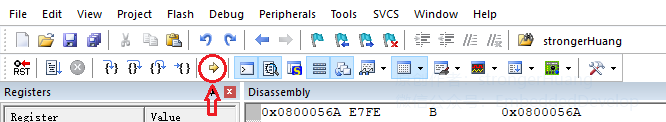
Ensure the code compiles without errors, click the Start/Stop Debugging button (as shown below), or use the shortcut Ctrl + F5 to enter debugging mode. The debugging toolbar as shown at the beginning of this article will appear.
3.1 Reset
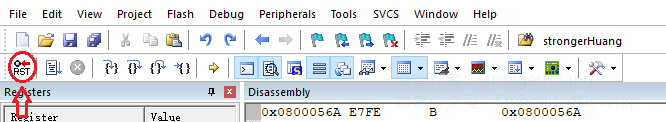
Reset resets the program to the starting point and restores it to its initial state.
3.2 Run
Run (F5) puts the program in running state. This button is effective when the program is stopped.
3.3 Stop
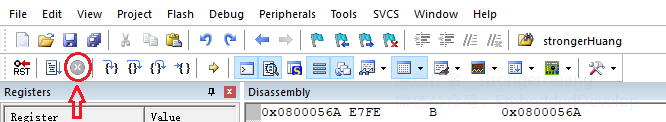
Stop stops the currently running program. This button is effective when the program is running.
3.4 Step
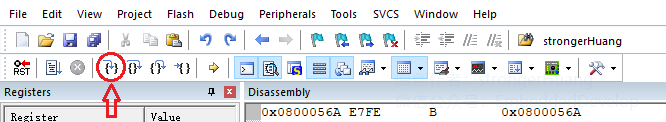
Step (F11) runs the program one step at a time; when you click the button, it runs one step (single step), and if it encounters a function, it will step into the function (the arrow enters the parentheses). This button is effective when the program is stopped.
3.5 Step Over
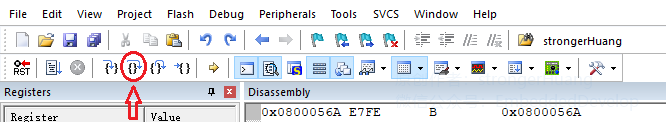
Step Over (F10) runs the program one line at a time; when you click the button, it runs one line (single line), and if it encounters a function, it skips over the function (the arrow skips the parentheses). This button is effective when the program is stopped.
3.6 Step Out
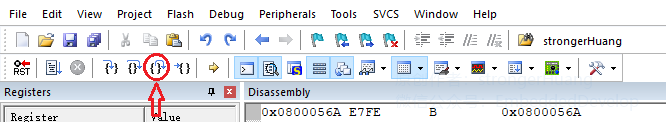
Step Out (Ctrl + F11) runs the program out of the current function (the arrow exits the parentheses) until it exits the outermost function (main function). This button is effective when the program is stopped.
3.7 Run to Cursor Line
Run to Cursor Line (Ctrl + F10) places the cursor on a specific line, clicks this button, and the program runs at full speed until it stops at the cursor’s position (provided the program can run to the line where the cursor is).
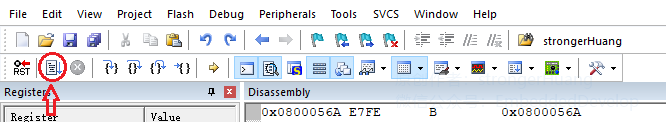
3.8 Show Next Statement
Show Next Statement jumps to the line where the program is paused (stopped). This button is effective when the program is stopped.
4
Four Breakpoint Buttons
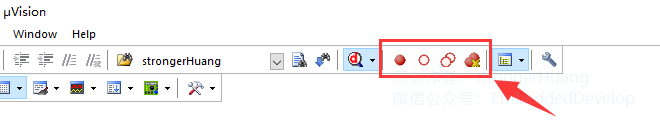
During debugging, these four buttons are also commonly used, from left to right: Insert/Remove Breakpoint, Enable/Disable Breakpoint, Disable All Breakpoints, Kill All Breakpoints.
4.1 Insert/Remove Breakpoint
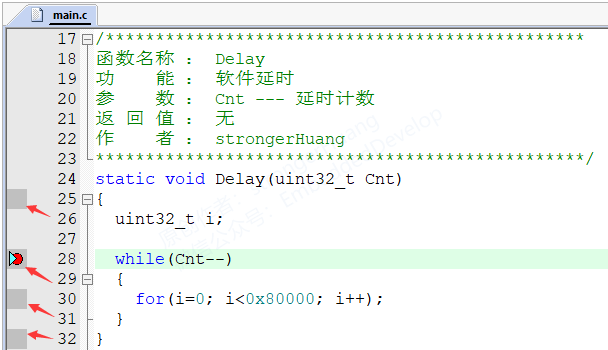
Insert/Remove Breakpoint (F9) inserts a breakpoint at the current cursor line; clicking again removes the breakpoint.
This button operation is equivalent to clicking once with the mouse before the line of code, note that it is only effective on gray lines (i.e., where the program can execute), as shown below:
4.2 Enable/Disable Breakpoint
Enable/Disable Breakpoint (Ctrl + F9) on the basis of having a breakpoint, clicking this button disables the breakpoint, clicking again enables it.
Disabling a breakpoint means keeping the breakpoint but making it ineffective (the program does not stop when it executes there).
4.3 Disable All Breakpoints
Disable All Breakpoints keeps all breakpoints but makes them ineffective (similar to the previous one), but here you cannot re-enable all breakpoints.
4.4 Kill All Breakpoints
Kill All Breakpoints (Ctrl + Shift + F9) is different from disabling, here it does not keep breakpoints, i.e., it cancels all project breakpoints, also called killing all breakpoints.
5
Debug View Windows
The debug view window only appears when entering debugging mode; the window names can be referenced in the article Keil Series Tutorial 04: Overview of Menus in the View menu section.
This section describes several commonly used view windows during debugging.
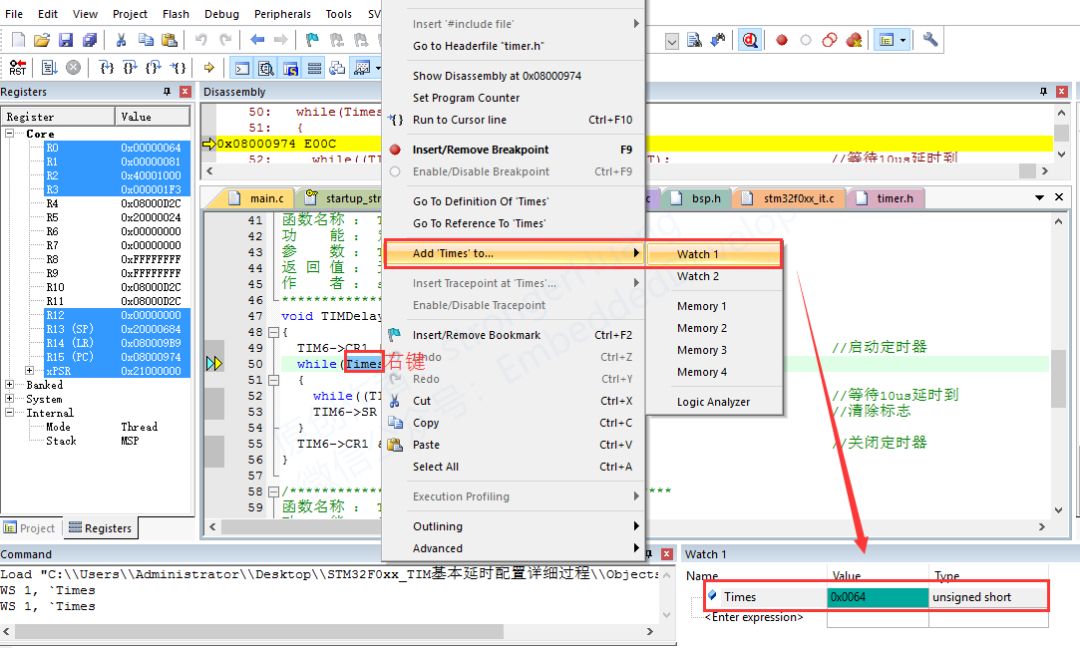
5.1 Watch Window
Watch Window for viewing variables, with Watch1 and Watch2 windows, both the same, allowing users to view multiple windows simultaneously.
These debug view windows can be opened via the menu or by clicking the toolbar button.
Select a variable -> right-click -> Add ‘xxx’ to -> Watch1, and the Watch1 window will automatically pop up:
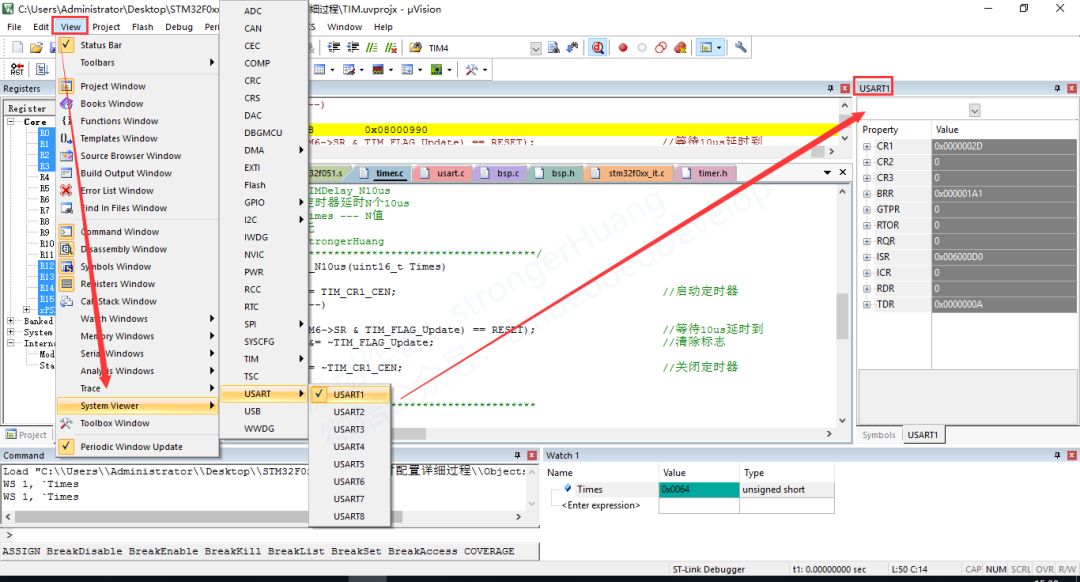
5.2 System Viewer Window
System Viewer window (Peripheral IO, USART, TIM, etc.) can be understood as a window for viewing peripheral registers, as shown below, for viewing USART register values.
These debug view windows are specifically for debugging, making it easier to view debug information, mastering these contents will improve your debugging efficiency and allow for more precise bug location.
6
Notes
1. This document is for personal learning use only, copyright reserved, commercial use prohibited.
2. This article was edited and organized by myself, and there may be some errors.
3. This article is included in the public account “Embedded Column”; follow the public account and reply with 【Keil Series Tutorial】 to view the entire series of tutorials.
7Conclusion
If you find this article helpful, please give a thumbs up and share, it is a great support and encouragement for me.
Scan the QR code below and follow the public account for more exciting content in the bottom menu!

Long press to recognize the QR code in the image to follow