Developing software based on Zephyr can be more challenging without effective debugging and analysis tools specifically designed for multithreaded code. Percepio Tracealyzer enables you to quickly troubleshoot and accelerate your daily development. Optimizing your system for reliable real-time performance is convenient, and you can start using this software within 15 minutes with a free evaluation.
Simplify Debugging and Accelerate Development


“Tracealyzer has doubled our development speed, and this tool significantly resolves issues that used to take days to fix, and it’s just a quick solution. We have been using it consistently.
—Alex Pabouctisids, Chief Firmware Engineer at Flyability
Tired of endlessly debugging embedded C/C++ code? Say goodbye to tedious troubleshooting and welcome Percepio Tracealyzer to accelerate development. For today’s complex RTOS or Linux systems, traditional debugging is often ineffective and can consume 40-50% of development time. Use Tracealyzer to gain visual tracking observability, speeding up your daily debugging and solving problems that traditional debugging cannot address. Learn below how Tracealyzer simplifies debugging.
Optimize System Performance
“In less than 5 days of running the tool, we improved the performance of our graphics rendering engine by three times.”
—Terry West, CEO of Serious Integrated Inc.
Tracealyzer provides advanced analysis features that display the events behind the numbers. Identify performance bottlenecks and unleash the full potential of your hardware. Ensure you meet product performance goals and deliver a responsive user experience.
Optimizing for multithreaded RTOS or Linux systems can be a challenge. When thread speeds are slow, it is often due to subtle factors in the source code. Visual tracking observability provides the complete picture and simplifies optimization.
Track Your Tasks
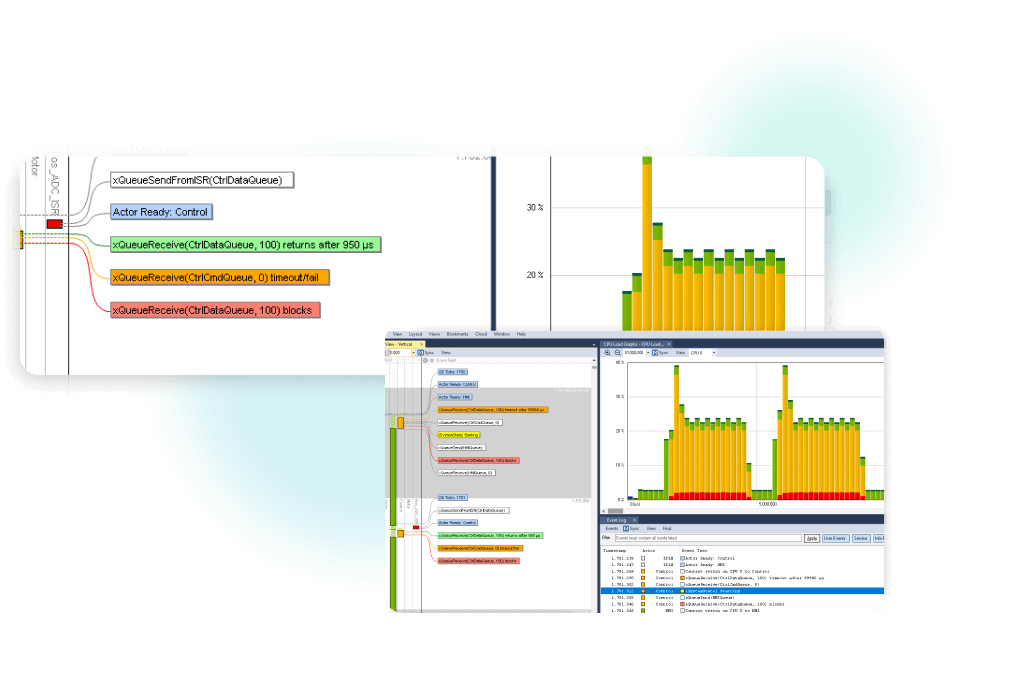
The Zephyr kernel provides multithreading, where each task has its own stack and scheduling priority, which is crucial for functional correctness and performance. Tracealyzer allows you to analyze the behavior and performance of different priority allocations, as well as task stack usage. If your stack is too small, errors may occur due to stack overflow. If they are too large, valuable RAM may be wasted, which could be needed in the application.
The tracking view displays task scheduling and calls to kernel API functions. This allows you to see the exact activation times of tasks, actual execution times, and sometimes the reasons for not executing as expected. You can also see an overview showing which tasks are consuming processor time, as indicated by the “CPU Load Graph.” Additionally, detailed statistics such as task execution time and response time are provided.
Track Zephyr Kernel API Calls
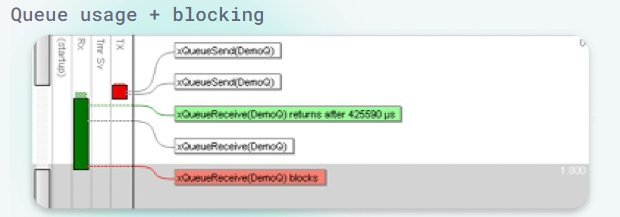
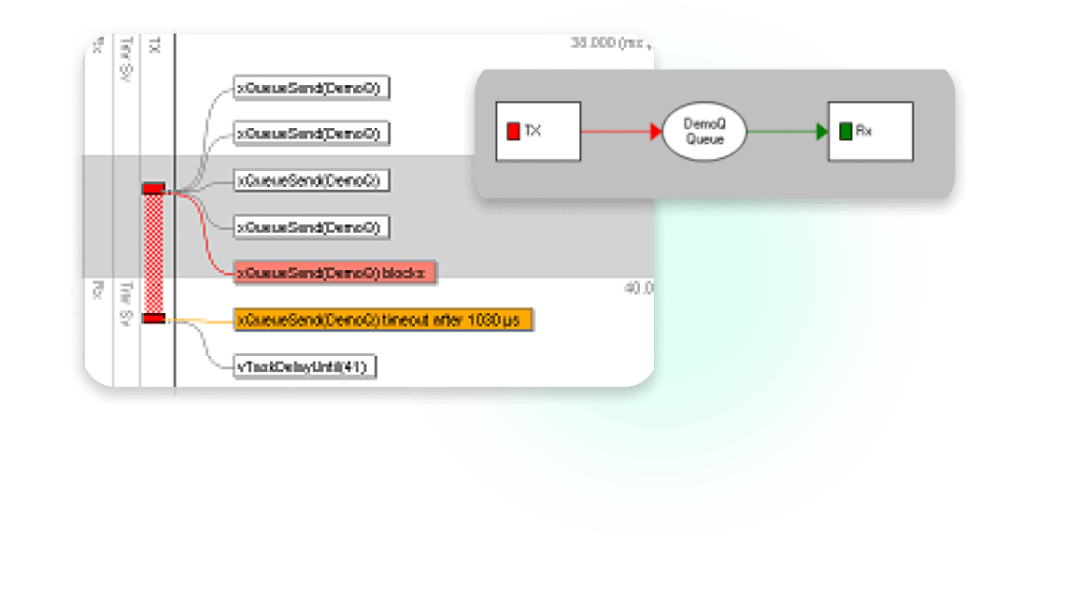
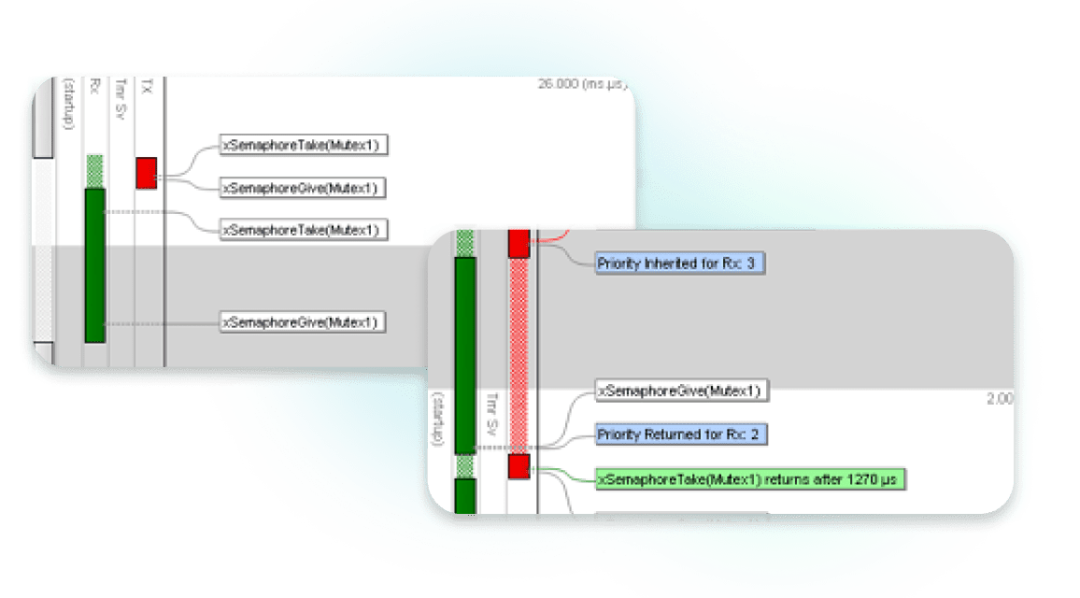
The Zephyr kernel provides numerous APIs for passing data between tasks and protecting shared resources, such as queues, semaphores, and mutexes. These API functions may block the execution of the calling task until another task performs a matching operation. Such API calls can create a network of dependencies between tasks that are not obvious in the source code. Tracealyzer can visualize task interactions, making it easier for developers to understand, debug, and optimize Zephyr applications. Below are some examples.
Application Logging
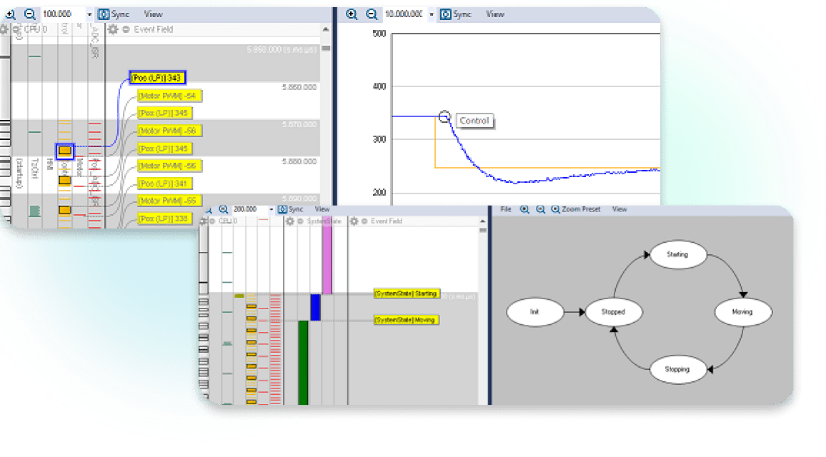
Tracealyzer provides advanced logging capabilities. Log custom events and data within application code and display them alongside kernel tracing in Tracealyzer, shown as graphical plots. This provides deeper observability into application code at runtime.
Unlike printf calls, Tracealyzer logging does not slow down the code by several milliseconds. Compared to printf on UART, the efficient logging functionality eliminates over 99% of logging overhead. This low-impact logging ensures you get the correct image in debugging without the probing effect caused by slow logging calls.
For example, state transitions can be logged and displayed in the “logic analyzer” view and state graphs. Results can be shown in the tracking view (as shown on the left) or summarized as state graphs (on the right), making it easy to discover erroneous behavior.
How the Software Runs
Using Tracealyzer does not require any specific hardware, just a suitable development board. You can capture snapshots of the latest activities from the tracking buffer in RAM, or stream data to your host using Ethernet or debugging probes like SEGGER J-Link, IAR I-jet, or Keil ULINK. This allows you to monitor your system over extended periods and capture any issues.
Tracealyzer for Zephyr relies on the Percepio TraceRecorder, which is available in the Zephyr repository under the Apache 2.0 license. Follow the getting started guide to integrate it into your project in just a few minutes.
Tracealyzer is suitable for most embedded processors (such as ARM chips), and Percepio provides plugins and integrations for common development tools, including Segger J-Link, GDB, STM32CubeIDE, Keil MDK, IAR, and Lauterbach.
BMR Tech represents Percepio Tracealyzer, with extensive knowledge and experience in RTOS analysis software and debugging tools. For inquiries, please contact [email protected].

Recommended Reading
The book “Embedded Real-Time Operating System – Application Development Based on STM32Cube, FreeRTOS, and Tracealyzer” is published by Tsinghua University Press, authored by Jim Cooling and translated by He Xiaoqing, Zhang Aihua, and Fu Yuanbin.
Available in major e-commerce platforms, the original text can be read to download the public courseware and experimental cases of this book.
 Follow our WeChat official account【BMR Tech】, reply “Join Group” to join the technical exchange group.
Product inquiries:
Beijing: 010-62975900
Shanghai: 021-62127690
Shenzhen: 0755-82977971