Follow the WeChat public account “ML_NLP” and set it as a “starred“, for heavy content delivered to you first!

Source | Zhihu
Author | Tom Cat X
Link | https://zhuanlan.zhihu.com/p/367122807
Editor | Machine Learning Algorithms and Natural Language Processing WeChat Public Account
This article is for academic sharing only. If there is any infringement, please contact us to delete the article.
Article Directory
-
Introduction
-
1. GPU Analysis Tools
-
2. Analysis of Parameters Related to GPU Analysis Tools
-
Conclusion
-
References
Introduction
Performance analysis requires the assistance of tools, especially for GPUs. Unlike CPUs, testing GPU performance can be more challenging. The author summarizes the usage of some tools to facilitate testing. In addition to performance testing, these tools can also be very useful for analyzing rendering-related issues. For developers involved in rendering, it is highly recommended to be very familiar with these tools. Currently, commonly used mobile GPU analysis tools include: Snapdragon Profiler for Qualcomm, Arm Mobile Studio for ARM Mali GPUs, Renderdoc, and Huawei Graphics Profiler specifically for Huawei phones, as well as XCode for Metal. This article mainly introduces the analysis of some tool parameters to help everyone understand how to use these tools (the article will continue to be improved).
1. GPU Analysis Tools
This article does not provide further introduction to the usage of the tools; readers can refer to the documentation and operate them personally. Note that when downloading these software, it is best to use a Google Gmail account for convenience.
Below are mobile GPU analysis tools:
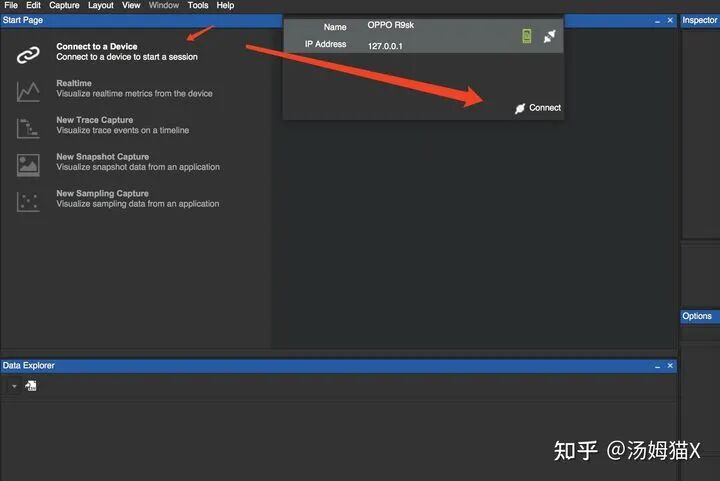
1) Snapdragon Profiler
https://link.zhihu.com/?target=https%3A//developer.qualcomm.com/software/snapdragon-profiler
After installation, simply open it, connect via USB, and it will connect automatically:
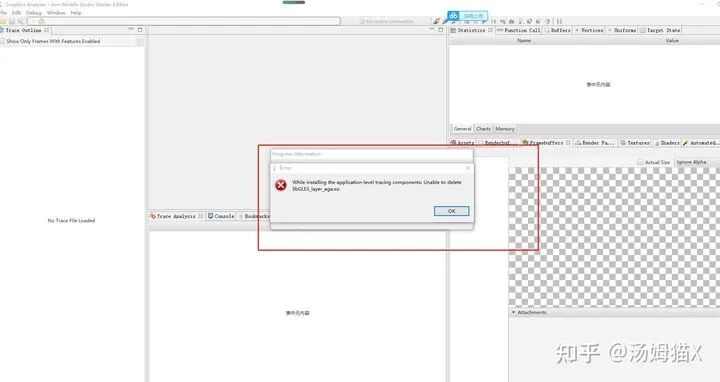
2) Arm Mobile Studio
https://link.zhihu.com/?target=https%3A//developer.arm.com/tools-and-software/graphics-and-gaming/arm-mobile-studio/downloads
Documentation:
https://link.zhihu.com/?target=https%3A//developer.arm.com/documentation/102469/0100/Configure-your-device
https://link.zhihu.com/?target=https%3A//developer.huawei.com/consumer/cn/forum/topic/0202336807101250292
Streamline Performance Analyzer:
https://link.zhihu.com/?target=https%3A//community.arm.com/cn/b/blog/posts/arm-mobile-studio-mali-gpu
If you encounter errors similar to the image below, you can try restarting your phone to resolve other errors.
3) Renderdoc
https://link.zhihu.com/?target=https%3A//renderdoc.org/
This tool is relatively stable for PC and Mali GPUs, but it is less stable for Qualcomm GPUs.
4) Huawei Graphics Profiler
https://link.zhihu.com/?target=https%3A//developer.huawei.com/consumer/cn/huawei-graphics-profiler
After downloading, there are FrameDebug and System Profiler. Frame Debug can achieve screenshot analysis similar to RenderDoc, but is more user-friendly for Huawei phones, and the data tends to be more accurate (this needs to be judged based on actual conditions, especially GPU During). The System Profiler can measure memory, fps, GPU Counter, etc., as well as bandwidth.
Note that this tool has specific Android version requirements:
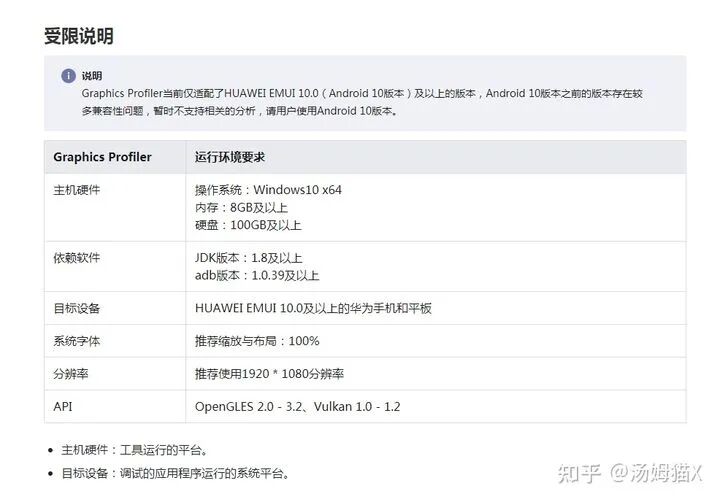
If you find version incompatibility, it is recommended to use Arm Mobile Studio.
4) Metal’s XCode
https://link.zhihu.com/?target=https%3A//developer.apple.com/documentation/metal/frame_capture_debugging_tools
https://www.jianshu.com/p/d6347f8aedd8
GPU analysis tools on PC:
https://zhuanlan.zhihu.com/p/76715274
1) Intel GPA
https://software.intel.com/content/www/us/en/develop/tools/graphics-performance-analyzers.html
2) Nvidia Nsight
https://link.zhihu.com/?target=https%3A//docs.nvidia.com/nsight-graphics/index.html
2. Analysis of Parameters Related to GPU Analysis Tools
1) Theoretical Knowledge
First, let’s understand some relevant theoretical knowledge to better understand the parameters of the analysis tools.
1. GPU Memory Architecture
Some GPU architectures are similar to CPUs and also have a multi-level cache structure: 128kb registers, L1 cache, L2 cache, GPU video memory, and system memory.

According to the memory in the GPU shown in the figure:
-
Each thread has its own private local memory (Local Memory) and registers (Register).
-
Each thread block contains shared memory (Shared Memory), which can be shared among all threads in the block, and its lifecycle is consistent with that of the thread block.
-
All threads can access global memory (Global Memory).
-
Read-only memory blocks: constant memory (Constant Memory) and texture memory (Texture Memory).
-
Each SM has its own L1 cache, and the SM connects to Global Memory through L2 cache.
Access speeds decrease from registers to system memory:
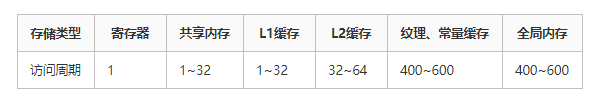
Conclusion: Registers -> Caches -> Shared Memory -> Global Memory (Local Memory).
Next, let’s understand some important parameters:
Registers
Registers are the fastest access space. How are register variables used in the program? When we declare a variable in a kernel function without any modifiers, that variable is a register variable. If a constant-length array is defined in the kernel function, it will also be allocated to Registers; register variables are private to each thread, and once the thread’s kernel function execution is complete, the register variable can no longer be accessed.
Registers are a relatively scarce resource with limited space. In the Fermi architecture, each thread can have a maximum of 63 registers, while in the Kepler architecture, each thread can have a maximum of 255 registers. If a thread uses fewer registers, there will be more thread blocks in the SM, and the GPU’s parallel computing speed will be faster.
If a thread has too many variables that exceed the space of Registers, then the registers will overflow, requiring other memory (Local Memory) for storage, which will slow down the program’s execution.
Therefore, in the program, for variables that are used in loops, we can place them in registers; at the same time, we should try to minimize the number of registers used so that the number of thread blocks can increase, and the overall program execution speed can be faster.
Local Memory
Local Memory is also private to each thread. Variables that meet the conditions for storage in registers but cannot be allocated to the register space in the kernel function will be stored in Local Memory. The types of variables that may be stored in Local Memory include:
-
Locally indexed arrays with unknown indices.
-
Large local arrays or structures.
-
Any variables that do not meet the kernel function’s register allocation conditions.
Shared Memory
Each SM has shared memory, defined using the __shared__ keyword (CUDA keywords generally have two underscores). Shared memory is declared in the kernel function and has a lifecycle consistent with the thread block.
It is also important to note that excessive use of shared memory in the SM will reduce the number of active threads on the SM, which will affect the program’s execution efficiency.
Data sharing will inevitably lead to competition among threads, which can be avoided through synchronization statements. The synchronization statement is:
void __syncthreads();All threads must reach this point before continuing execution; frequent calls to __syncthreads() can also affect the execution efficiency of the kernel function.
Shared memory is divided into different banks. We know that there are 32 SMs in a warp, and in older GPUs, 16 banks can be accessed simultaneously, meaning that a single instruction can allow half a warp to access 16 banks simultaneously, greatly improving GPU efficiency. In newer GPUs, a warp of 32 SMs can access 32 banks simultaneously, doubling the efficiency.
Constant Memory
Constant memory resides in device memory, and each SM has its own dedicated constant memory space, declared using the __constant__ keyword. It can be used to declare constants such as filter coefficients.
Constant memory exists outside the kernel function, meaning it is declared outside the kernel function, and it is not on-chip. The access speed of constant content is also fast because each SM has dedicated constant memory cache that reads constants from off-chip into the cache; it is visible to all kernel functions and cannot be modified after initialization on the host side.
Texture Memory
Texture memory is not used much; it is designed for GPU display, and texture memory also exists off-chip.
Global Memory
Global memory, commonly referred to as video memory, is the space of GDDR. Variables in global memory have the same lifecycle as the application as long as they are not destroyed.
When accessing global memory, alignment is required, meaning that a specified size (32, 64, 128) multiple bytes of memory must be read at once. Data alignment means that transfer efficiency decreases; for example, if we want to read 33 bytes, we actually need to read 64 bytes of space.
2. GPU Stuttering?
This section briefly introduces why achieving 60fps requires the GPU to also reach 60fps, even though the GPU and CPU compute independently. Let’s first look at the workflow of the CPU and GPU in Android.
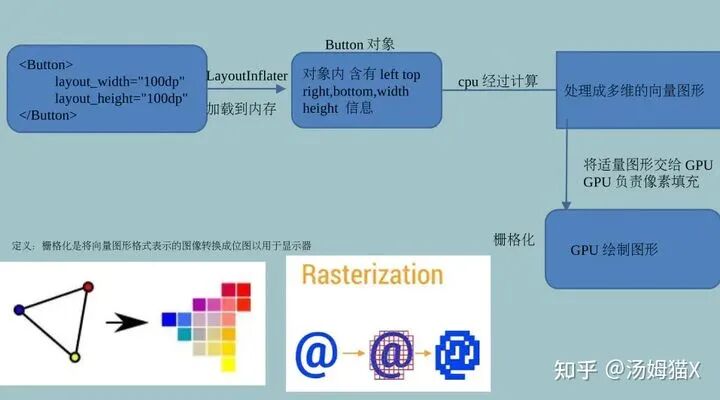
The Android system sends out a VSYNC signal every 16.666ms (1000ms/60=16.6666ms) to render the UI. If each rendering is successful, it can achieve the smooth 60fps required for the display. To achieve 60fps, this means that most operations for rendering calculations must be completed within 16.666ms.

3. Multithreaded Rendering
This is on the CPU side and is introduced to help readers better understand rendering-related content and analyze performance more effectively.
This introduction is also to facilitate understanding of the principles when analyzing whether the CPU or GPU is stuttering. Generally, graphics rendering is completed by calling graphics APIs in the main thread, and the overhead of graphics API operations is often a bottleneck for the CPU. The rendering thread can share the pressure of graphics API operations from the main thread, reducing the pressure on the main thread and improving frame rates. Especially for GLES graphics API overhead, it is relatively high. Let’s look at a set of data:
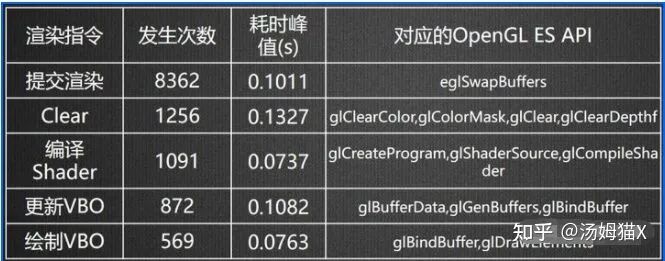
In particular, glClearColor and glSwapBuffer consume a lot of resources. To further verify this, you can use graphics analysis software for screenshot analysis, where you can generally see data such as SetRenderTarget, glClearColor, etc., which usually consume a significant amount of resources.

Therefore, when writing rendering pipeline-related code, we need to minimize calls to graphics APIs like SetRenderTarget. If readers are interested, they can also test Vulkan and Metal graphics APIs, which are relatively 30% more efficient than GLES (depending on the device). (This can be further verified by readers).
There are many ways to implement multithreaded rendering, and the general framework is:
Microsoft’s DirectX11 has architecturally supported true multithreaded rendering, as shown in the figure:
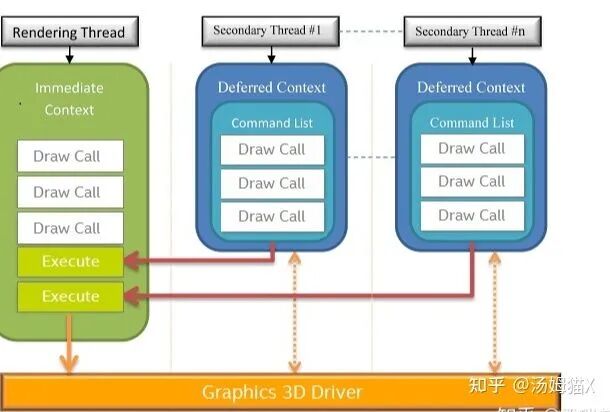
Note: Multithreaded rendering refers to separating rendering into its own thread. In theory, multiple threads can be opened to execute rendering commands, but OpenGL does not support multiple threads operating on the same context simultaneously.
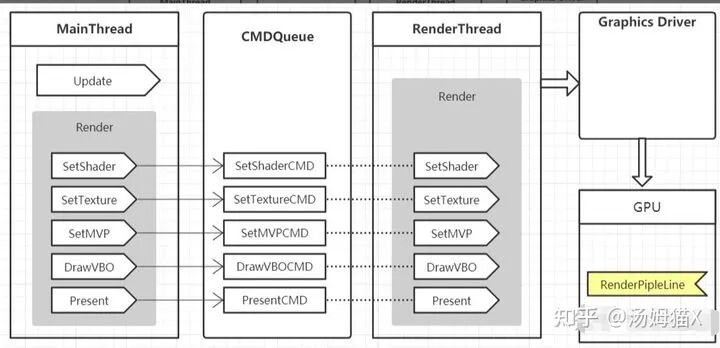
Taking Unity’s multithreading as an example, we can look at Unity’s multithreaded rendering process:
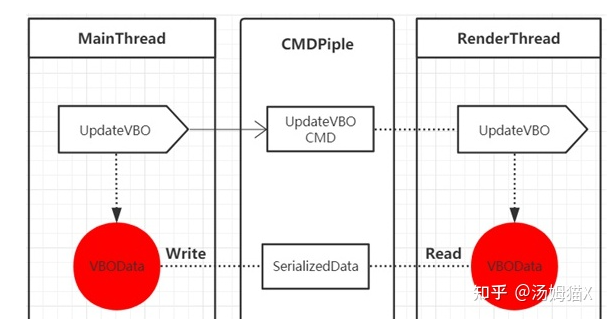
-
The pipeline can be implemented using a circular buffer, where the main thread serializes rendering commands into binary data and continuously writes to the buffer. When the buffer is full, the main thread is blocked; the rendering thread continuously reads data from the buffer and deserializes it into rendering commands. When there is no data in the buffer, the rendering thread is blocked.
-
The advantage of using a circular buffer is that reading and writing to the buffer only requires moving the read and write points. Under the premise of having only one producer and consumer, reading and writing to the circular buffer can be done without locks (the read and write points are represented by int32, and if reading and writing a 32-bit int is an atomic operation, then it only requires using memory barriers to ensure that the corresponding memory is available when the read and write points change).
-
The advantage of using a pipeline is that there is no need to consider thread safety for resource allocation and release, as the same resource has different instances in the main thread and rendering thread, and both threads maintain their own resource lifecycles.
-
The disadvantage of using a pipeline is that it is data-oriented, requiring all rendering commands to be serializable, so it cannot adopt overly abstract implementation methods. For example, a highly abstract rendering command is passing a camera, scene, and renderTarget; implementing this level of abstraction using a pipeline can be cumbersome because it requires the camera, scene, and renderTarget to be serializable.
-
Another disadvantage of using a pipeline is that to read and write large-capacity resources, a relatively large memory block needs to be pre-allocated, and compared to directly passing resource pointers, reading will take relatively longer.
Now let’s look at the synchronization strategy between the main thread and the rendering thread:

-
At the start of each frame’s rendering, the main thread submits a BeginRendering command, and at the end of each frame’s rendering, the main thread submits a Present command.
-
When submitting the BeginRendering command, if the rendering thread’s previous frame rendering command has not completed, the main thread will block and wait for the rendering thread to finish executing before starting to submit the rendering command for this frame.
It can be seen that when the rendering thread takes a long time, the main thread is stuck waiting for the present, causing frame rates to drop. Generally, when encountering such issues, it is necessary to reduce the rendering pressure on the CPU side, such as reducing draw calls and merging some post-processing.
2) Analyzing Texture Data
Observe texture bandwidth, as it indicates how much texture data is input to the GPU in each frame, allowing for quick identification of potential performance issues. A good rule of thumb for texture bandwidth is to ensure that the average texture read bandwidth does not exceed 1GB/s, and the peak is far below 5GB/s.
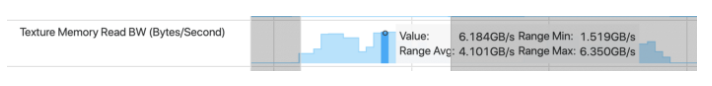
For example, our game consumes a large amount of texture bandwidth, with an average bandwidth reaching 4GB/s, and at the end of the frame, the peak has exceeded 6GB/s.
It is understandable that post-processing requires high texture bandwidth, and you may allocate some bandwidth for special effects processing during the rendering post-stage, such as achieving bloom and tone mapping. However, if your game has a very high peak texture read bandwidth, then potential performance issues need to be addressed.
For very high texture bandwidth consumption, further analysis is required. To analyze potential texture bandwidth issues, I will first check the texture cache situation. Attention should be paid to the stall ratio of textures and the miss ratio of L1 and L2 caches. When L1 cache misses the required texture data, requests will turn to L2 cache and then to system memory. Each step increases latency and power consumption. The average miss ratio of L1 should not exceed 10%, and the peak miss ratio should not exceed 50%.

This also explains why we need to enable Mipmap, as enabling mipmap can improve the texture cache hit rate. When L1 cache misses the required texture data, requests will turn to L2 cache and then to system memory, and the later it goes, the worse the performance.
When mipmap is set to 0, it means the GPU often accesses the top-level mipmap texture data, which is the largest piece in the mipmap chain or textures that have not been mipmap processed. Accessing unprocessed textures during GUI rendering or post-processing is acceptable. However, in other scenarios, such operations can lead to significant performance losses and are a reason for poor data caching effects. Accessing textures can consume a lot of system bandwidth, potentially causing delays, shortening battery life, and even causing overheating issues that lead to throttling and further performance degradation.
3) Basic Knowledge Related to GPU
To better understand the use of GPU analysis tools, it is essential to have a grasp of basic theoretical knowledge related to GPUs. Here are a few links, and I plan to continue releasing articles related to GPU basics in the future.
https://www.cnblogs.com/timlly/p/11471507.html
https://zhuanlan.zhihu.com/p/347001411
https://link.zhihu.com/?target=https%3A//developer.nvidia.com/content/life-triangle-nvidias-logical-pipeline
For GPUs, there are basic concepts and components that are common, which are also helpful for using GPU analysis tools:
-
TPC (Texture Processing Cluster)
-
Thread
-
SM, SMX, SMM Streaming Multiprocessors
-
Warp Schedulers: This module is responsible for warp scheduling, with a warp consisting of 32 threads. The warp scheduler’s instructions are sent to the core for execution via Dispatch Units.
-
SP (Streaming Processor)
-
Core (Compute Core)
-
ALU (Arithmetic Logic Unit)
-
FPU (Floating Point Unit)
-
SFU (Special Function Units) execute special mathematical operations (sin, cos, log, etc.)
-
ROP (Render Output Unit), a ROP contains many ROP units, which handle depth testing and framebuffer blending. Depth and color settings must be atomic operations; otherwise, conflicts and errors may occur at the same pixel point for two different triangles.
-
Load/Store Unit module to load and store data
-
L1 Cache
-
L2 Cache
-
Register File (Registers, such as Uniform data)
-
GPC (Graphics Processing Cluster), each GPC has multiple SMs (SMX, SMM) and a rasterization engine (Raster Engine)
4) Viewing GPU FLOPS or Clock or Fillrate, etc.
https://link.zhihu.com/?target=https%3A//gflops.surge.sh/
https://link.zhihu.com/?target=https%3A//en.wikipedia.org/wiki/Mali_%28GPU%29
https://link.zhihu.com/?target=https%3A//en.wikipedia.org/wiki/Adreno
References
https://zhuanlan.zhihu.com/p/350390554
https://zhuanlan.zhihu.com/p/158548901
https://www.jianshu.com/p/914738d25a5b
https://zhuanlan.zhihu.com/p/44116722
https://www.cnblogs.com/timlly/p/11471507.html

Recommended Reading:
Overview of Causal Inference and Introduction to Basic Methods (Part 1)
Overview of Causal Inference and Introduction to Basic Methods (Part 2)
Research Progress on Multi-label Text Classification
Click the card below to follow the public account “Machine Learning Algorithms and Natural Language Processing” for more information: