The printf function is indispensable during microcontroller debugging, allowing developers to intuitively and conveniently obtain the current running status of the program. However, in chips like STM32, to achieve printf functionality, UART must be utilized. Is there a way to implement printing functionality solely with JLink? The answer is yes. ARM has adopted a new debugging mechanism in the Cortex-M series—ITM, which allows printf functionality to be easily implemented via JLink, thus enabling debugging with just one connection!…………
1. The principle of this tutorial is obtained from the ARM official website and has been further tested and refined by myself to ensure higher reliability.
2. This method has been tested on the STM32F103 chip, using JLink V8 and JLink ARM-OB STM32 as simulation tools, both of which work normally. Theoretically, this method is applicable to all Cortex-M core ICs; F407 can also use the same method, tested with ST-LINK.
3. This method is limited to use in a Debug environment and cannot completely replace UART (for instance, when communication with a host computer is required), but it is definitely sufficient for general debugging processes.
4. My skills are limited, and I cannot cover everything in the tutorial; if there are any oversights, I hope everyone will provide guidance.
SW mode must be used, and SWO must be connected! Many simplified versions of JLink only retain GND, SWC, and SWD. If you want to use this function, you must extend the SWO (which is TDO in JTAG mode) pin. The pin distribution and corresponding JTAG interface are shown in the figure below:
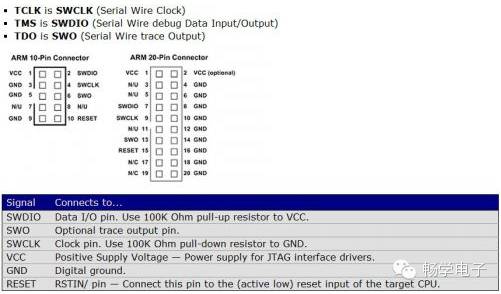
As can be seen, to achieve the printf function in Debug mode, JLink requires at least four connection lines, but compared to a serial port, the hardware overhead is significantly smaller! See the original text for code.
Note: Since I do not have the IAR environment installed, I can only provide configuration under MDK. I will try to list and explain the relevant configuration items in detail so that everyone can complete it in IAR.
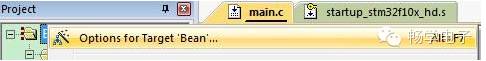
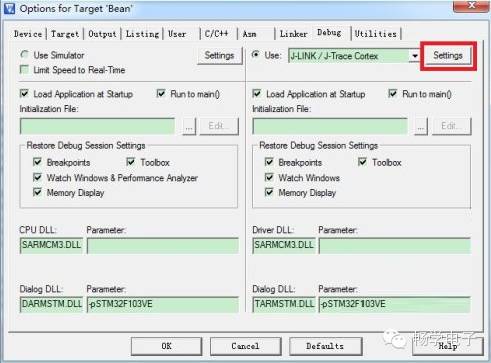
1. Open project configuration.
2. In the Debug tab, select the debugger as JLink and open Settings.
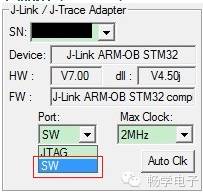
3. In the Port dropdown menu, select SW mode.
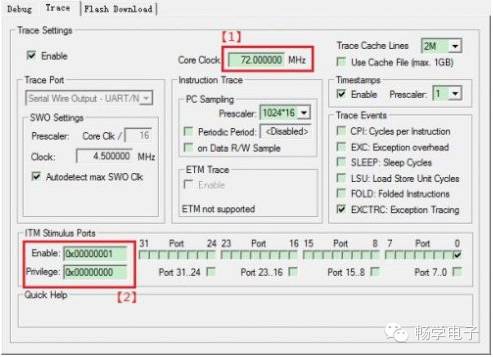
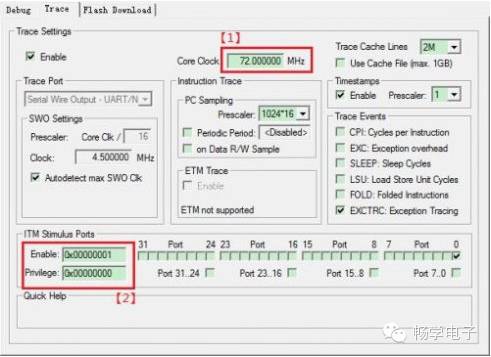
4. Switch to the Trace tab, enter the main frequency of the current chip in CoreClock (this data may vary based on different ICs and configurations, so please pay attention), and configure ITM Stimulus Ports as shown in the figure below, so that ITM Port0 can capture information:
5. Enter Debug mode and select View — Serial Windows – Debug (printf) Viewer from the menu. At this point, a corresponding window will appear in the lower right corner.
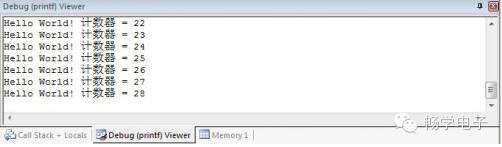
6. Run the program, and you will see the printed information as shown in the first image of the text!
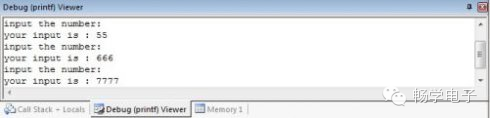
Update on scanf functionality, there are still defects, please help test and improve.
The code is taken from the internet and has been tested to meet basic needs.
Current defects:
1. The input characters do not display in real-time.
2. The first execution defaults to inputting a ‘0’.
See the original text for code.
The running effect is as follows: