Follow andstar the public accountso you won’t miss great content

Source: STM32
Many embedded friends must have used STMStudio to monitor variables in real-time. Compared to STMStudio, STM32CubeMonitor not only provides variable monitoring functionality but also offers a rich set of components to build various styles of graphical interfaces. Additionally, many free third-party components allow for flexible function expansion. Furthermore, STM32CubeMonitor supports remote monitoring.
I’ve previously organized the usage methods related to STMStudio and STM32CubeMonitor for everyone:
Explanation of STM Studio Debugging and Diagnostic Tools
STM32CubeMonitor Introduction, Download, Installation, and Usage Tutorial
Many friends may not be familiar with this tool, so today I will share it again to help everyone further understand the newly launched STM32CubeMonitor.
Review of the STM32Cube Family
The STM32Cube series of software development tools is a large family that provides all the necessary functions for the entire software development process, from MCU configuration, code generation, compilation, and debugging to program burning and monitoring. Each tool has its own responsibilities, with overlapping functionalities, working together to build a complete development platform for STM32 developers.
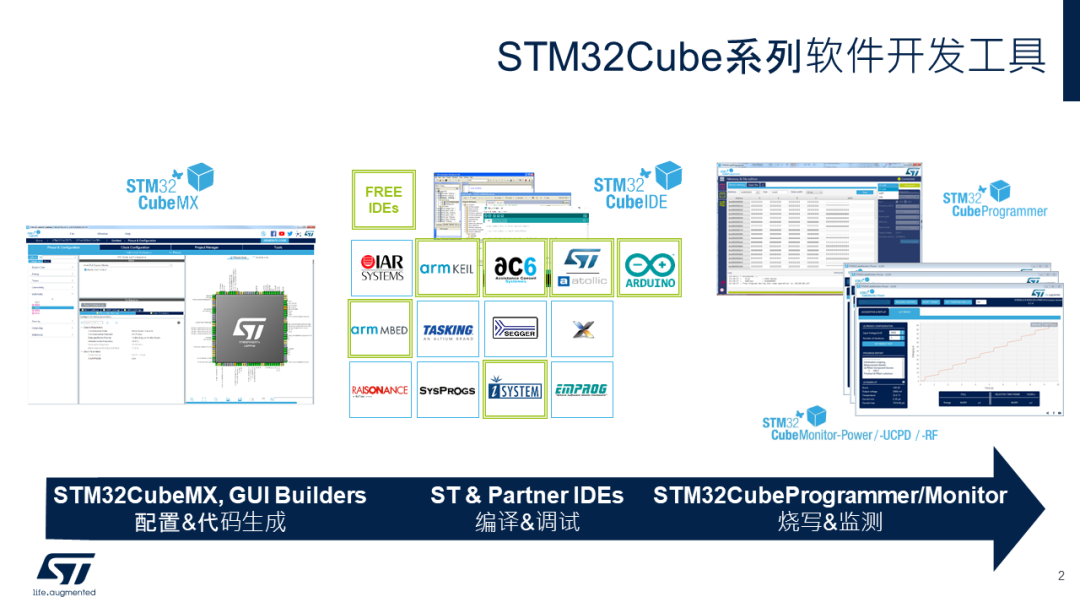
▲ STM32Cube Series Software Development Tools Family
Among them, STM32CubeMX provides a graphical configuration interface to help developers quickly create a new project (supporting STM32CubeIDE, IAR, KEIL, etc.).
STM32CubeIDE is based on Eclipse and the GCC toolchain, providing code editing, compilation, and debugging functions.
STM32CubeProgrammer is the STM32 programming tool that can erase and program on-chip flash and external memory, supporting ST-LINK debugging interface and UART/USBDFU bootloader interface.
There are also graphical power measurement software STM32CubeMonitor-Power, performance testing software STM32CubeMonitor-RF, etc.
▲ New STM32CubeMonitor
The newly launched STM32CubeMonitor will become another milestone in the engineer’s development journey. The STM32CubeMonitor variable monitoring and visualization tool supports connecting to the target MCU through the ST-LINK’s SWD or JTAG interface, allowing the reading of variable values without interrupting the program’s full-speed operation. It is very suitable for situations that require debugging while the program runs at full speed, complementing the traditional method of debugging by setting breakpoints. In addition to variable detection, STM32CubeMonitor can also serve as a tool for developing IoT applications on PC, simplifying the development process.
Rich Graphical Interface
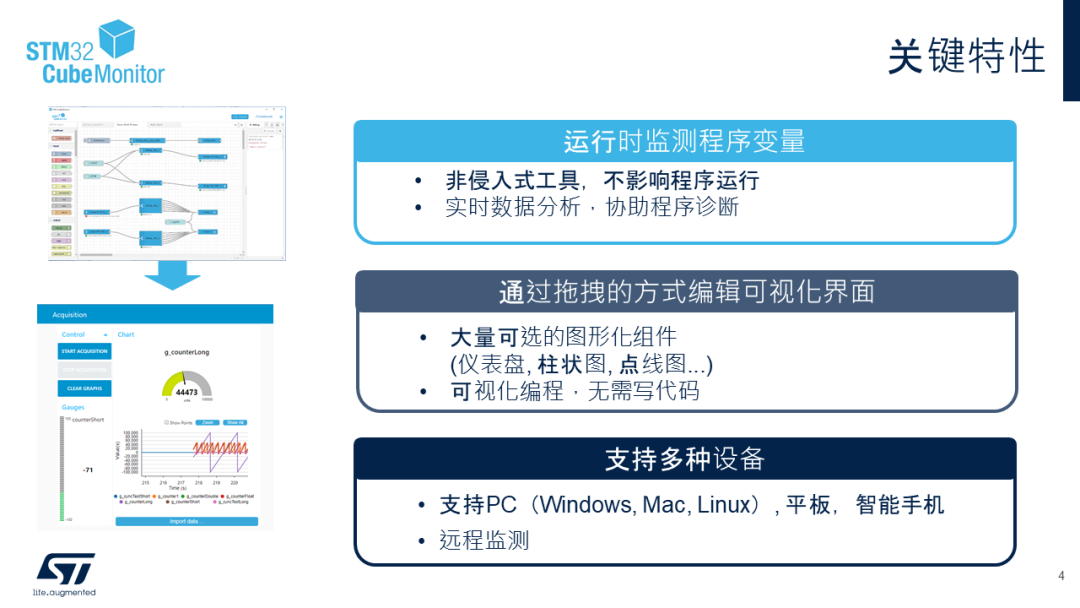
▲ Key Features of STM32CubeMonitor
STM32CubeMonitor can detect program variables in a non-intrusive way (Direct mode) and analyze the collected data in real-time to assist in program diagnosis. In addition to Direct mode, the Snapshot mode allows for more precise sampling by adding specific sampling code to the application. Variables can be imported based on the executable file or manually added based on variable addresses, and various post-processing operations can be performed on the collected variables, including setting sampling trigger conditions.
STM32CubeMonitor is developed based on NODE-RED and has a rich set of graphical development components, enabling the creation of flexible and diverse graphical interfaces. In the software’s graphical flow editor, users can simply drag and configure different nodes with a mouse to create custom dashboards and quickly add instruments, bar charts, line charts, and other widgets without programming.
Two Working Modes
STM32CubeMonitor has two working modes: Design Mode and Dashboard Mode.
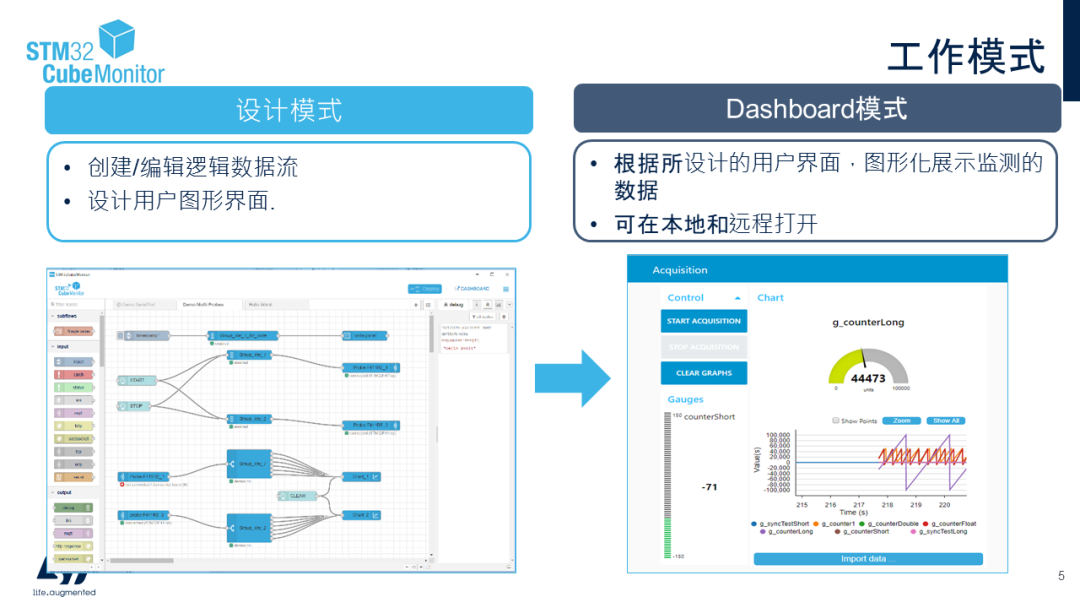
▲ STM32CubeMonitor Working Modes
Design mode is the editing mode, allowing for the creation of new monitoring user interfaces for specific applications. When STM32CubeMonitor is opened, it defaults to this mode. In Design mode, different nodes can be dragged to create or edit different logical data flows (Flow) to achieve desired functionalities. For example, displaying the variables to be monitored in real-time using a line chart, or controlling the state of a GPIO port with a button, etc. In Design mode, you can view the usage instructions for the currently selected node and debugging information about the program’s operation.
Once all nodes are edited and deployed, you can enter Dashboard mode by clicking the DASHBOARD button. In Dashboard mode, you can see the results of the “flow” edited in Design mode and view the previously designed interface to monitor or control variable values, achieving vivid data demonstration and on-site testing.
Flexible Expandable Features
NODE-RED, as an open-source visual interface development tool, has an active developer community with many new nodes developed by various developers to expand functionality. STMCubeMonitor supports importing these third-party nodes for continuous feature expansion.
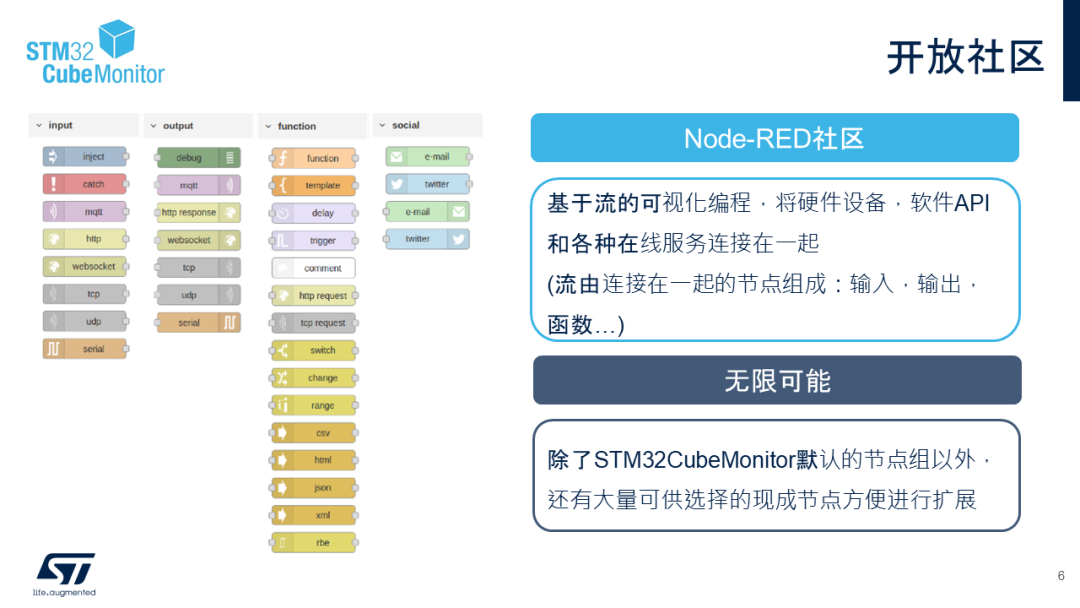
▲ STM32CubeMonitor Open Community
With the help of Node-RED and the ST community, developers can share and learn development experiences with each other. The Node-RED interface is very versatile, allowing for easy utilization of common network protocols. With modules for sending alerts via email or using MQTT modules to push data to cloud platforms, developers can do more than traditional monitoring. For example, data collected from STM32 development boards can be uploaded to the cloud or alarm messages can be sent via email, etc., using STM32CubeMonitor running on a PC.
Remote Monitoring Anytime, Anywhere
Since STM32CubeMonitor provides a web-based programming environment, it can be opened on any computer or mobile device’s browser.
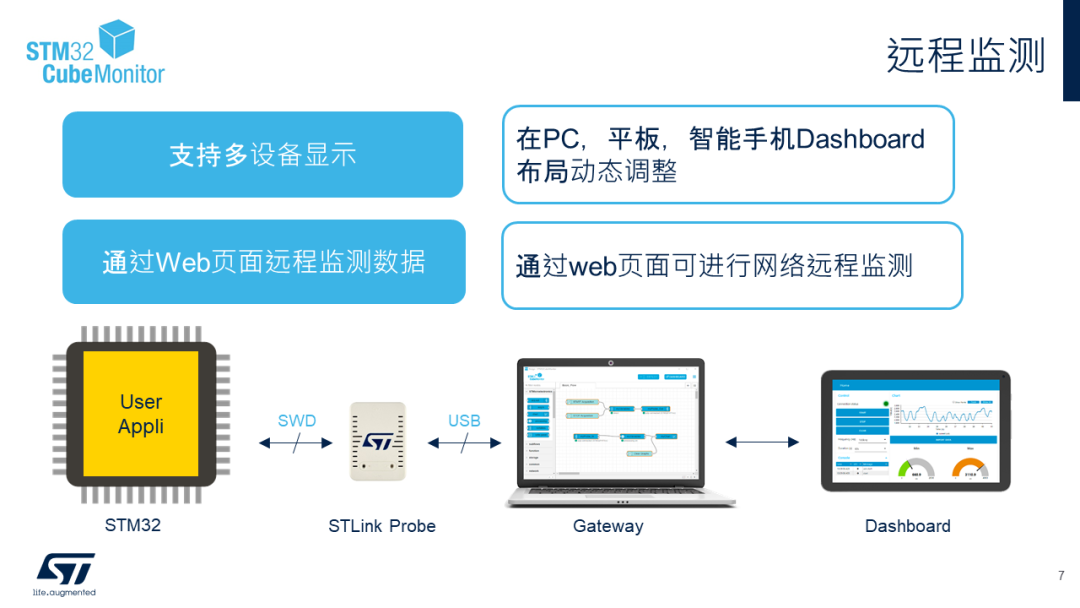
▲ Remote Monitoring via STM32CubeMonitor
By connecting the STM32 development board to the local computer via ST-LINK, STM32CubeMonitor can run on the local computer (Host PC) and can also be accessed from other computers, tablets, or phones through a browser by entering the host PC’s IP address (port 1880) to open the STM32CubeMonitor interface for editing or viewing the Dashboard (requires being on the same local area network).
For more related content, please refer to the official information:
https://www.st.com/en/development-tools/stm32cubemonitor.html
Disclaimer:This article’s material comes from ST, and the copyright belongs to the original author. If there are any copyright issues, please contact me for removal.Recommended Reading:Why the Default Page Size of Linux Systems is 4KBHow to Rewrite C++ Source Code into C CodeRelationship between PCB Layer Design and Electromagnetic CompatibilityFollowthe WeChat public account ‘strongerHuang’, reply ‘1024’ to see more content, and reply ‘Join Group’ to join the technical exchange group according to the rules.
Long pressto go to the public account included in the imageand follow