In today’s digital wave, Java applications have become the cornerstone of core business for many enterprises, while Linux, with its stability, open-source nature, and powerful customization capabilities, has become the preferred platform for deploying Java applications. The performance bottlenecks of Java applications are often closely related to the resource management of the Linux system. This article focuses on CPU performance optimization for Java applications in a Linux environment, introducing the meaning and methods for viewing CPU performance metrics, constructing a complete diagnostic process from metric collection, process and thread localization to code tracing, and explaining problem analysis and targeted solutions in different scenarios through real cases.
1
CPU Performance Metrics
The CPU (Central Processing Unit) is the core hardware of a computer. Understanding the performance metrics of the CPU helps in comparing and analyzing whether the current system is functioning normally. The CPU has several important performance metrics:
-
Clock Speed: Measured in GHz, it represents the number of clock cycles per second (3GHz means 3 billion cycles/second). The higher the clock speed, the faster the single-core processing speed.
-
Core Count: The number of independent processing units within the CPU (e.g., 4 cores, 8 cores). Multi-core can process multiple tasks in parallel (e.g., running a Java program and a browser simultaneously).
-
Thread Count: The logical cores virtualized through hyper-threading technology (e.g., 8 cores with 16 threads) can improve the utilization of a single core (suitable for multi-task switching scenarios).
-
Cache: High-speed storage located between the CPU and memory, divided into three levels (L1, L2, L3) from fastest to slowest. L1 cache is independently owned by each core and is the fastest; L2 cache can be independent or shared by each core; L3 cache is shared among multiple cores.
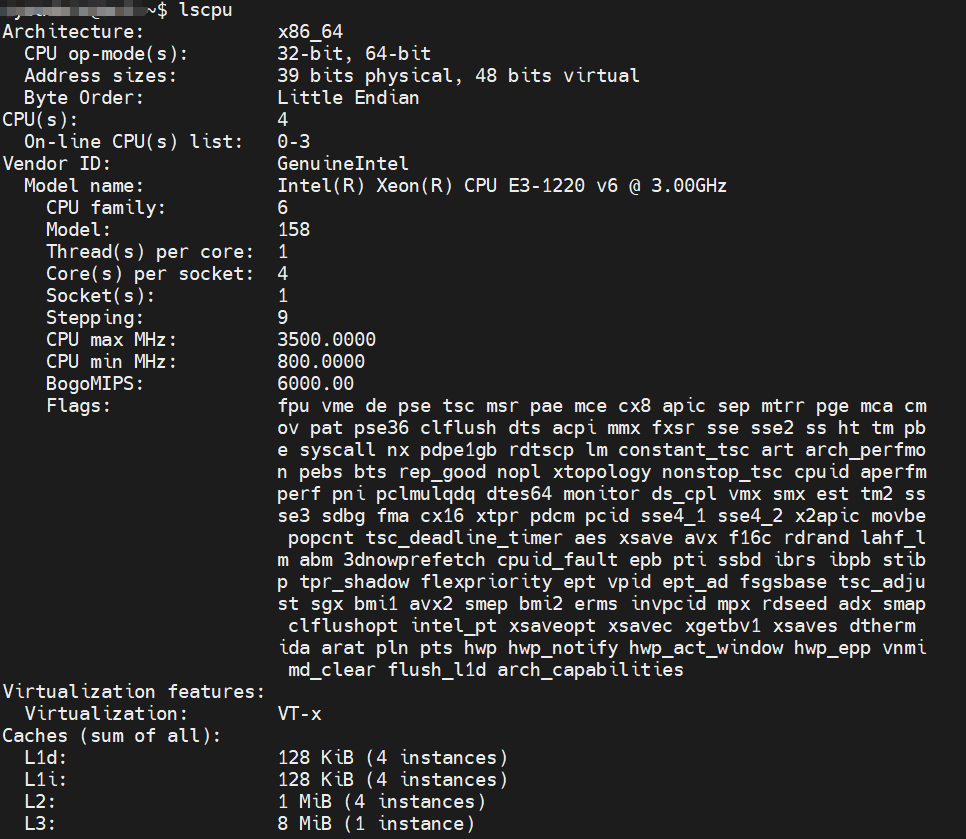
Generally speaking, the higher the CPU’s clock speed, the more cores and threads it has, and the larger the cache, the better the performance. In a Linux system, you can use the lscpu command to query CPU-related information.
2
CPU Usage Rate
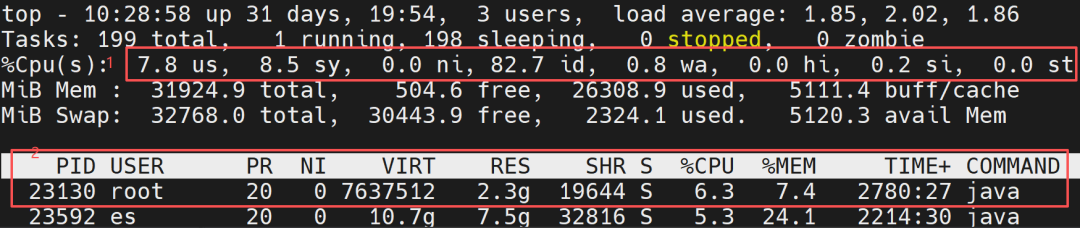
The CPU usage rate is one of the core indicators for measuring system load, reflecting the busyness of the CPU. In a Linux system, you can use the top command to view it. The specific metric explanations are as follows:
1
Overall CPU Usage Rate
-
%us (user): The proportion of user-mode processes (applications).
-
%sy (system): The proportion of kernel mode (system calls, process scheduling, etc.).
-
%id (idle): The idle proportion (the higher the value, the more idle the CPU).
-
%wa (iowait): The proportion waiting for IO operations (e.g., disk, network); a high value may indicate an IO bottleneck.
-
%hi (hardirq): The proportion of hard interrupts (hardware-triggered, e.g., keyboard, network card).
-
%si (softirq): The proportion of soft interrupts (software-triggered, e.g., network packet processing).
-
%st (steal): The proportion of CPU “stolen” by the host in a virtualized environment.
2
CPU Usage Rate for Each Process
-
PID: Process ID.
-
USER: Process owner.
-
PR: Process priority (the smaller the number, the higher the priority).
-
S: Process state (R for running, S for sleeping, Z for zombie, T for stopped, D for uninterruptible sleep (usually waiting for IO)).
-
%CPU: The CPU usage rate of the process (100% for a single core, 800% for 8 cores).
-
%MEM: The memory usage rate of the process.
-
COMMAND: The command that started the process (press ‘c’ to display the full command path).
3
Analysis Methods
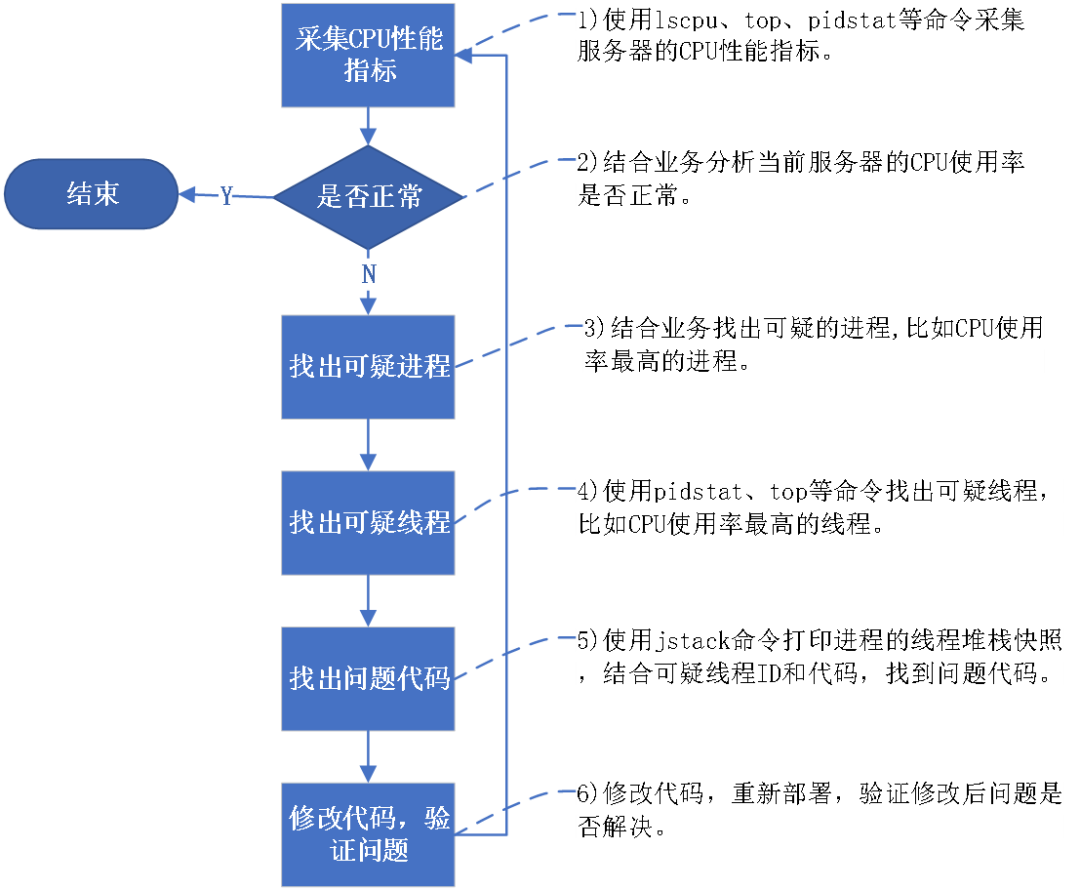
The following is a flowchart for analyzing CPU performance issues:
4
Case Analysis
Below, we will introduce how to diagnose and solve problems using specific cases. The following cases are all based on real scenarios, but for code authorization and security reasons, simplified code will be used to simulate these cases.
Case 1
Frequent Garbage Collection in JVM Leading to High User Mode Usage
Case Overview
The producer places messages in a queue, and the consumer consumes messages from the queue. The producer’s production speed is slightly higher than the consumer’s consumption speed, and the queue size and JVM heap memory settings are unreasonable, resulting in a delicate state where the JVM frequently performs full GC without immediately causing memory overflow.
Case Simulation
1 Simulation Code
// Log entity class (control size appropriately to avoid overly large single objects)static class LogEntry { private final String id; private final String level; private final String message; private final long timestamp; // Simplified fields to control memory usage of a single object private final String source; public LogEntry(String id, String level, String message, String source){ this.id = id; this.level = level; this.message = message; this.source = source; this.timestamp = System.currentTimeMillis(); }}// Log producer: fast speed but controlled by memory thresholdstatic class LogProducer implements Runnable { private int counter = 0; private final String producerName; public LogProducer(String name) { this.producerName = name; } @Override public void run() { while (!Thread.currentThread().isInterrupted()) { try { // Generate log object (medium frequency to avoid excessive memory impact) String id = producerName + "-" + counter++; String level = counter % 5 == 0 ? "ERROR" : "INFO"; String message = "Log " + counter + " from " + producerName; String source = "Module-" + (counter % 5); LogEntry log = new LogEntry(id, level, message, source); // Block waiting when the queue is full (instead of discarding or infinitely creating objects) logQueue.put(log); // put will block until there is space in the queue to prevent object accumulation // Production speed: generate 1 log every 2ms (faster than consumption, but the gap is controllable) Thread.sleep(2); } catch (InterruptedException e) { Thread.currentThread().interrupt(); break; } } }}// Log consumer: slightly slower than production, but not much differencestatic class LogConsumer implements Runnable { private final String consumerName; public LogConsumer(String name){ this.consumerName = name; } @Override public void run(){ while (!Thread.currentThread().isInterrupted()) { try { // Poll log from the queue (timeout wait to avoid spinning) LogEntry log = logQueue.poll(100, TimeUnit.MILLISECONDS); if (log != null) { // Simulate processing time (consumption speed slightly slower than production) processLog(log); // Consumption interval: process 1 log every 3ms (1ms slower than production speed, the gap is controllable) Thread.sleep(3); } } catch (InterruptedException e) { Thread.currentThread().interrupt(); break; } } } // Simple log processing, consuming a small amount of CPU private void processLog(LogEntry log){ String formattedTime = sdf.format(new Date(log.timestamp)); // Lightweight computation to avoid the consumer becoming a new bottleneck int hash = log.id.hashCode() ^ log.source.hashCode(); }}public class ControlledLogProcessing { // Queue capacity is moderate to avoid excessive accumulation private static final int QUEUE_CAPACITY = 48000; private static final BlockingQueue<LogEntry> logQueue = new ArrayBlockingQueue<>(QUEUE_CAPACITY); private static final SimpleDateFormat sdf = new SimpleDateFormat("yyyy-MM-dd HH:mm:ss"); // Memory monitoring threshold, if exceeded, temporarily slow down production private static final double MEMORY_THRESHOLD = 0.9; public static void main(String[] args){ System.out.println("Controlled log processing simulation started (frequent GC but no OOM)"); System.out.println("Recommended JVM parameters: -Xms512m -Xmx512m -XX:+PrintGC to observe GC situation"); // Number of producers: more than the number of CPU cores to ensure production pressure int producerCount = Runtime.getRuntime().availableProcessors() + 10; // Number of consumers: less than producers to maintain production surplus int consumerCount = Runtime.getRuntime().availableProcessors(); // Start producers for (int i = 0; i < producerCount; i++) { new Thread(new LogProducer("Producer-" + i), "Producer-" + i).start(); } // Start consumers for (int i = 0; i < consumerCount; i++) { new Thread(new LogConsumer("Consumer-" + i), "Consumer-" + i).start(); } System.out.printf("Started %d producers and %d consumers%n", producerCount, consumerCount); System.out.println("Use jstat -gc <pid> 1000 to monitor GC frequency"); }}2 Test Steps
1) Compile the source code
javac ControlledLogProcessing.java
2) Run the code. To quickly reproduce the problem, set the maximum heap memory to 16M.
java -Xms16m -Xmx16m -XX:+PrintGC ControlledLogProcessing
3 Test Results
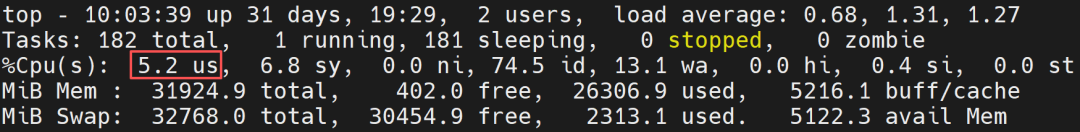
1) Before running the simulation code, the user mode usage rate is only 5.2%:
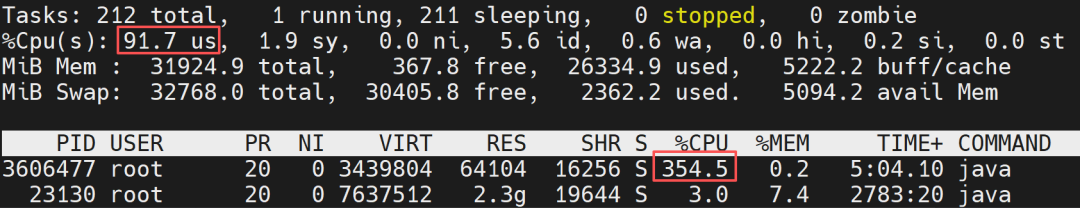
2) After running the simulation code for a while, the CPU user mode usage rate soared to 91.7%, and the simulated program’s CPU usage rate reached 354.5%:
Case Analysis
We will further observe and analyze. The process ID of this simulation program is 3606477, using the command:
top -Hp 3606477
to view the CPU usage rate of each thread in the process, as shown in the following figure:
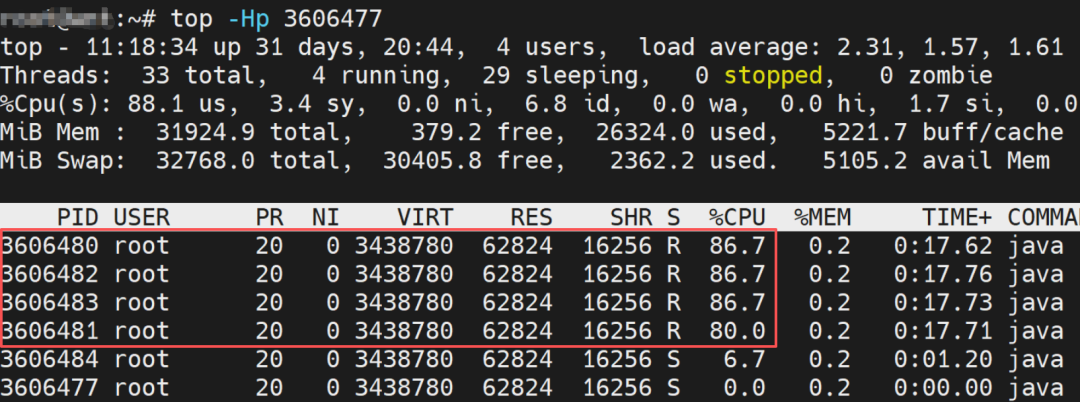
It can be seen that the threads with the highest CPU usage are thread IDs 3606480, 3606481, 3606482, and 3606483. Converting the thread IDs to hexadecimal gives:3707d0, 3707d1, 3707d2, 3707d3.
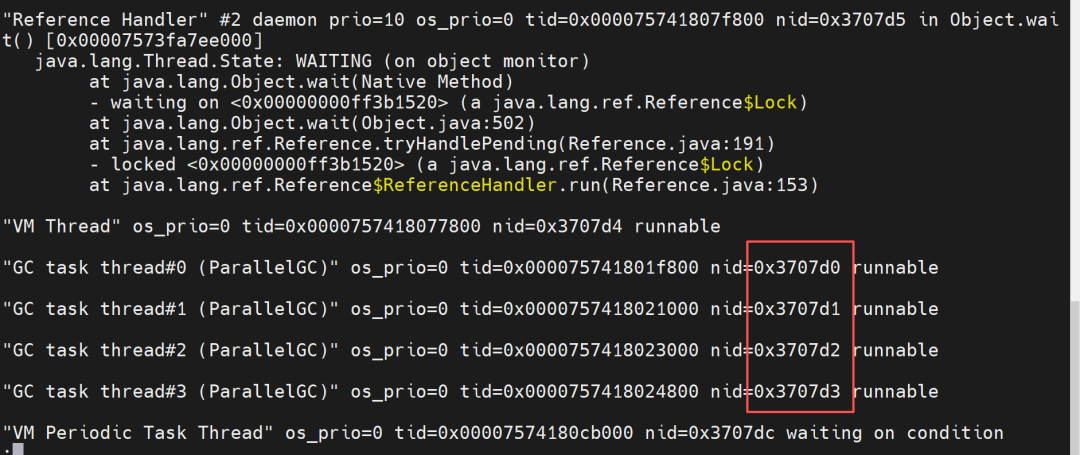
Using jstack 3606477 to print the thread stack of the process, we can see that the threads with the highest CPU usage are all GC task threads, as shown in the following figure:
Summary
Insufficient JVM memory allocation leads to frequent FullGC, which in turn causes the application to consume a large amount of CPU resources. To solve this problem, modifications need to be made based on business and resource conditions. Below are solutions that require minimal changes in different scenarios.
| _ |
CPU and Memory Sufficient |
CPU and Memory Insufficient |
CPU Insufficient, Memory Sufficient |
CPU Sufficient, Memory Insufficient |
|
Allow Message Discard |
Increase the number of consumer threads |
Reduce the size of the queue; if the queue is full, discard messages |
Increase JVM heap memory |
Increase the number of consumer threads, appropriately reduce the queue size |
|
Do Not Allow Message Discard, Short Message Peak |
Increase the number of consumer threads |
Use message middleware to transfer to disk cache |
Increase queue size, increase JVM heap memory |
Increase the number of consumer threads, appropriately reduce the queue size |
|
Do Not Allow Message Discard, Long-term Message Peak |
Increase the number of consumer threads |
Increase the number of consumer servers |
Increase the number of consumer servers |
Increase the number of consumer threads, appropriately reduce the queue size |
|
Do Not Allow Message Discard, High Real-time Requirements |
Increase the number of consumer threads |
Increase the number of consumer servers |
Increase the number of consumer servers |
Increase the number of consumer threads, appropriately reduce the queue size |
Case 2
Frequent Execution of External Commands in JVM Leading to High Kernel Mode Usage
Case Overview
The system has a scheduled task that executes at 0, 10, 20, 30, 40, and 50 seconds every minute, executing thousands of Runtime.exec() calls each time.
Case Simulation
1 Simulation Code
public class ScheduledExternalCommandJdk8 {// Number of calls per executionprivate static final int CALLS_PER_EXECUTION = 9000;// Scheduling interval (10 seconds)private static final int SCHEDULE_INTERVAL_SECONDS = 10;public static void main(String[] args){ ScheduledExecutorService scheduler = Executors.newSingleThreadScheduledExecutor(); System.out.println("Program started, will execute tasks at 0, 10, 20, 30, 40, 50 seconds every minute..."); System.out.println("Each execution will call " + CALLS_PER_EXECUTION + " external commands"); // Calculate the initial delay time for the first execution (to the next 10-second integer multiple) long initialDelay = calculateInitialDelay(); // Schedule the task: execute after initialDelay, then every 10 seconds scheduler.scheduleAtFixedRate( new Runnable() { @Override public void run() { executeExternalCommands(); } }, initialDelay, SCHEDULE_INTERVAL_SECONDS, TimeUnit.SECONDS ); } /** * Calculate the delay to the next 10-second integer multiple time point (in seconds) */ private static long calculateInitialDelay(){ Calendar now = Calendar.getInstance(); int currentSecond = now.get(Calendar.SECOND); // Calculate the difference from the nearest 10-second integer multiple int delaySeconds = (10 - (currentSecond % 10)) % 10; System.out.println("There are " + delaySeconds + " seconds until the next execution"); return delaySeconds; } /** * Execute the specified number of external command calls */ private static void executeExternalCommands(){ Calendar now = Calendar.getInstance(); int minute = now.get(Calendar.MINUTE); int second = now.get(Calendar.SECOND); System.out.printf("[%d minutes %d seconds] Starting task...%n", minute, second); long startTime = System.currentTimeMillis(); for (int i = 0; i < CALLS_PER_EXECUTION; i++) { Process process = null; try { // Call external command (echo) process = Runtime.getRuntime().exec(new String[]{"echo", "Execution count: " + i}); // Wait for the command to complete process.waitFor(); // JDK8 compatibility: read output stream (to avoid buffer blocking) consumeStream(process.getInputStream()); consumeStream(process.getErrorStream()); } catch (IOException | InterruptedException e) { e.printStackTrace(); } finally { if (process != null) { process.destroy(); } } // Print progress every 100 calls if (i % 100 == 0 && i > 0) { System.out.printf("Completed %d calls%n", i); } } long endTime = System.currentTimeMillis(); System.out.printf("This task execution completed, time taken: %d ms%n", (endTime - startTime)); } /** * Consume input stream to avoid buffer blocking */ private static void consumeStream(InputStream is) throws IOException { byte[] buffer = new byte[1024]; while (is.read(buffer) != -1) { // Read data but do not process (only to avoid buffer full) } is.close(); }}2 Test Steps
1) Compile the source code
javac ScheduledExternalCommandJdk8.java
2) Run the code
java ScheduledExternalCommandJdk8
3 Test Results
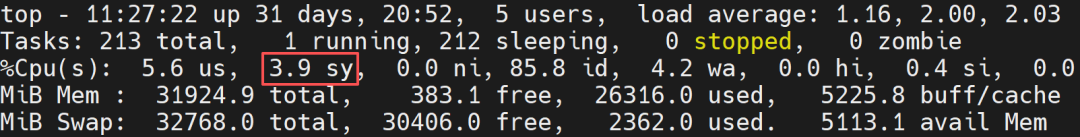
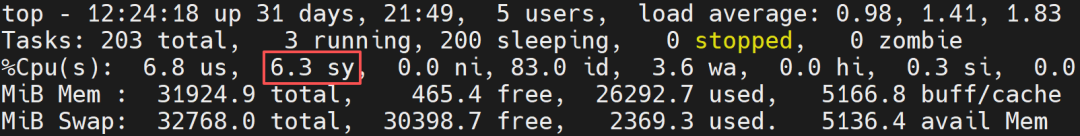
1) Before running the simulation code, the kernel mode usage rate is only 3.9%:
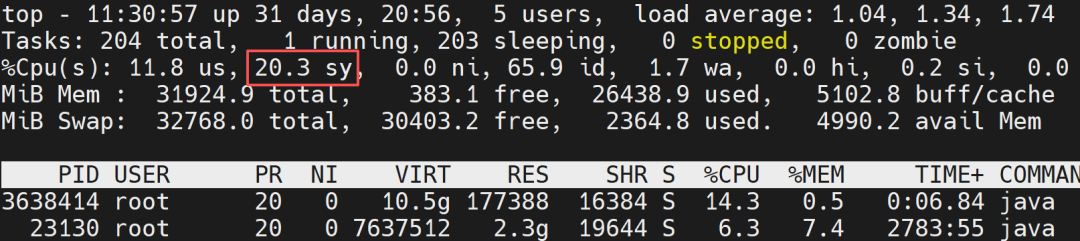
2) After running the simulation code, the kernel mode usage rate soared to 20.3%:
Case Analysis
Use the command to view the processes with the highest kernel mode usage:
pidstat -u 10
It is indeed the process of the simulation program:
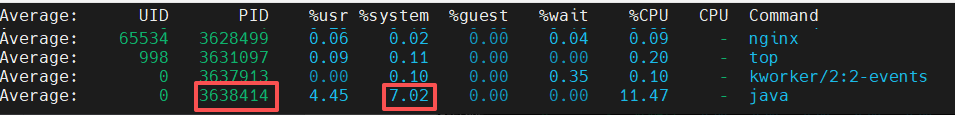
Use the command to view the threads with higher kernel mode usage in that process:
pidstat -p 3638414-t 10

The threads with higher kernel mode usage are thread IDs 3638429 and 4024762, which convert to hexadecimal as:37849d, 3d69ba.
Using jstack 3638414 to print the thread stack, as shown in the following figure:
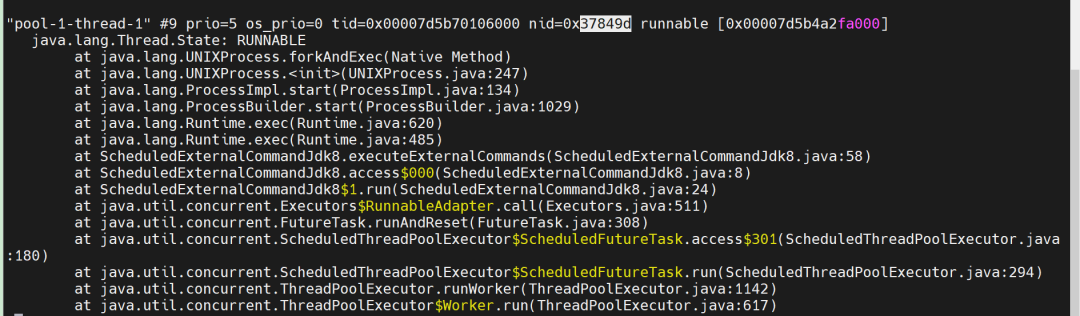
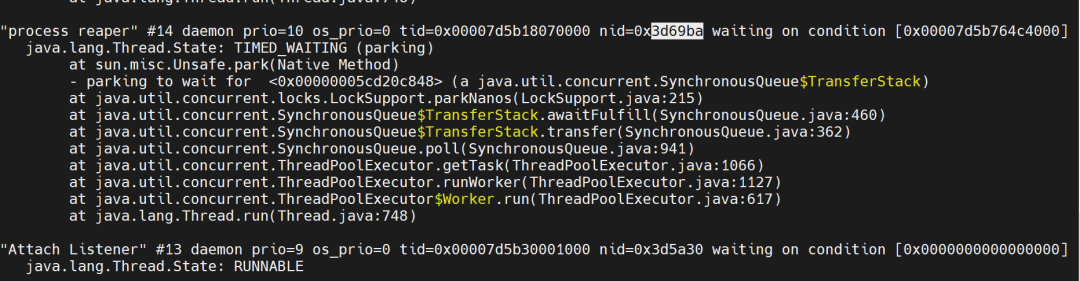
Among them, the thread 3d69ba (Process Reaper thread) is a special background thread maintained by the JVM, specifically for reclaiming resources of terminated subprocesses. When external processes (subprocesses) are created through Runtime.exec() or ProcessBuilder, the Process Reaper thread monitors all external subprocesses created by the JVM. When it detects that a subprocess has ended and has not been actively reclaimed by the user, it automatically calls the operating system’s status confirmation to thoroughly reclaim the kernel resources of the subprocess, avoiding the accumulation of zombie processes.
Frequent calls to external commands in JVM may lead to increased CPU kernel usage, mainly due to:
-
The kernel overhead of process creation and destruction.
-
The overhead of process scheduling and context switching.
-
The frequent triggering of system calls.
-
The “inefficient scheduling” of short-lived processes.
For the simulation code, simply reducing the number of external command calls (setting CALLS_PER_EXECUTION to 9) can greatly alleviate the CPU kernel mode usage loss:
In this case, the frequent calls to external commands mainly used the sed command to read the contents of the configuration file. It was modified to read the entire file into memory and find the corresponding content in memory. After the modification and redeployment, the problem did not recur.
Summary
The approach to solving such problems mainly involves reducing the number of external process creations or optimizing the process calling method. Below are specific solutions:
|
Solution |
Applicable Scenarios |
Principle |
|
Reduce Call Frequency |
External commands can batch process tasks (e.g., batch parsing files, batch calculations). |
Combine multiple small tasks into one call to reduce the frequency of process creation. |
|
Reuse External Processes |
External commands are long-running service programs (can interact through input and output streams). |
Pre-create a batch of external processes and keep them running to avoid frequent creation/destruction. |
|
Implement External Command Logic in Java |
External command functionality is simple and can be rewritten in Java. |
Completely avoid external process calls by moving logic into the JVM. |
|
Use Shared Libraries (JNI/JNA) |
External commands are implemented in C/C++ and cannot be rewritten in Java. |
Compile the external command logic into a shared library (.so/.dll) and call it through JNI/JNA to avoid process switching. |
|
Cache Reuse |
Frequent calls to external commands with the same input and unchanged results. |
Cache the command output results and return cached values for the same input directly. |
Case 3
Excessive Thread Count Leading to Frequent Context Switching in Kernel
Case Overview
The platform manages about 3000 clients, and when modifying configurations on the page, commands need to be issued to all clients, assigning a thread to each client. Each thread only performs a small amount of socket writing, resulting in a noticeable increase in kernel mode usage while the user mode CPU usage does not increase significantly, causing the overall system response to slow down.
Case Simulation
1 Simulation Code
class Client { private String clientId; public Client(String clientId) {this.clientId = clientId;} public String getClientId(){return clientId;} // Simulate the method to send commands public void sendCommand(String command){ // Simulate client processing commands, consuming some CPU resources for (int i = 0; i < 10; i++) { Math.sqrt(i * Math.random()); try{ Thread.sleep(100); } catch (InterruptedException e) { Thread.currentThread().interrupt(); } } }}// Thread class for sending commandsclass SendCommandThread extends Thread { private Client client; private String command; public SendCommandThread(Client client, String command){ this.client = client; this.command = command; } @Override public void run() { try { // Simulate some preparation work before sending commands Thread.sleep(1000); int i=0; // Continuously send commands to the client while (i < 100) { // Send command client.sendCommand(command); i++; } } catch (InterruptedException e) { Thread.currentThread().interrupt(); } }}public class ClientSimulation { public static void main(String[] args){ System.out.println("Starting simulation to send commands to 3000 clients..."); System.out.println("Each client will be assigned a separate thread"); // Create 3000 clients List<Client> clients = new ArrayList<>(); for (int i = 0; i < 3000; i++) { clients.add(new Client("Client-" + (i + 1))); } // Create and start a sending command thread for each client String command = "system-update-check"; for (Client client : clients) { Thread thread = new SendCommandThread(client, command); thread.start(); } System.out.println("All threads have started, a total of " + clients.size() + " threads"); System.out.println("Observing CPU usage..."); }}2 Test Steps
1) Compile the source code
javac ClientSimulation.java
2) Run the code
java ClientSimulation
3 Test Results
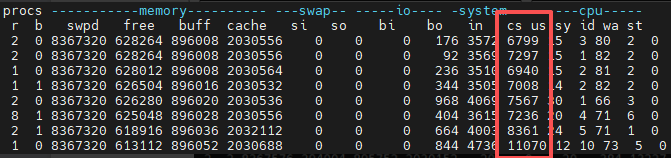
Before running the simulation code, use vmstat 1 to monitor the overall context switch count of the system, where the key indicator is: cs (total context switches per second), which is about 6000-11000 times per second:
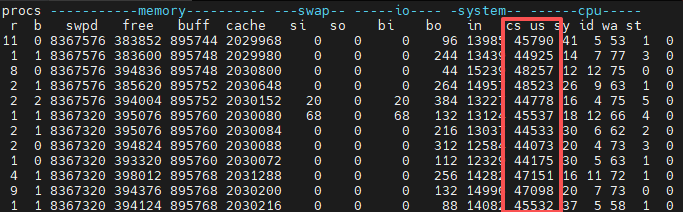
After running the simulation code, the system context switches increased to 44000-45000 times per second. The CPU’s kernel mode usage also increased:
Case Analysis
Use the command:
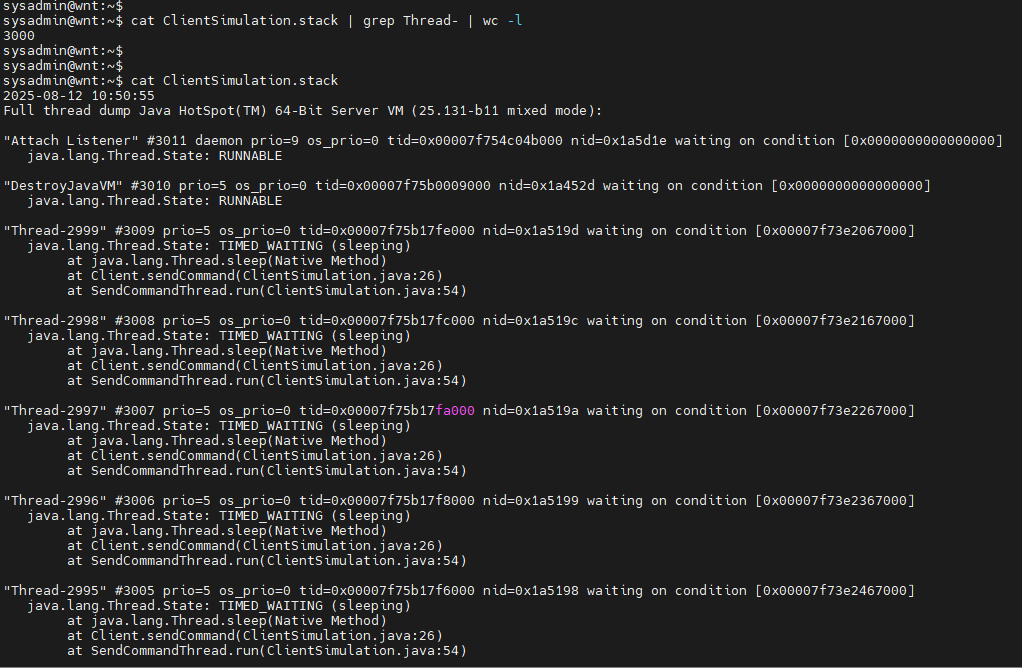
jstack [pid] > ClientSimulation.stack
to output the thread stack to a file, and check the contents of ClientSimulation.stack, finding that most threads are in TIMED_WAITING state, which is due to the use of the sleep method in the simulation code. In actual business scenarios, many threads may be in RUNNABLE or BLOCKED states.
Summary
Having more threads is not always better; a large number of threads can lead to frequent context switching. During context switching, the working set of the new thread may not be in the cache, causing CPU cache misses, requiring reloading into memory. Additionally, context switching itself consumes CPU time, all of which reduce effective execution time, increase task response delays, and decrease computational efficiency. Generally, a normal system has context switches in the thousands to tens of thousands per second. If context switches exceed 100,000 times per second, it needs to be taken seriously.
To solve this problem, it is recommended to use a thread pool to reduce the number of threads. ThreadPoolExecutor is the core implementation class of the thread pool, and its constructor defines the core parameters of the thread pool:
public ThreadPoolExecutor( int corePoolSize, // Core thread count int maximumPoolSize, // Maximum thread count long keepAliveTime, // Non-core thread idle lifespan TimeUnit unit, // Lifespan unit BlockingQueue<Runnable> workQueue, // Task blocking queue ThreadFactory threadFactory, // Thread creation factory RejectedExecutionHandler handler // Task rejection strategy)When submitting tasks to the thread pool, the processing flow is as follows:
-
If the current thread count < core thread count: create core threads to execute tasks.
-
If core threads are saturated (thread count = core thread count): tasks are queued for waiting.
-
If the queue is full and the current thread count < maximum thread count: create non-core threads to execute tasks.
-
If the queue is full and thread count = maximum thread count: trigger the rejection strategy.
When creating a thread pool, different thread counts should be set based on the type of tasks:
-
CPU-bound tasks: Thread count ≈ CPU logical core count (or logical core count + 1)
-
IO-bound tasks: Thread count ≈ CPU logical core count * 2 (depending on IO latency, if latency is high, the thread count can be increased appropriately)
-
Mixed tasks: It is recommended to split CPU-bound and IO-bound parts into independent tasks, using two thread pools, each configured with thread counts according to their task types.
Case 4
CPU Resource Limitation
Case Overview
In the log auditing system server, multiple task processes are running, with the core task being to generalize the received logs and write them to the database. There is a data mining process in the system, which mainly performs tasks such as predicting traffic trends, analyzing frequent log item sets, and the correlation between logs. This process requires various machine learning model calculations, consuming a large amount of CPU resources, leading to reduced efficiency of the core task processes. Whenever the data mining task runs, some logs cannot be processed in a timely manner.
Case Analysis
The data mining function was added later, and for various reasons, this function must be retained. This task is executed periodically, every half hour. To minimize the impact of this later-added task on the core tasks, the CPU resource usage of the data mining process was limited. As long as the data mining task can be completed within half an hour, the impact on the data mining task is within a controllable range. Ultimately, the problem was solved by using cgroups to limit the CPU time quota of the data mining process.
Summary
Limit the CPU resources occupied by non-core task processes. There are several implementation methods:
-
Use cgroups to set CPU time quotas (format: quota period, in microseconds, e.g., 50000 100000 means 50% usage) or relative weights (default 100, during CPU competition, resources are allocated proportionally, e.g., a group with weight 200 gets twice the time of the default group). For cgroup v2, the operation is as follows:
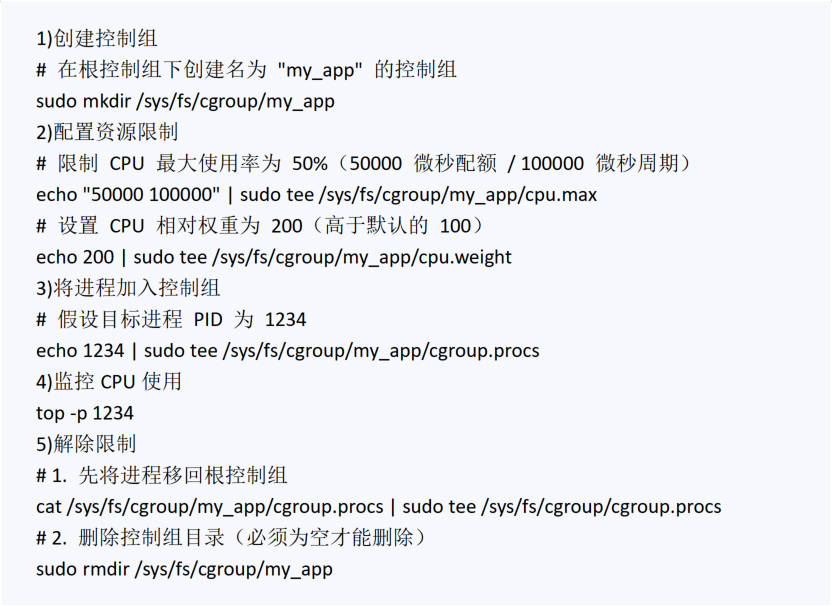
-
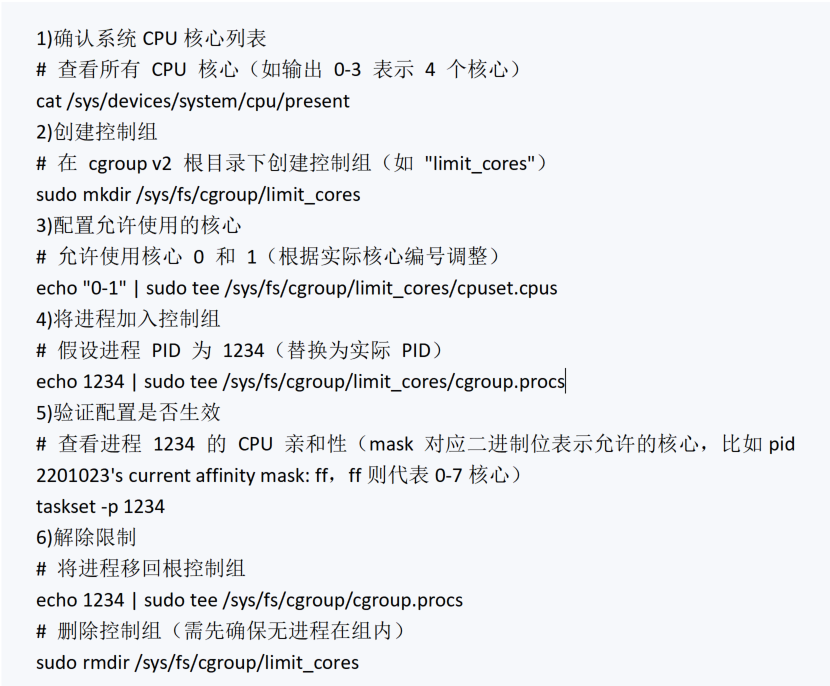
Use cgroups to limit the CPU cores that a process can use. For cgroup v2, the operation is as follows:
-
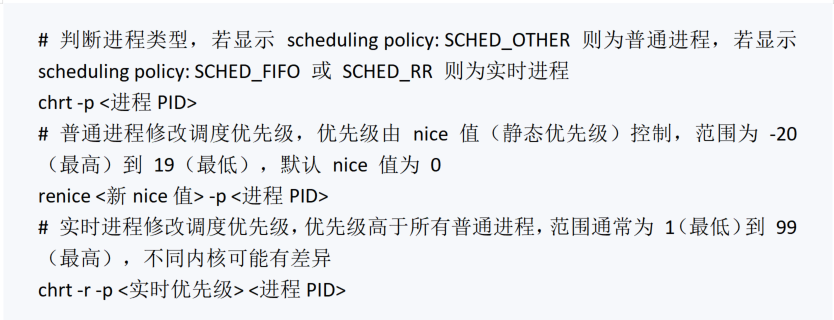
Control the scheduling priority of processes, allowing high-priority processes to gain more running time during CPU competition.
5
Conclusion
CPU performance optimization for Java applications in a Linux environment focuses on identifying the sources of resource consumption and performance bottleneck scenarios. Whether it is JVM memory configuration, external process calls, thread management, or system resource quota allocation, the key to optimization lies in accurately matching demand with resources. There is no universal template for CPU performance optimization; it is necessary to find a balance between business availability and resource utilization. Through continuous monitoring, scenario-based analysis, and iterative optimization, Java applications can maintain efficient and stable operation in a Linux environment, providing solid performance support for core business operations.

 Channel Cooperation Consultation: Mr. Tian 15611262709Manuscript Cooperation: WeChat: shushu12121