Please respect the original workFor reprints, please indicate the link to this articleand the author: slandarer
Although the previous chord and Sankey diagrams had scales, they sometimes did not stand out enough, so I added a data labeling feature: it is important to note that this feature requires at least R2019b version. First, I will briefly explain how to implement it so that everyone can use it for plotting, and then I will discuss how the chord and Sankey diagram functions have been updated:
Principle
The implementation mainly relies on the <span>datatip</span> and <span>dataTipTextRow</span> functions introduced in R2019b. For example, you can write the following code:
X = [1, 2, 5, 3, 4, 2, 6, 6, 3, 1];
Y = [2, 1, 4, 2, 8, 3, 1, 4, 2, 3];
N = {'S', 'L', 'A', 'N', 'D', 'A', 'R', 'E', 'R', '!'};

p = scatter(X, Y,  80, 'k', 'filled');

% datatip(p)
p.DataTipTemplate.DataTipRows(1) = dataTipTextRow('XXX', X);
p.DataTipTemplate.DataTipRows(2) = dataTipTextRow('YYY', Y);
p.DataTipTemplate.DataTipRows(3) = dataTipTextRow('X+Y', X+Y);
p.DataTipTemplate.DataTipRows(4) = dataTipTextRow('NNN', N);
Then, clicking on the data point will display the following data tooltip:
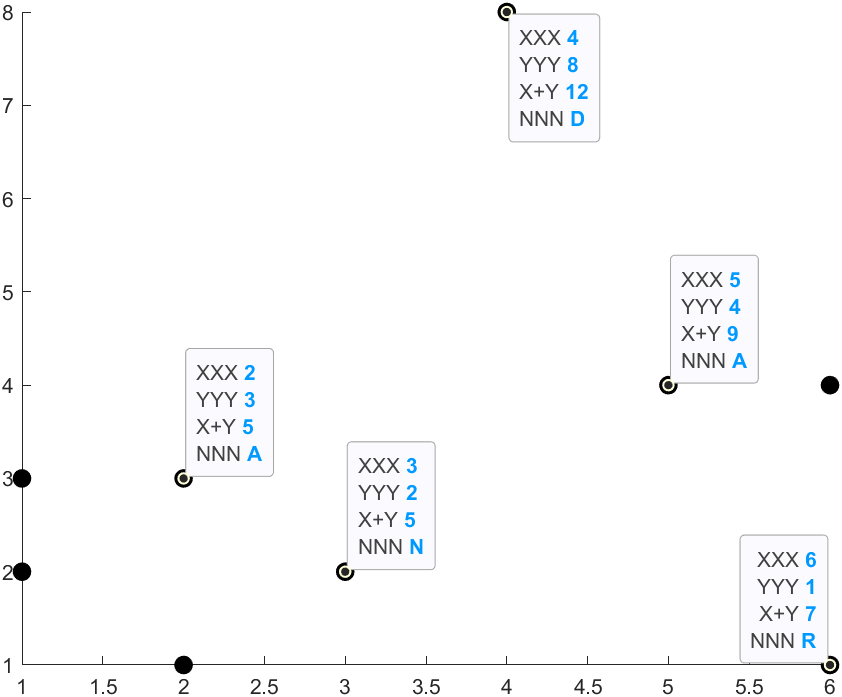
It is important to note that the size of the tooltip information array must match the size of the original data. For example, here both <span>X</span> and <span>Y</span> contain 10 values, so the size of <span>N</span> must also be the same.
Interactive Feature Demonstration
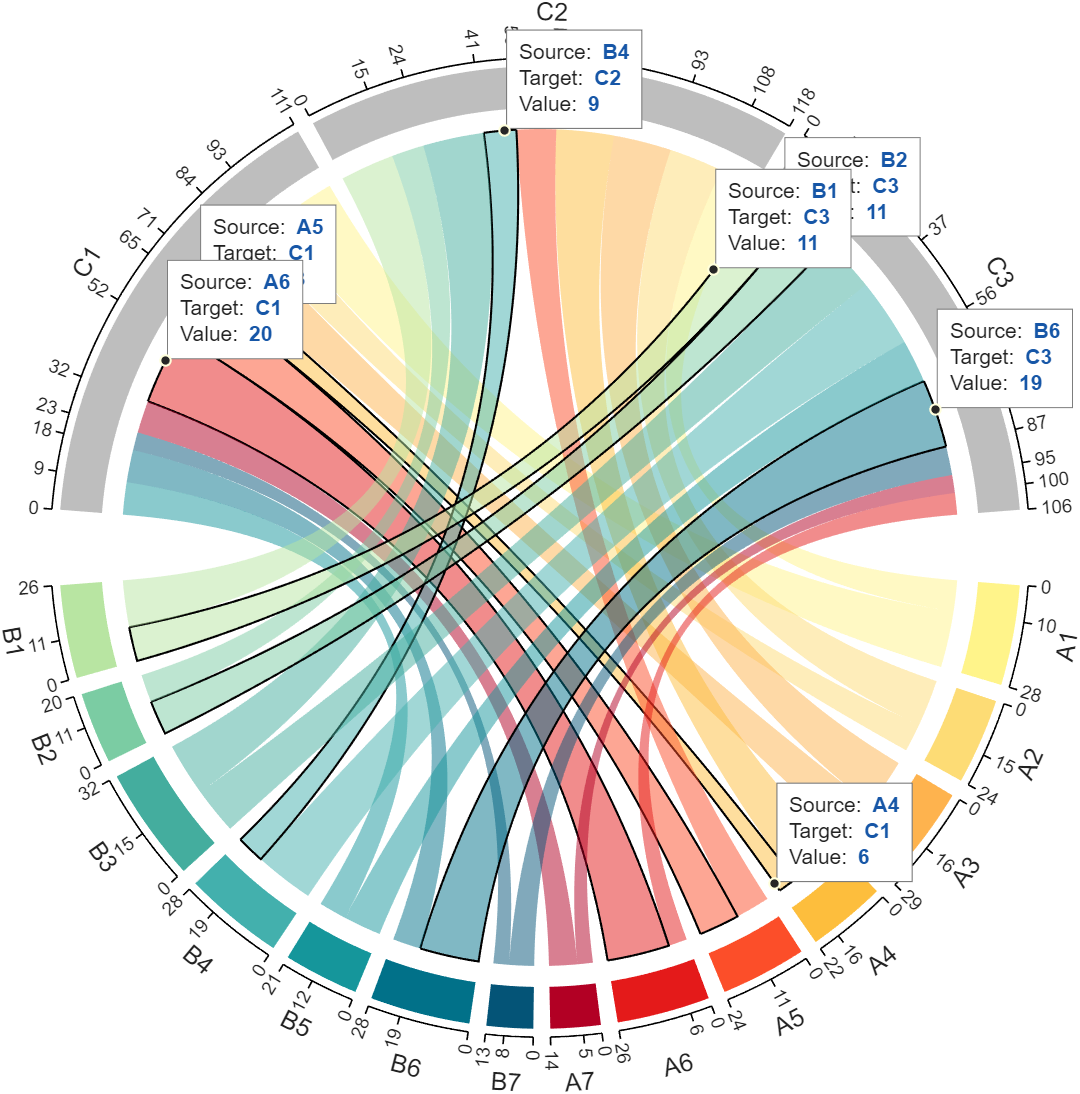
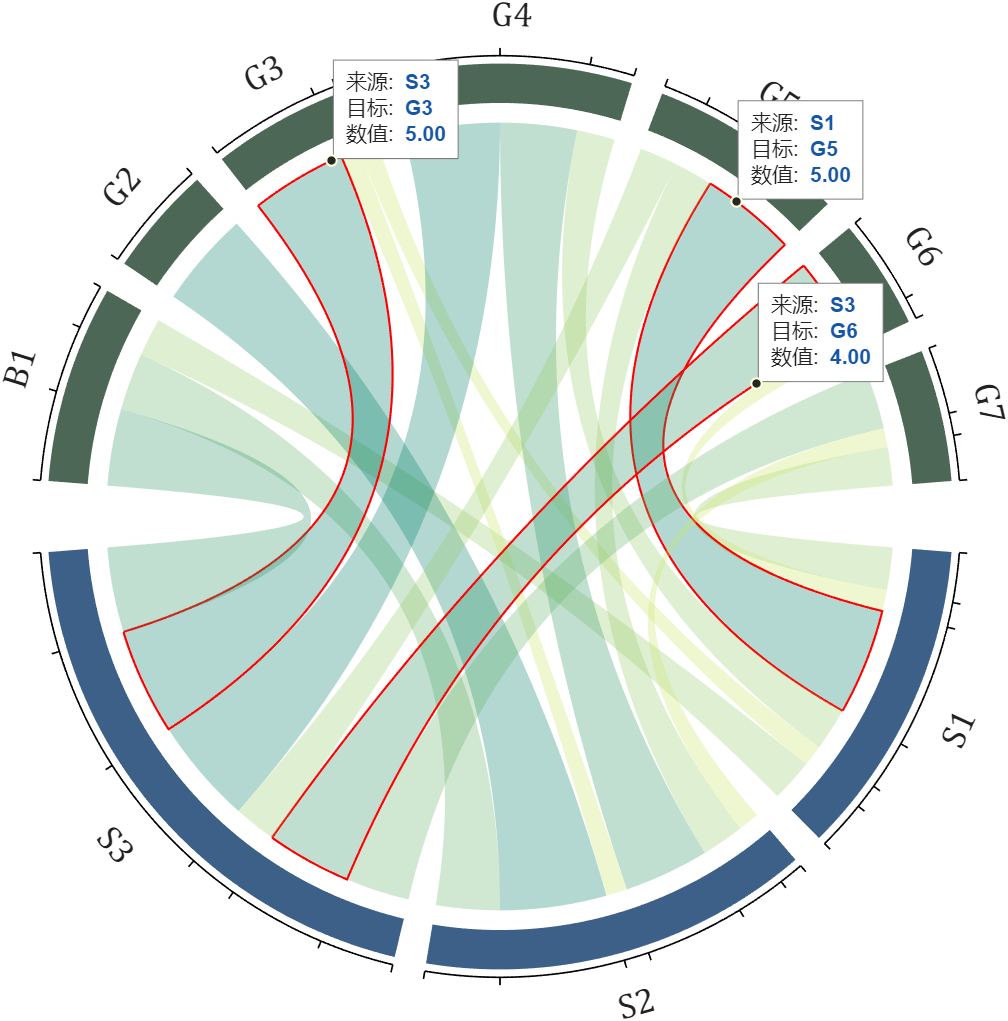
I have improved the plotting for the three functions; left-clicking on a chord adds a data tooltip, clicking on the small dots removes the data tooltip, and right-clicking removes the highlight from the chord (black bold edge line):
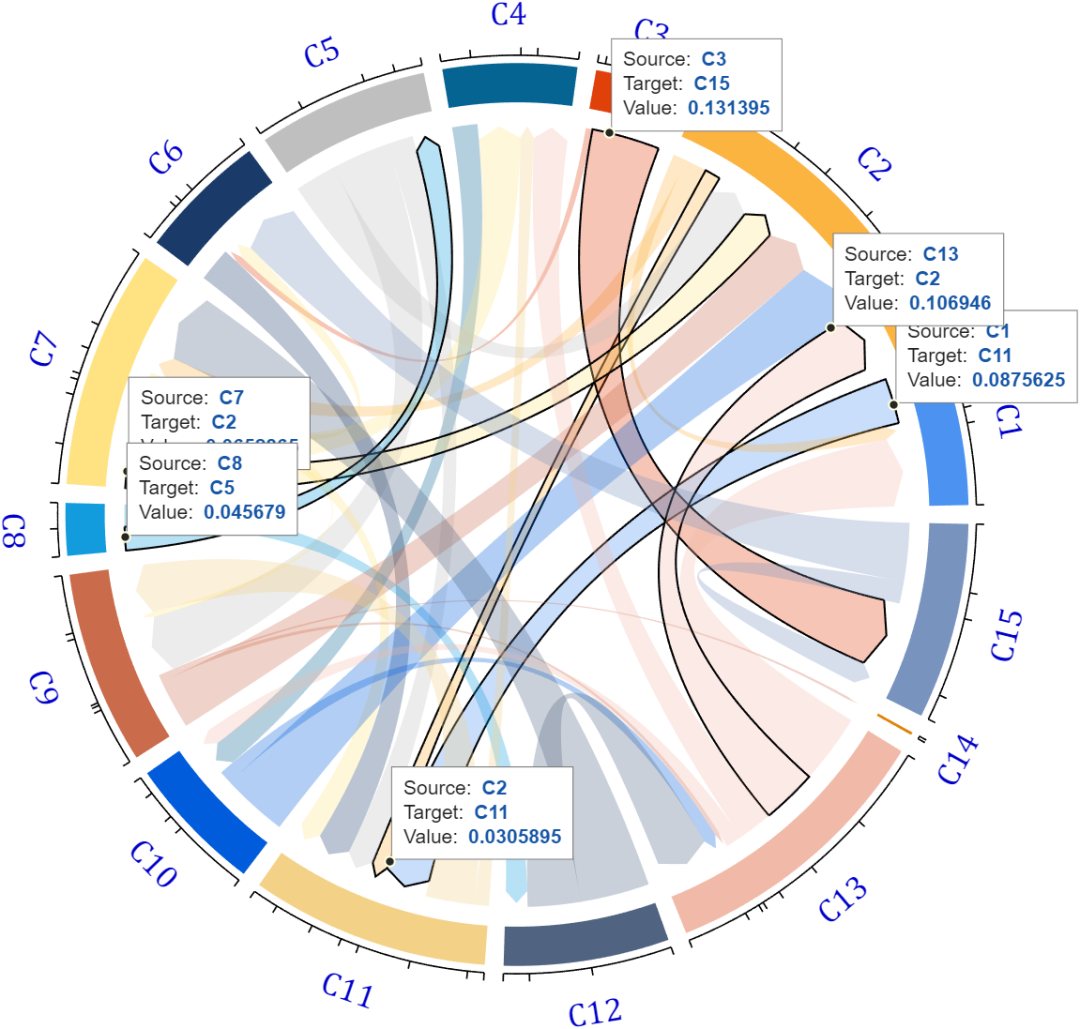
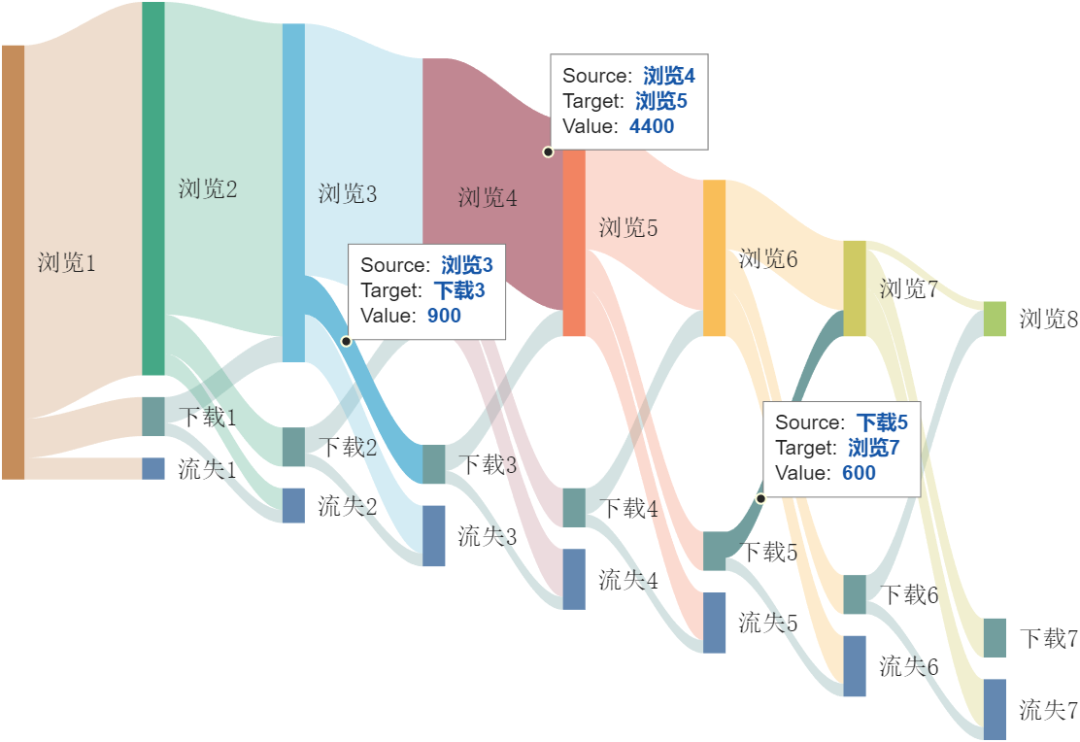
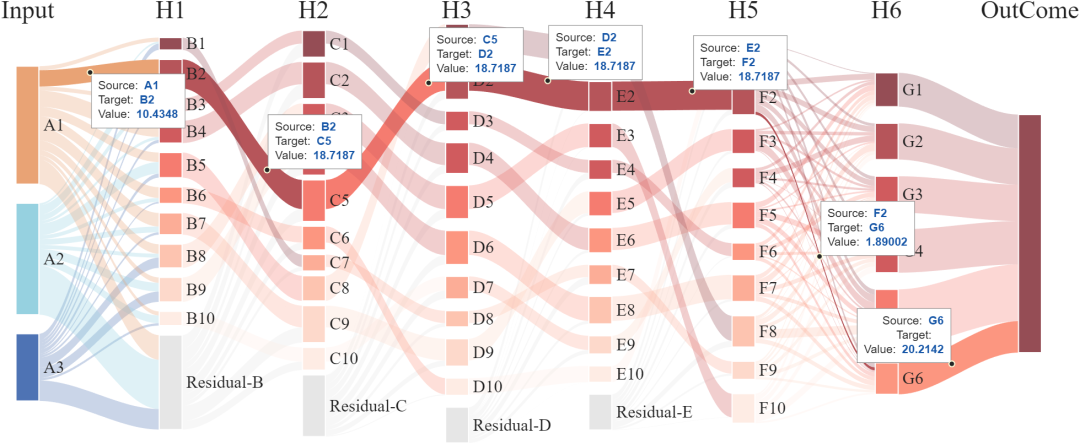
Additionally, the usage of the Sankey diagram is similar, but instead of changing the edge color, the transparency is modified:
Furthermore, I have set up a simple parameter table to modify the basic properties of the data tooltip. For example, for the chord diagram, the first parameter is the color scheme, followed by three label names, and the last one is the value format. For instance, if we previously created an object named <span>CC</span>, we can modify it as follows:
CC.dataTipFormat = {'r', 'Source:', 'Target:', 'Value:', '%.2f'};
This way, when clicking on the chord, the displayed labels, highlight colors, and data formats will change:
You can obtain the updated functions from the gitee repository or file exchange:
gitee
<span>Chord Diagram Collection</span>https://gitee.com/slandarer/matlab-chord-chart<span>Sankey Diagram</span>https://gitee.com/slandarer/matlab-sankey-diagram
fileexchange
<span>Chord Diagram</span>https://www.mathworks.com/matlabcentral/fileexchange/116550-chord-chart<span>Directed Chord Diagram</span>https://www.mathworks.com/matlabcentral/fileexchange/121043-digraph-chord-chart<span>Sankey Plot</span>https://www.mathworks.com/matlabcentral/fileexchange/128679-sankey-plot