1. Background
1. Storytelling
Among all JetBrains products related to .NET, I believe <span>DotTrace</span> is the one worth deep study and research. I think its advantages are as follows:
- Cross-platform diagnostics (Windows, Linux, MacOS)
- Compatible with nettrace produced by dotnet-trace.
- Excellent visualization interface, especially the timeline.
- Supports self-hosting and local code diagnostics.
This is an indispensable tool in my <span>.NET Advanced Debugging Knowledge Series</span>. Without further ado, let’s start discussing the <span>four major types of diagnostics</span>.
2. The Four Major Types of Diagnostics
1. Sampling Mode
If your program experiences performance degradation but you don’t know where the slowdown is occurring or where to start, you can use the <span>Sampling</span> mode. It provides a macro perspective on the program’s performance from the <span>application</span> standpoint, serving as the first checkpoint for performance insights.
The Sampling mode samples each thread stack every 5 to 11 ms, allowing you to calculate the cumulative execution time of each function through a <span>group by</span> method based on a large number of samples. A small detail to note is that if the <span>function execution time < 5ms</span>, it will definitely not be captured, which is understandable.
Next, we will write a simple matrix operation and look for time-consuming functions. The reference code is as follows:
using System;
using System.Diagnostics;

namespace MatrixOperations
{
    internal class Program
    {
        static void Main(string[] args)
        {
            const int baseSize = 1000;
            const int iterations = 3;

            for (int i = 0; i < iterations; i++)
            {
                int matrixSize = baseSize - (i * 100);
                PerformMatrixMultiplication(matrixSize);
            }
        }

        static void PerformMatrixMultiplication(int matrixSize)
        {
            Console.WriteLine($"\n=== Processing {matrixSize}x{matrixSize} Matrix ===");

            Console.WriteLine("Creating random matrix...");
            var matrixA = GenerateRandomMatrix(matrixSize, matrixSize);
            var matrixB = GenerateRandomMatrix(matrixSize, matrixSize);

            Console.WriteLine("Executing matrix multiplication...");
            var timer = Stopwatch.StartNew();

            var resultMatrix = MultiplyMatrices(matrixA, matrixB);

            timer.Stop();
            Console.WriteLine($"Operation completed, time taken: {timer.Elapsed.TotalSeconds:0.000} seconds");

            DisplayMatrixPreview(resultMatrix);
        }

        static double[,] GenerateRandomMatrix(int rows, int cols)
        {
            var random = new Random();
            var matrix = new double[rows, cols];

            for (int i = 0; i < rows; i++)
            {
                for (int j = 0; j < cols; j++)
                {
                    matrix[i, j] = random.NextDouble() * 100;
                }
            }

            return matrix;
        }

        static double[,] MultiplyMatrices(double[,] matrixA, double[,] matrixB)
        {
            int aRows = matrixA.GetLength(0);
            int aCols = matrixA.GetLength(1);
            int bCols = matrixB.GetLength(1);

            if (matrixA.GetLength(1) != matrixB.GetLength(0))
                throw new ArgumentException("Matrix dimensions do not match");

            var result = new double[aRows, bCols];

            for (int i = 0; i < aRows; i++)
            {
                for (int j = 0; j < bCols; j++)
                {
                    double sum = 0;
                    for (int k = 0; k < aCols; k++)
                    {
                        sum += matrixA[i, k] * matrixB[k, j];
                    }
                    result[i, j] = sum;
                }
            }

            return result;
        }

        static void DisplayMatrixPreview(double[,] matrix, int previewSize = 3)
        {
            Console.WriteLine($"\nMatrix Preview (First {previewSize}x{previewSize} Elements):");

            int rows = Math.Min(previewSize, matrix.GetLength(0));
            int cols = Math.Min(previewSize, matrix.GetLength(1));

            for (int i = 0; i < rows; i++)
            {
                for (int j = 0; j < cols; j++)
                {
                    Console.Write($"{matrix[i, j],8:0.00} ");
                }
                Console.WriteLine();
            }
        }
    }
}
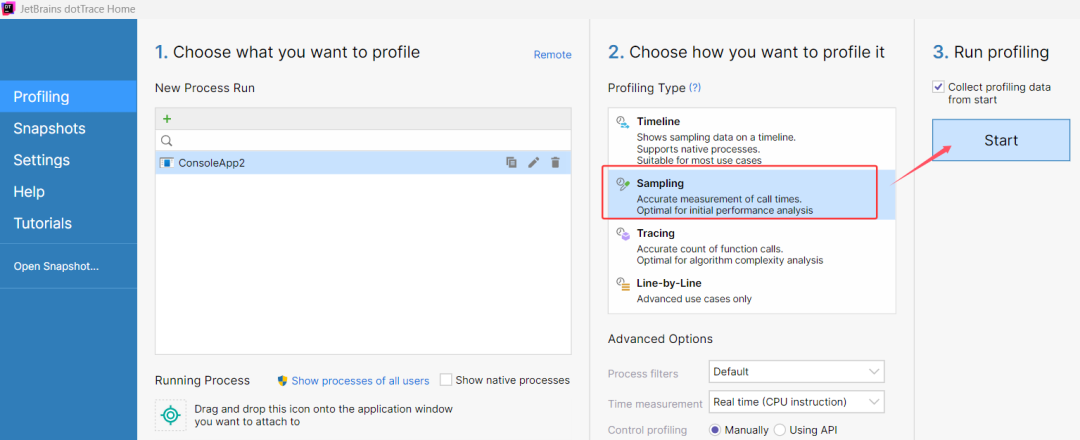
Open dottrace, select <span>Sampling</span> mode, and click Start. The screenshot is as follows:
After the program runs, it will automatically exit, and dottrace will automatically open the collected trace file. The screenshot is as follows:
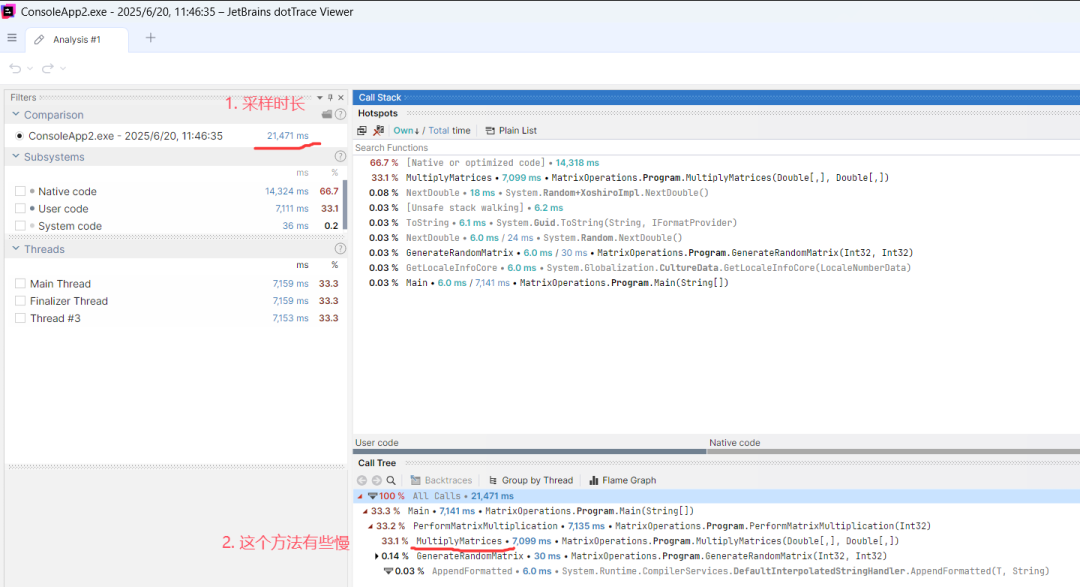
From the trace, we can extract the following information:
- Dottrace sampled for 21 seconds.
- Unmanaged layer took 14 seconds + managed layer took 7 seconds.
- MultiplyMatrices took 7 seconds, making it the most CPU-intensive method compared to others.
To understand why MultiplyMatrices took 7 seconds, that is a detail issue that Sampling mode cannot reveal.
It is worth mentioning that Sampling is a coarse-grained performance tracking method, and the generated sampling files are small, suitable for long-term monitoring on a daily basis.
2. Tracing Mode
Earlier, we gained a macro insight from the <span>application</span> perspective and identified the suspicious function <span>MultiplyMatrices</span>. I believe you are now very interested in why this method takes so much time???
This is what we will discuss in this section regarding the <span>Tracing</span> mode. Compared to Sampling, it provides <span>method-level</span> insights, allowing you to see more information about the method, such as:
- Method call time
- Method call count
Some may wonder how the method call count is calculated at the lower level? This is thanks to the ICorProfilerCallback notification mechanism of coreclr, which notifies registered third parties (like DotTrace) when entering and exiting methods. The specific details will not be discussed here.
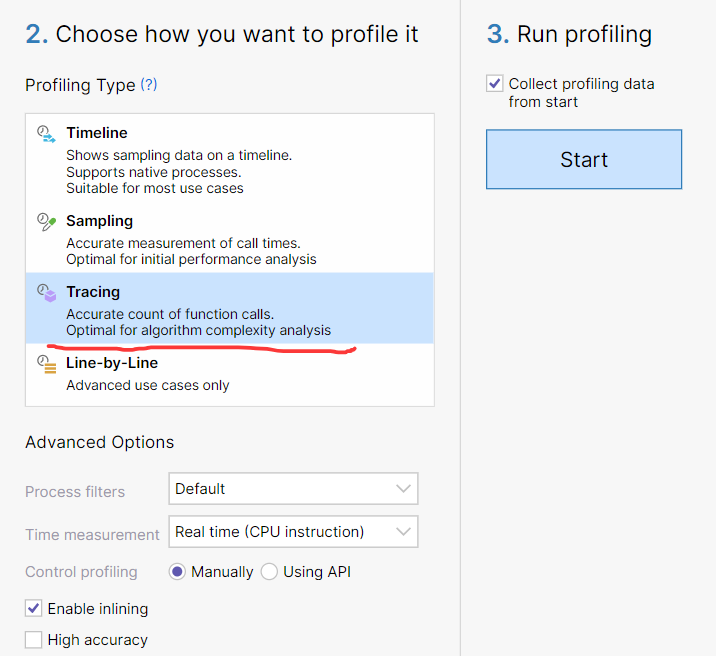
Next, switch to <span>Tracing</span> mode and rerun the program. The screenshot is as follows:
After DotTrace completes tracing, a trace file will be generated. Then use F5 to search for the target function <span>MultiplyMatrices</span>. The screenshot is as follows:
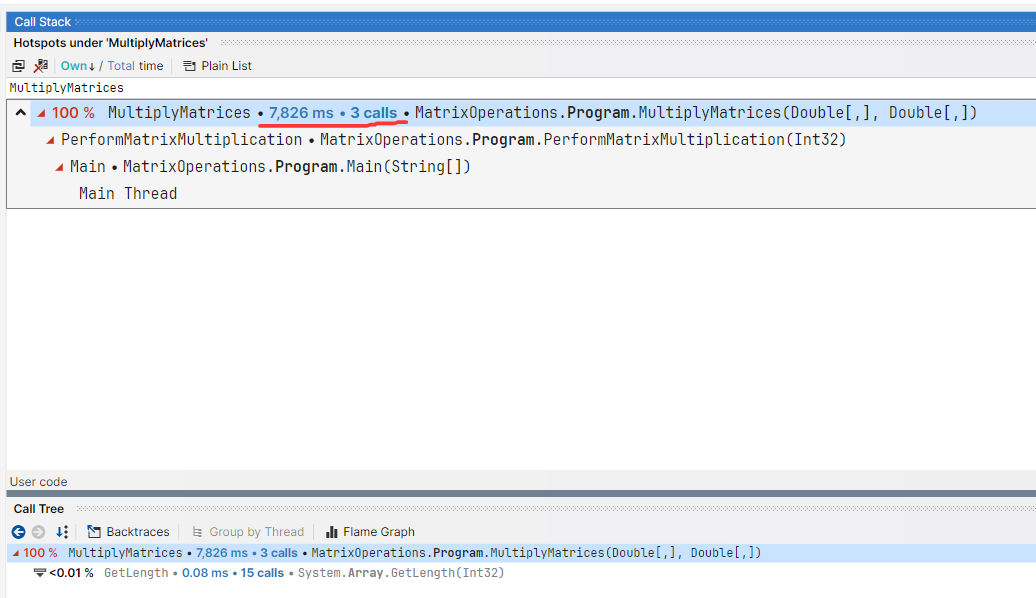
From the trace, we obtained more information, such as discovering that the MultiplyMatrices method was called three times, totaling nearly 8 seconds, averaging about 3 seconds per call. If you feel that 3 seconds per call is still a bit long, how should we continue to drill down?
It is worth mentioning that Tracing is method-level in scope, and the generated sampling files are relatively large, suitable for hourly monitoring.
3. Line-by-Line Mode
As we mentioned earlier, <span>Tracing</span> is method-level in scope, and to go further down, we can only look at <span>statement-level</span> insights. This is primarily achieved through <span>IL instrumentation technology</span>. Some tools, like harmony’s transpiler, insert a lot of garbage code, which can lead to a significant slowdown in program execution, making it difficult to complete tracking! Therefore, in such fine-grained scenarios, it is more suitable to implement local tracking through code, which will be discussed in future articles.
After tracking for 100 seconds, I stopped the tracking, opened the view, and right-clicked on the MultiplyMatrices method to view the source code. The screenshot is as follows:
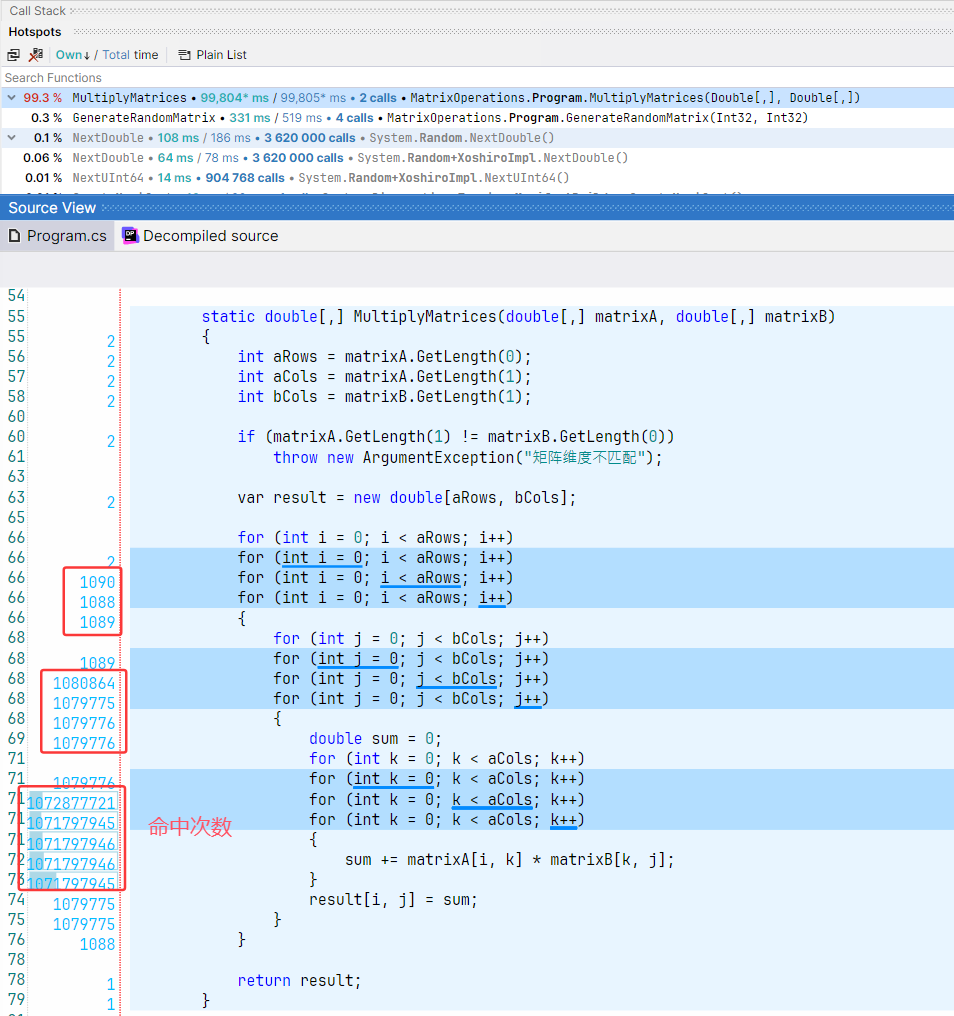
From the trace, it is clear that during the 100 seconds of tracking, all the time was consumed by the MultiplyMatrices method. From the perspective of <span>hit count</span>, the time consumption is all within the three nested for loops, O(N3). The innermost for loop has executed over 1 billion times…
3. Conclusion
DotTrace is a very powerful visual commercial tool, particularly suitable for analyzing scenarios where <span>programs suddenly slow down</span>.
As a JetBrains community content collaborator, if you purchase JetBrains products, you can use my discount code HUANGXINCHENG for a 25% internal discount.