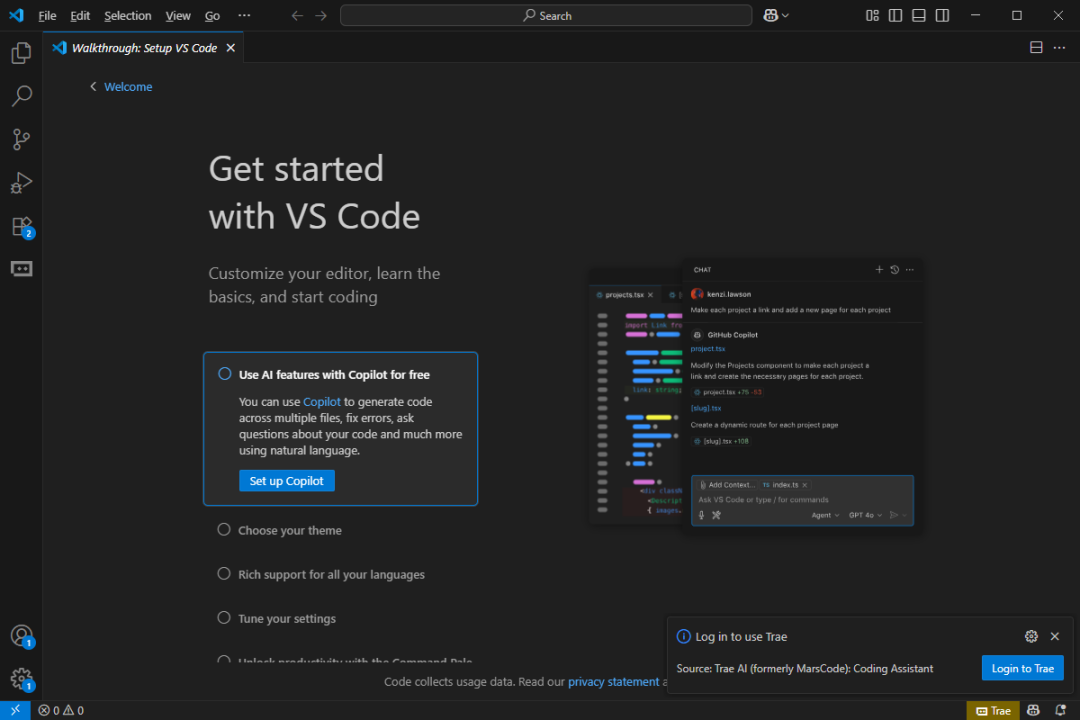
Overview: This article mainly discusses how to run and debug your first Python program, Hello World, in VS Code, including setting breakpoints, stepping through code, etc. It aims to help beginners in the Python language understand and familiarize themselves with practical debugging techniques. All images and text in this article are original works by the author; copyright infringement will be pursued. Please indicate the source when sharing. 1. The previous article introduced how to install and set up the Python development environment based on VS Code. This article will not repeat that information. Readers who do not know how to set up the development environment can refer to earlier articles. Double-click to run VS Code, and the following welcome screen will appear on the first run.
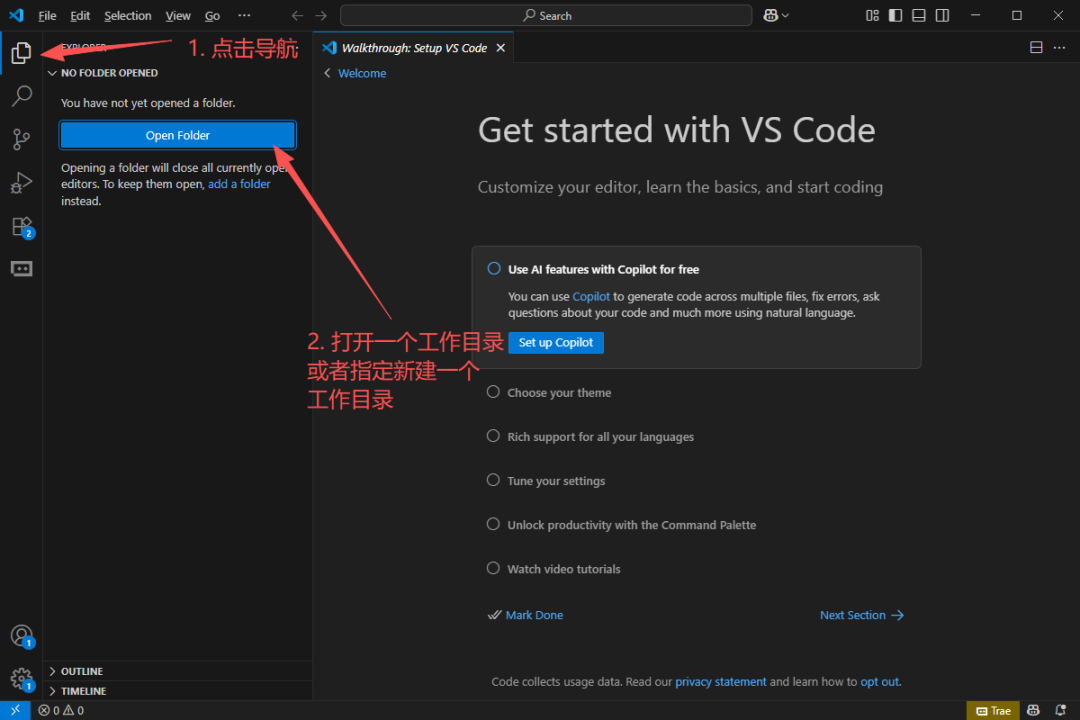
 2. Specify a working directory, which is the directory where your project is located.
 3. Create a new file.
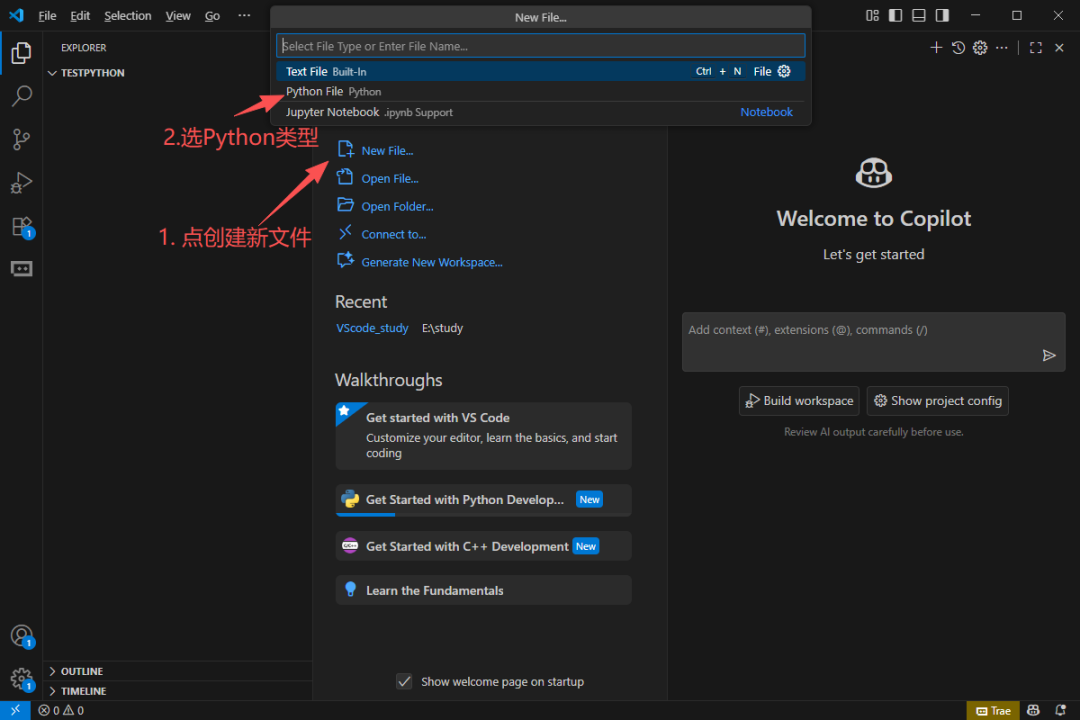 4. Enter the main code and save it as a .py file.
print(“hello world”)
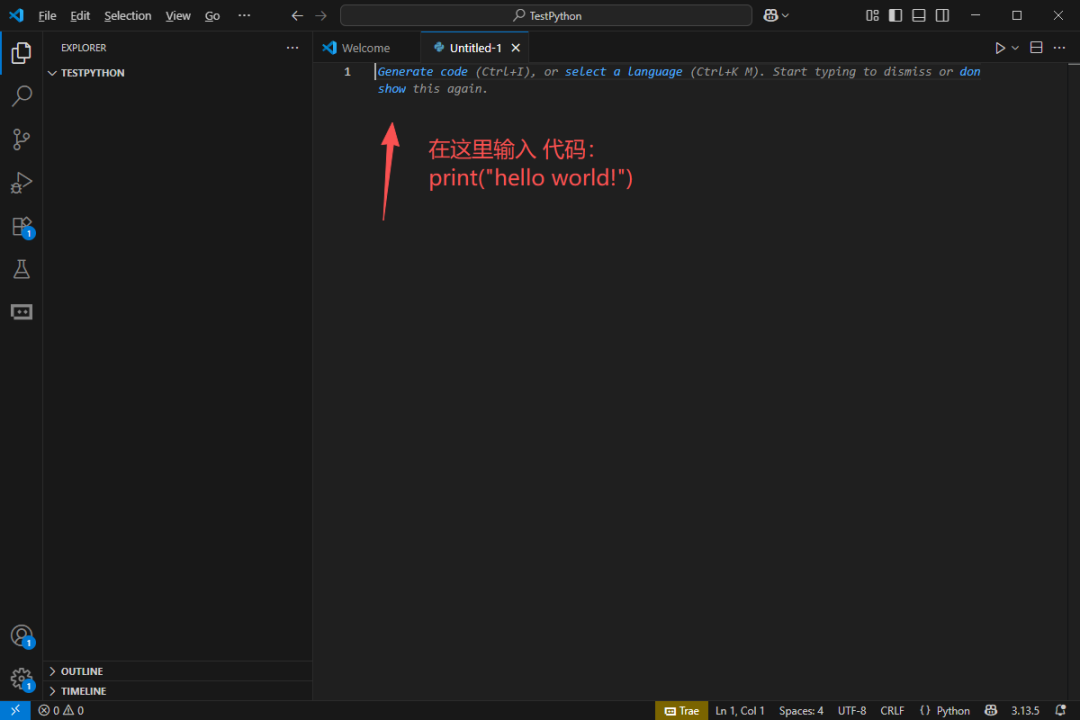
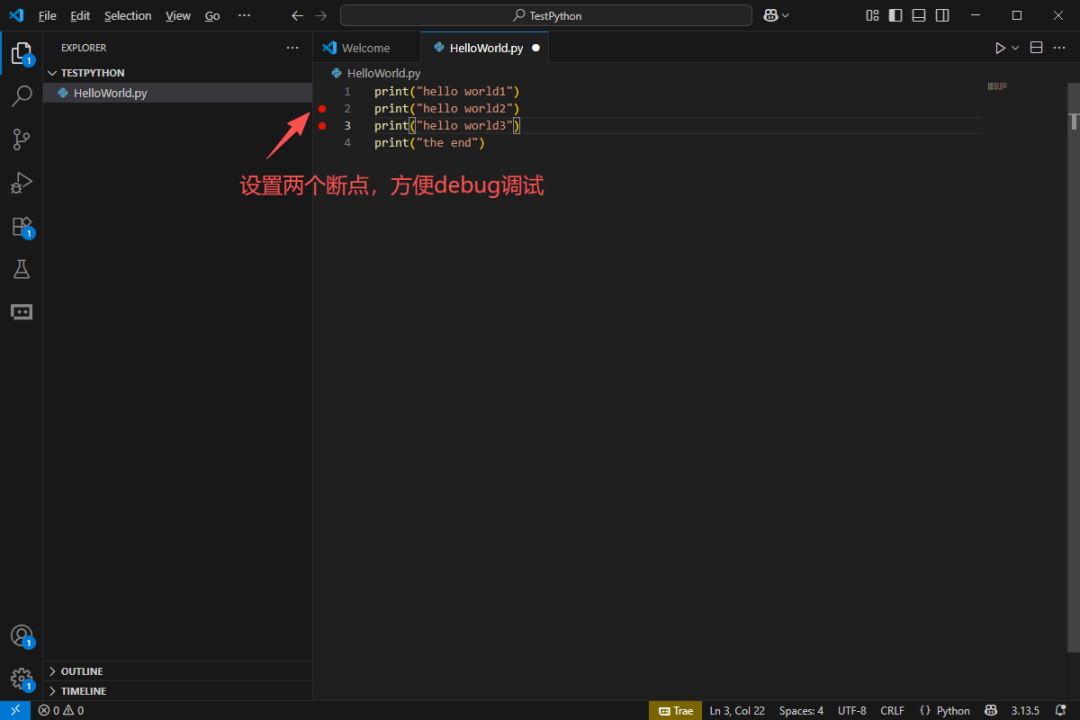
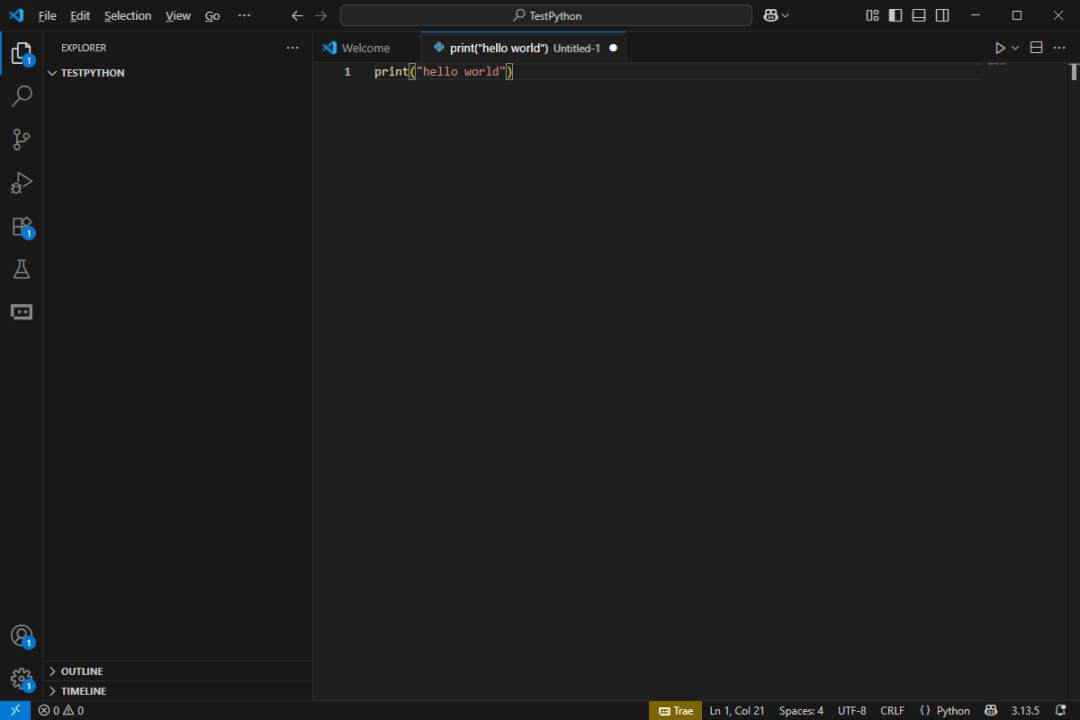 5. Add a few more lines of code and set breakpoints in the source code. Method: Click once on the left side of the editing area, next to the line number (a red solid circle will appear), as shown in the figure below, where breakpoints are set on lines 2 and 3. (If there is already a breakpoint on that line, clicking again will remove the current line’s breakpoint.)
print(“hello world1”)
print(“hello world2”)
print(“hello world3”)
print(“the end”)
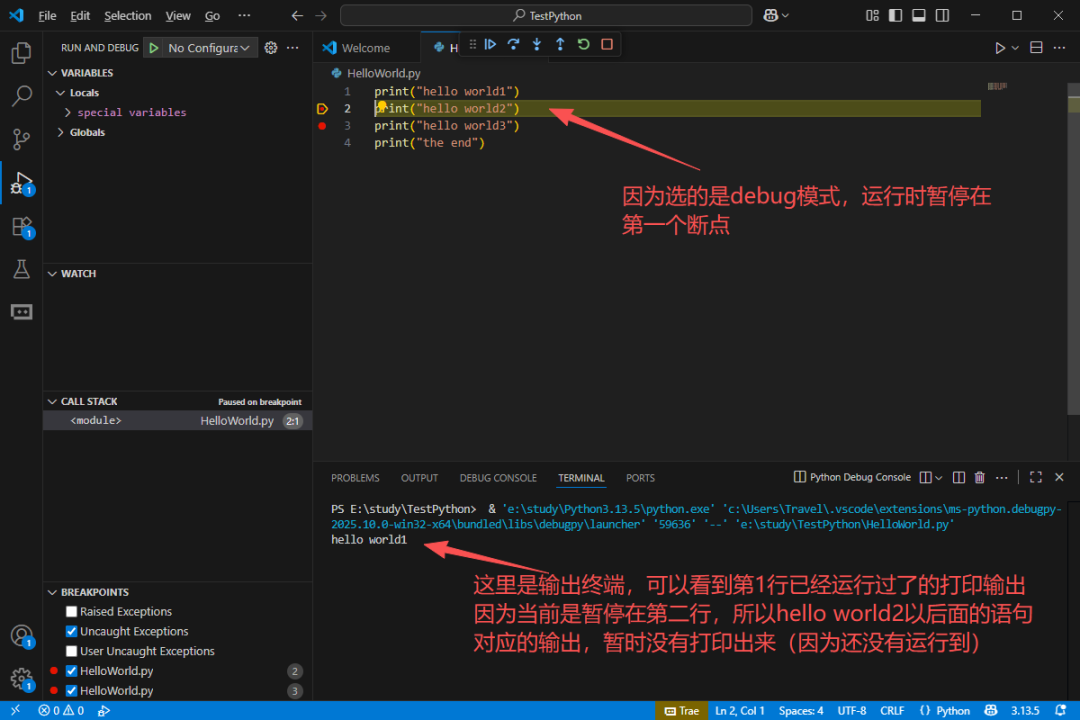
 6. Click to debug and observe the results. Make sure to select debug mode.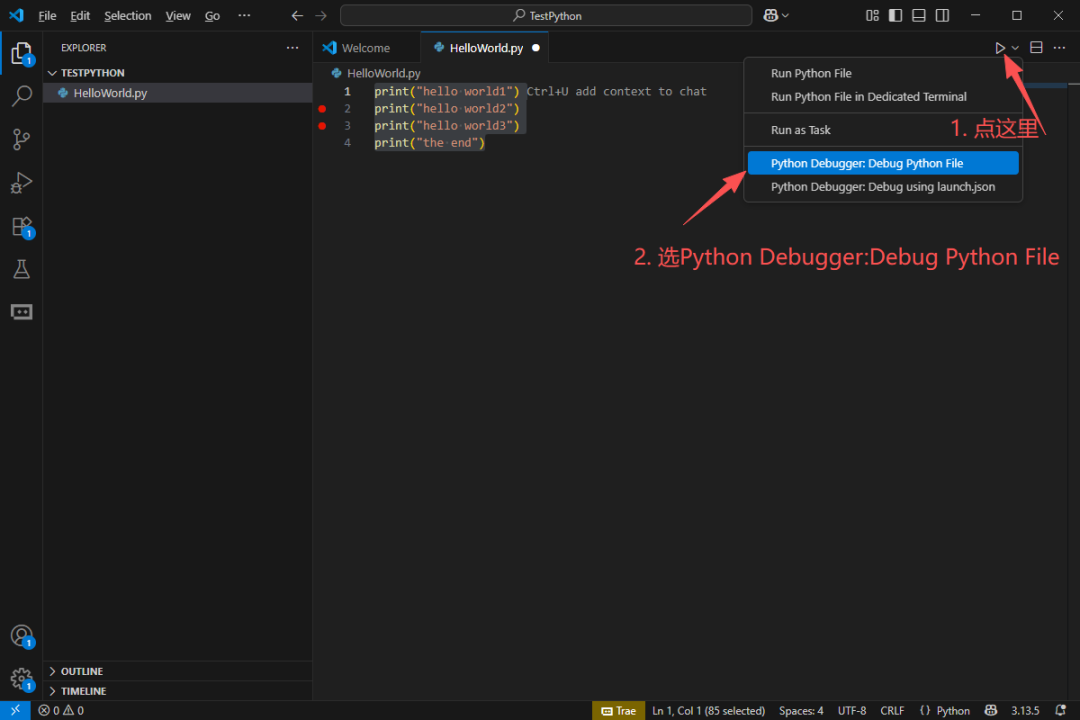
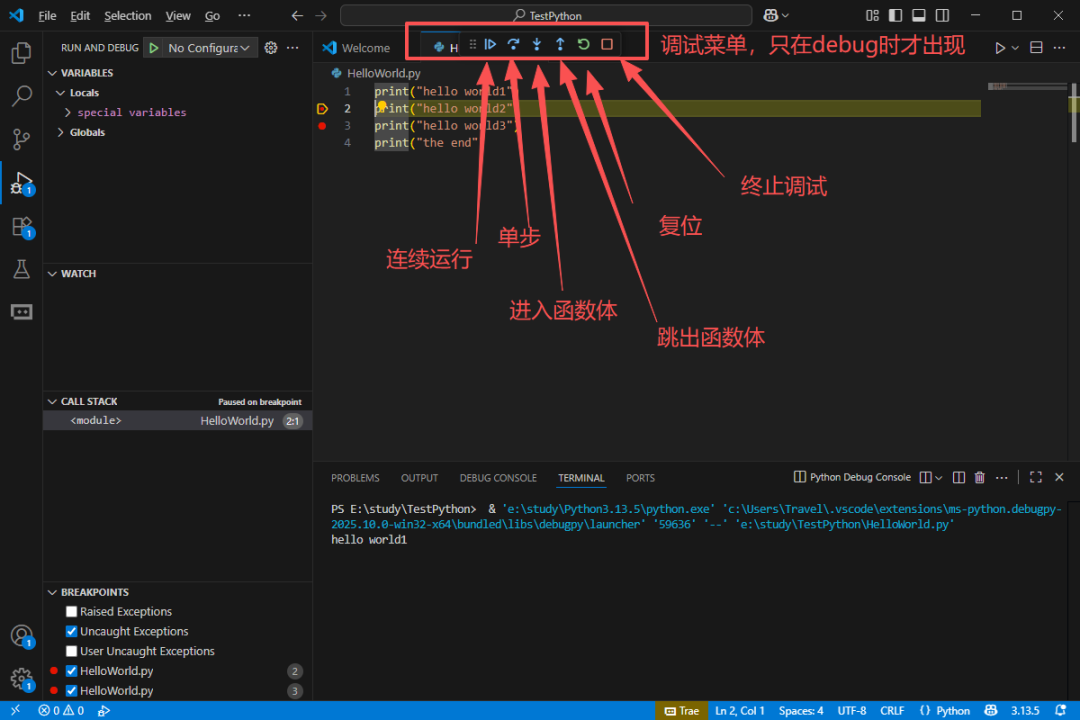
 7. Introduction to the debugging menu.Similar to most IDE environments, the functions include: continue, step over, step into, step out, restart, stop, etc.
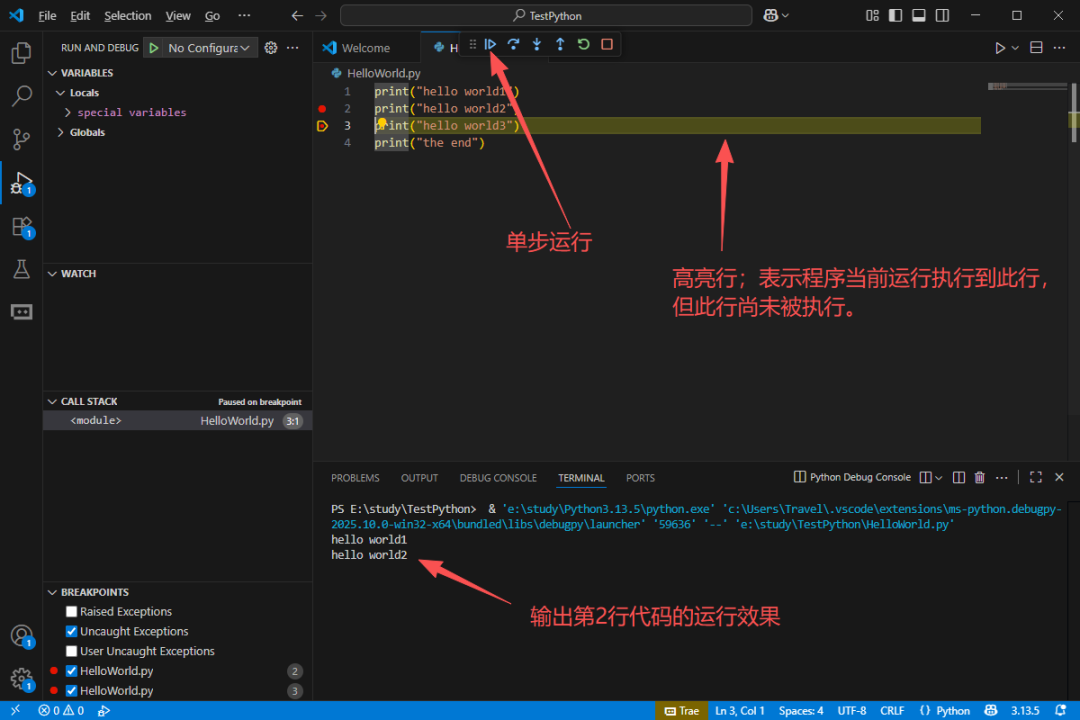
 8. The effect of stepping through the code. When stepping through, you can also view the value of specified variables in their current state to assist in debugging and analysis.
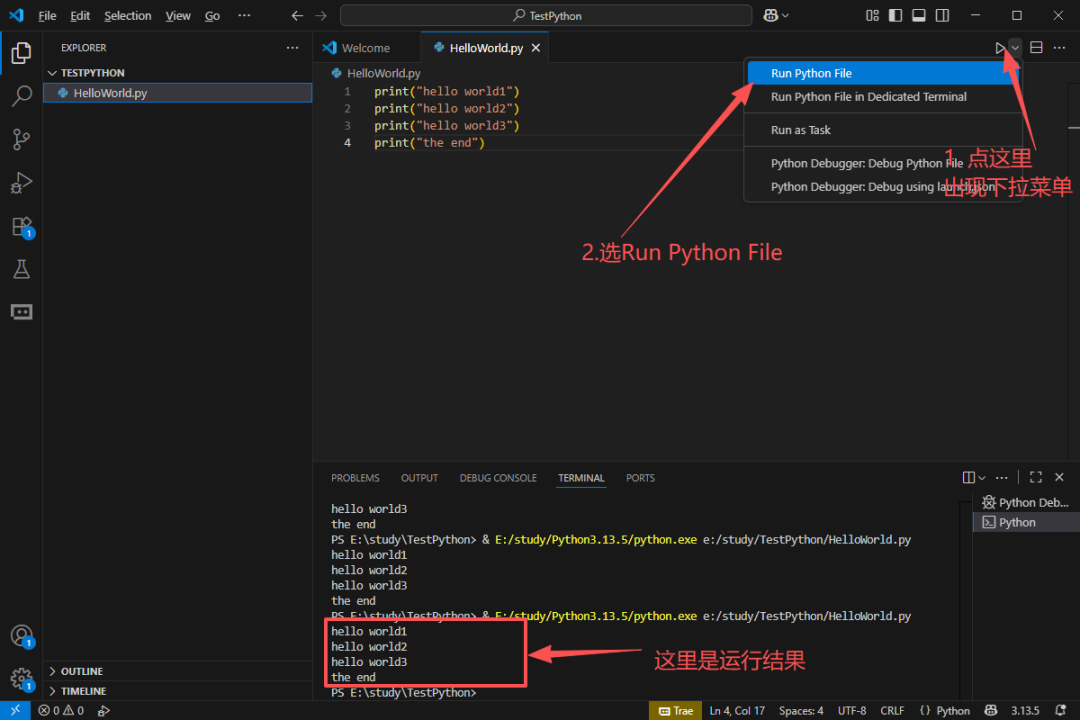
 9. Click run directly to see the execution results.
 The secret to learning programming is to practice more on the machine ^_^Original content is not easy to create; please follow, like, and share!