【Trust me: Developing with Ubuntu absolutely provides a professional experience and gives others the impression of expertise】
In this article, we will look at the process of debugging with gdb.
1. Environment Preparation:
Target System: STM32F407 Environmental Control Board,
Host Machine: Ubuntu + VSCode + arm-none-eabi-gdb + OpenOCD + ST-Link
2. Using arm-none-eabi-gdb
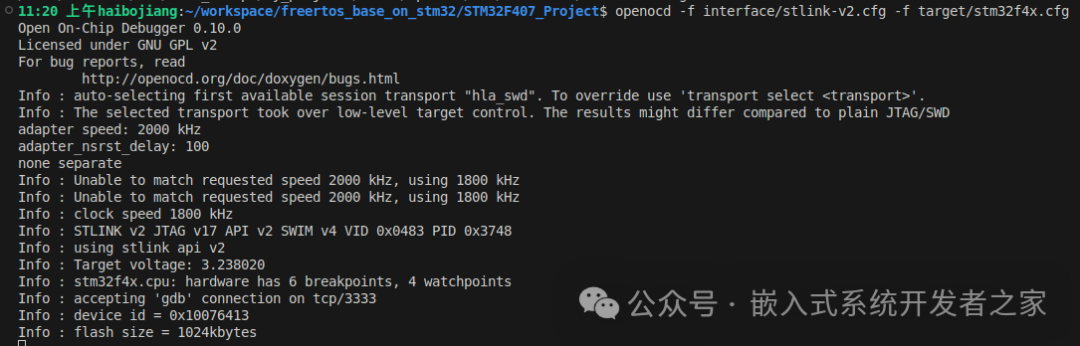
1. Create a new console in VSCode and start OpenOCD
2. Create another console in VSCode and start arm-none-eabi-gdb
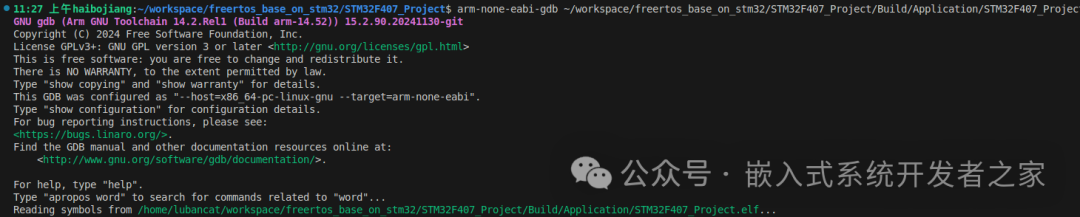
3. After starting arm-none-eabi-gdb, enable the graphical interface for debugging assistance


4. arm-none-eabi-gdb connects to OpenOCD via socket IPC

5. Reset the CPU

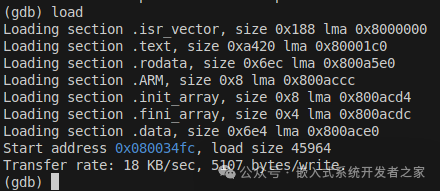
6. Load the ELF file
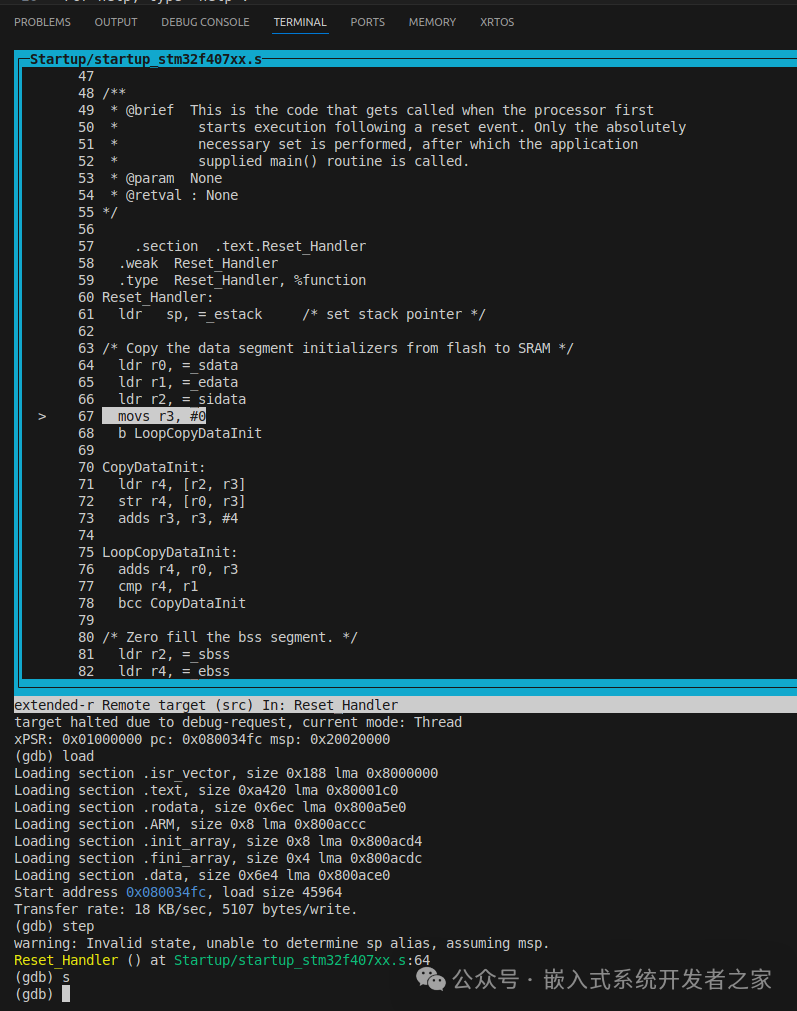
7. Step through the code and track the position in the code window
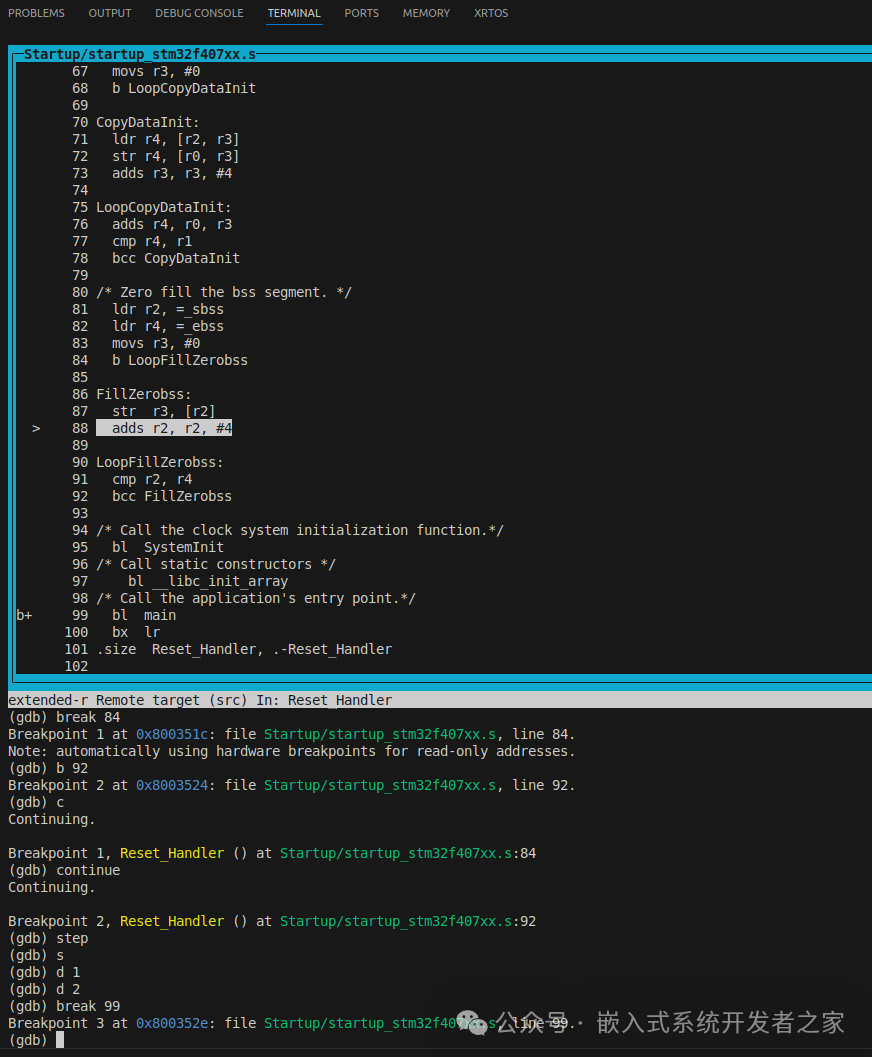
8. Set breakpoints (break/b line number), step execution (step/s), continue to breakpoint (continue/c), remove breakpoints (delete/d num), temporarily disable breakpoints (disable breakpoint number)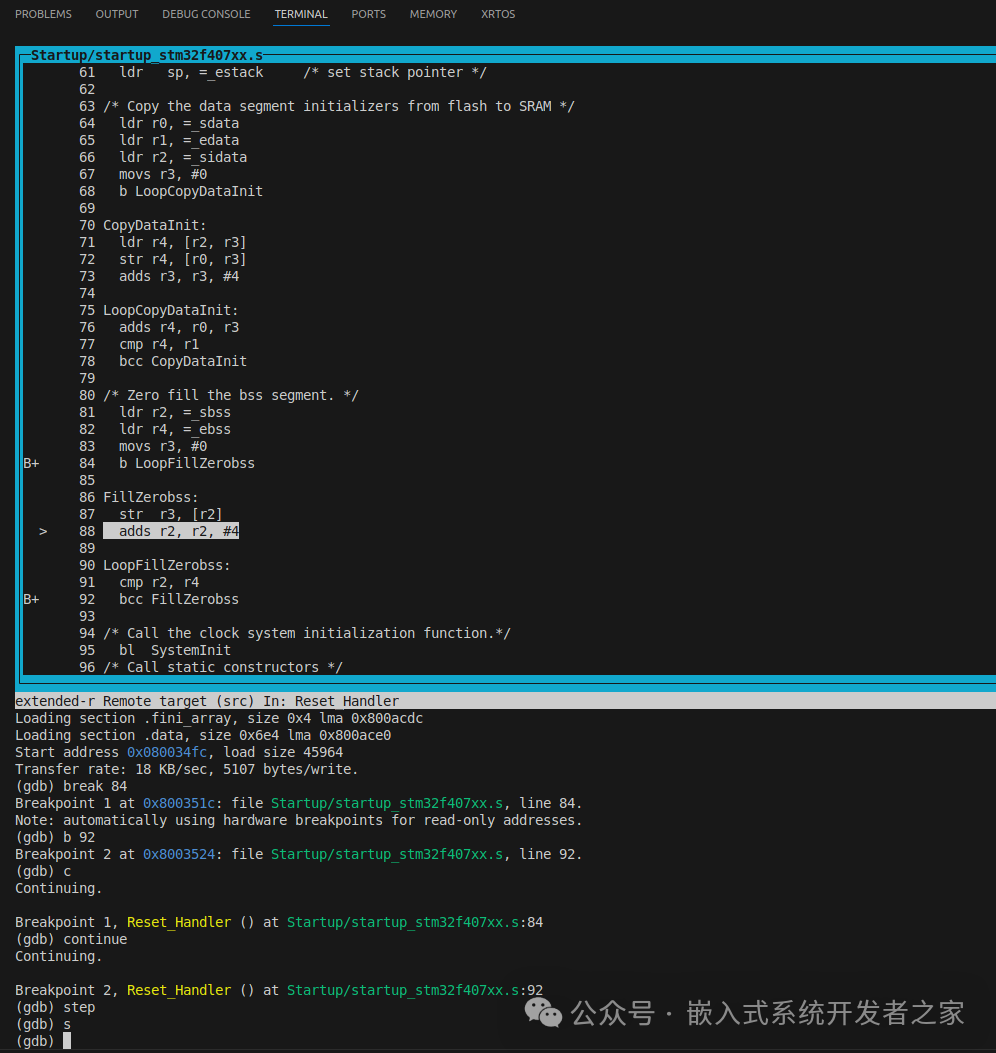
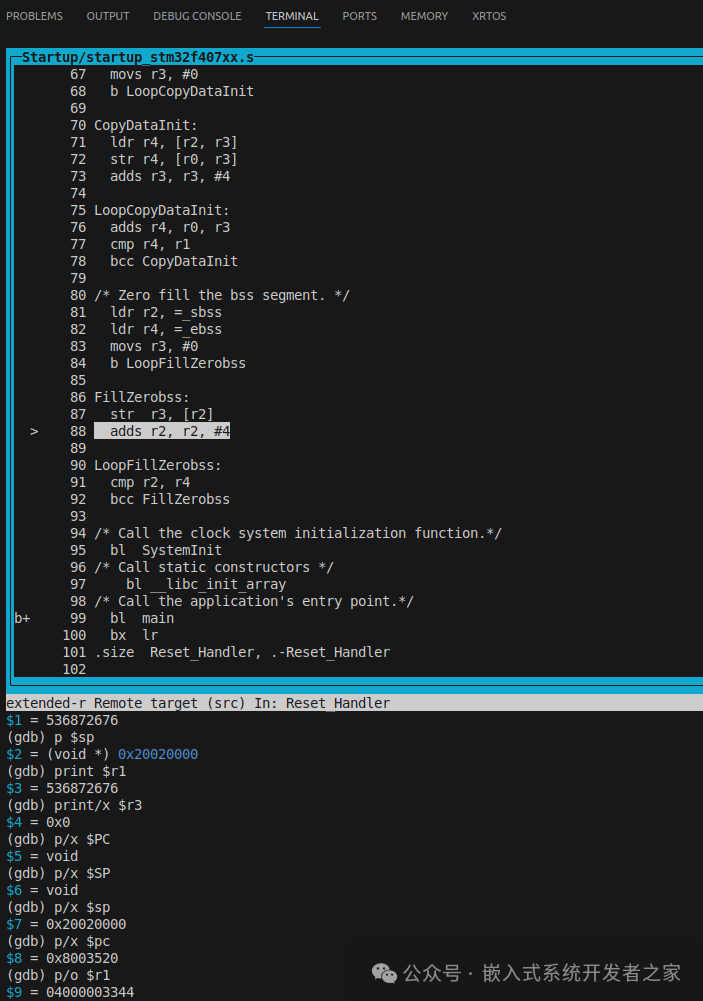
9. Print variable values (print/p)
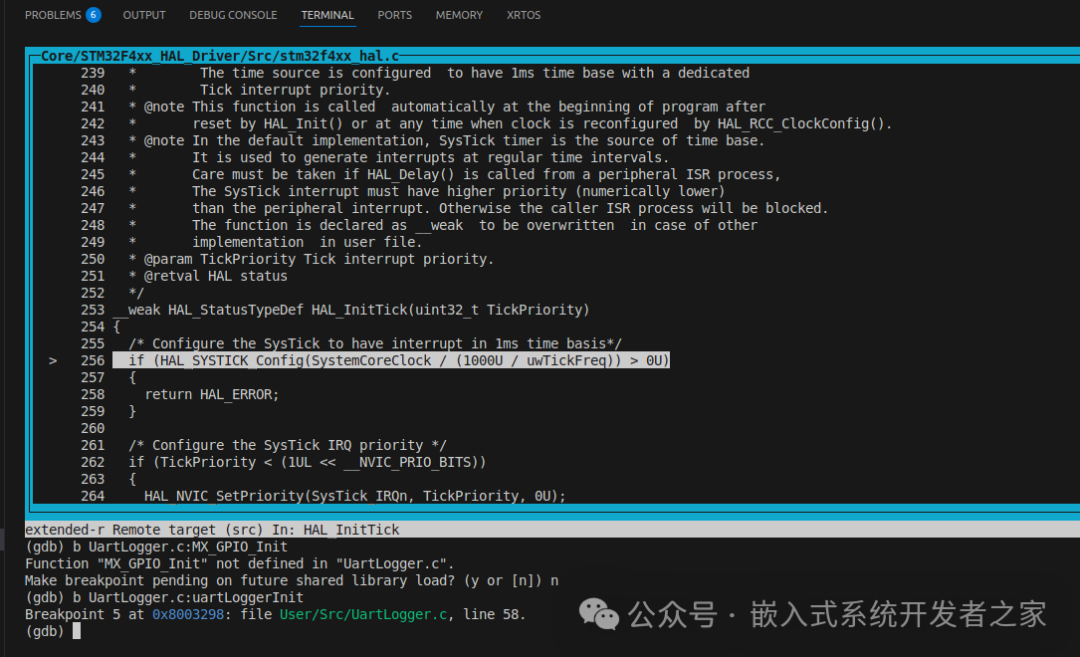
10. During debugging, the setting of breakpoints is very flexible; you can specify function names, how many lines within a function, or even specify functions by filename, etc.
In summary, once you become proficient with this set of tools, development will be just as effortless. The most important thing is: it’s free, so you don’t have to worry about someone coming to collect money! Also, for future development with ARMv7, ARMv8, and ARMv9, you won’t need to switch platforms!
Just a few minutes each day, and you can easily master it.