In the previous article, we discussed that the gas-phase interactions include electrostatic interactions. This tutorial describes the calculation of electrostatic interactions through electrostatic potential, commonly using ESPmax, ESPmin, and the positions of the electrostatic potential surface extrema to analyze reaction/binding sites/molecular polarity (Adv. Energy Mater. 2023, 13, 2300259). This article summarizes the steps for calculating electrostatic potential using Multiwfn as presented by Professor Lu Tian on the Computational Chemistry Community, focusing only on the key steps without detailing the installation and text editing necessary for first-time users. For first-time users, please refer to Professor Lu Tian’s tutorial on the Computational Chemistry Community, which is very detailed:http://sobereva.com/196;http://sobereva.com/443, the input files can be downloaded from Professor Lu Tian’s tutorial:http://sobereva.com/attach/443/file.rar.
1.Place 1.fch, bat and txt files in the Multiwfn installation path:

2.Use the surface vertex coloring method to display the molecular van der Waals surface electrostatic potential distribution map (choose either 2 or 3 as the drawing method).
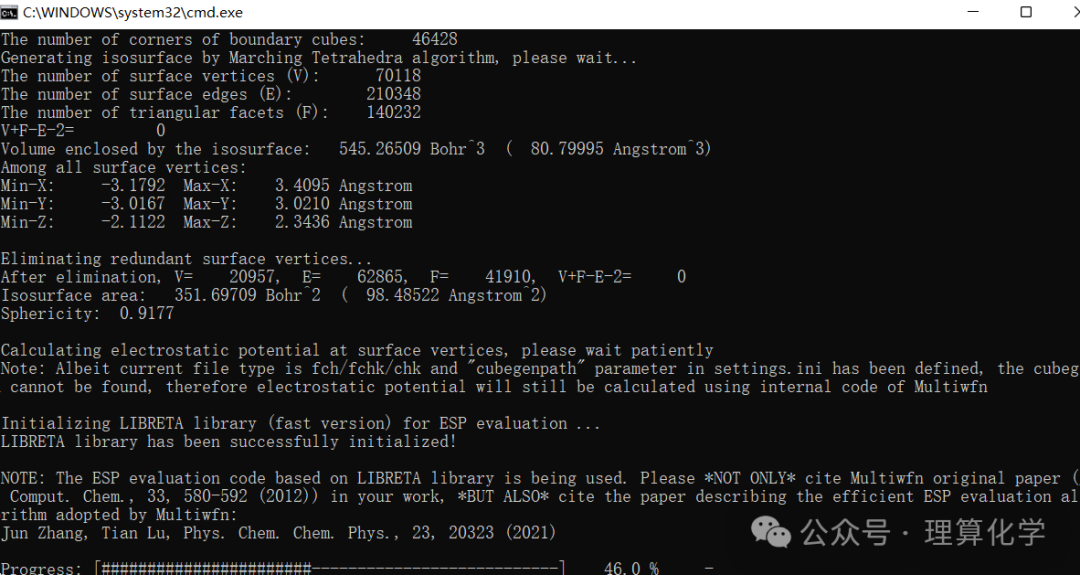
l Double-click ESPpt.bat, and the following page will appear:
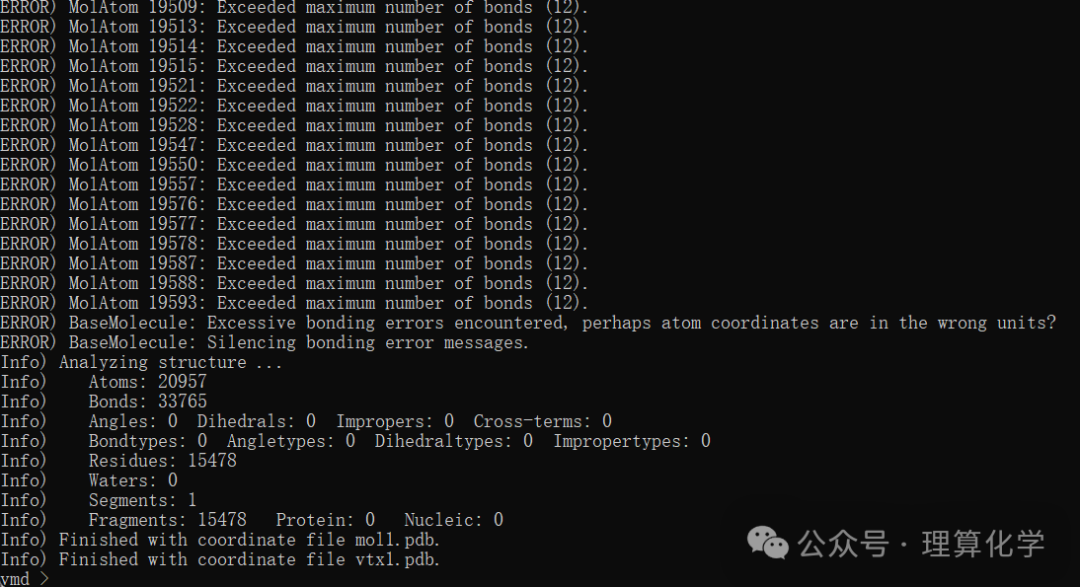
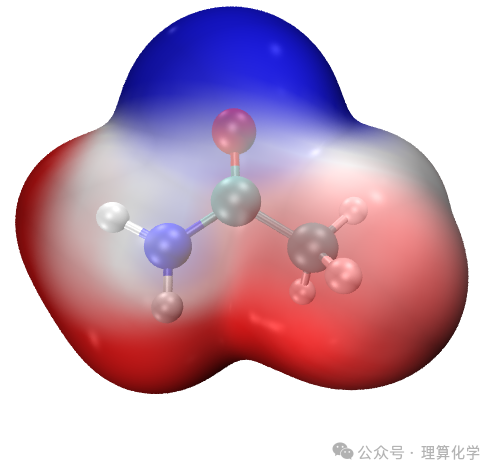
l Double-click to open VMD, input pt, and the following interface will appear. The right image shows the surface vertex coloring method displaying the molecular van der Waals surface electrostatic potential distribution.

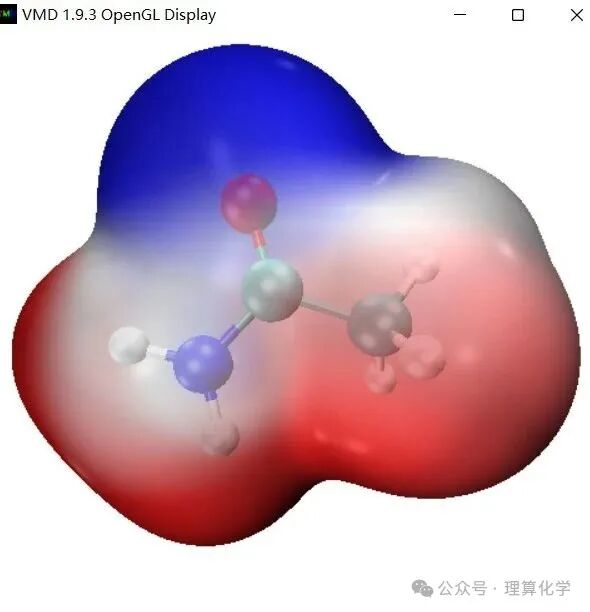
3.Coloring the electron density isosurface to display the molecular van der Waals surface electrostatic potential distribution map: double-click ESPiso.bat, reopen VMD, input iso (choose either 2 or 3 as the drawing method).
4.Display the color scale axis,
If you want to display the color scale axis, one method is to go to Graphics – Colors, select the Color Scale tab, then take a screenshot of the color scale bar, rotate and stretch it using Photoshop, and label the upper and lower limit values.
Another method is to first display the electrostatic potential map, then in VMD select Extensions – Visualization – Color Scale Bar, set Autoscale to On, and select density1.cub next to Use Molecule (assuming you are displaying the electrostatic potential colored molecular surface using the iso command), and select Isosurface for Use Representation. Set Color of labels to black, Label format to Decimal, and then click Draw Color Scale Bar. In the VMD Main window, double-click to set all items except the Color Scale Bar to black to fix them, then double-click the Color Scale Bar to change it to red to make it movable. Then click on VMD in the OpenGL graphics window to activate it, press t to enter the perspective translation mode, hold the mouse to drag the color scale bar to the appropriate position. After that, press r to return to the default rotation mode, and in the VMD Main window, double-click the Color Scale Bar to fix it to black, while changing the F of other systems to red to unlock them. The final effect is as shown below:

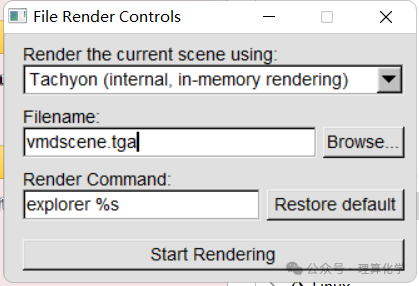
5.Rendering, File-Render-Tachyon-Start Rendering, vmdscene.tga the image will be automatically saved in VMD, and can be changed to .bmp or other image formats. The right image is the rendered image.
6. Reading ESPmax and ESPmin.
Open 1.fch
After starting Multiwfn, input the following:
12 // Quantitative Molecular Surface Analysis 0 // Start Calculation
The following values are ESPmax and ESPmin, which can be used to change the VMD display colors based on the following values, as shown in the image below:

