1. The “Dual Life” of Performance and Cash Flow
Recently, the semi-annual report of PCB equipment leader Dazhu CNC caught my attention: revenue increased by 52%, and net profit soared by 83%! In the current market environment, these figures are indeed striking. However, as I continued to read, I discovered a glaring number: the net operating cash flow was -551 million yuan, a year-on-year decline of 344.85%.
This reminded me of a classic paradox in the investment world: the coexistence of performance growth and deteriorating cash flow. On the surface, the company has indeed seized the opportunities brought by the AI wave, with revenue from drilling equipment increasing by 72%, accounting for more than 70% of total revenue.
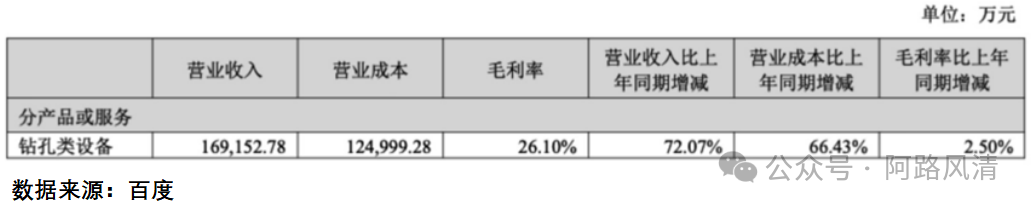
However, a deeper analysis reveals that accounts receivable have reached 3.231 billion yuan, accounting for 37.45% of total assets; inventory has reached 1.376 billion yuan, an increase of over 50% since the beginning of the year.
This leads me to ponder: in the current hot AI concept, are we too focused on superficial performance growth while neglecting the more essential cash flow situation?
2. Investment Anxiety in the Age of Information Explosion
In this era of data overload, we are bombarded with various information every day. Dazhu CNC’s semi-annual report serves as a mirror, reflecting the common dilemma faced by contemporary investors: the more we know, the more anxious we become.
When holdings surge, we worry about whether to sell; when holdings do not rise, we worry about whether to switch; when we make money, we worry about taking profits, and when we lose money, we worry about cutting losses. This anxiety is particularly evident in the case of Dazhu CNC: seeing an 83% increase in net profit, would you be tempted? But upon seeing a 344% decline in cash flow, would you hesitate?
This anxiety is not without reason. Most investors judge the market by focusing solely on stock price fluctuations: a rise indicates buyer dominance, while a fall indicates seller dominance. However, the actual situation is much more complex. As my quantitative system shows, market trading behavior goes far beyond simple buying and selling.
3. Unveiling the “Four Color Code” of Market Behavior
In my quantitative system, market behavior is clearly divided into four dominant forces:
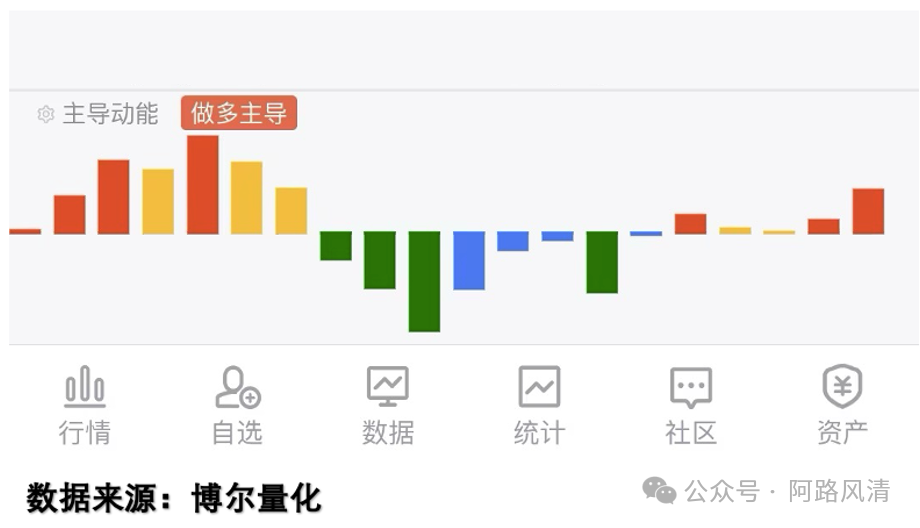
- Red Bar: “Bullish Dominance”, stock prices mostly rise
- Yellow Bar: “Profit Taking”, bullish funds begin to realize profits
- Green Bar: “Bearish Dominance”, stock prices mostly fall
- Blue Bar: “Short Covering”, bearish funds buy back
Among these, “profit taking” and “short covering” are the most critical, as they often signal potential trend reversals. In the case of Dazhu CNC, while performance appears to have surged positively, does the deteriorating cash flow represented by the “yellow bar” signal that institutions are quietly “taking profits”?
4. The “Two Fears” in a Bull Market and Their Solutions
In a bull market, there are two fears: the fear of missing out and the fear of chasing highs. These two often cause a causal relationship, trapping investors in an awkward position of wanting both but fearing both. However, the root of the problem lies not in psychological quality, but in being misled by stock price trends.
Consider this case:
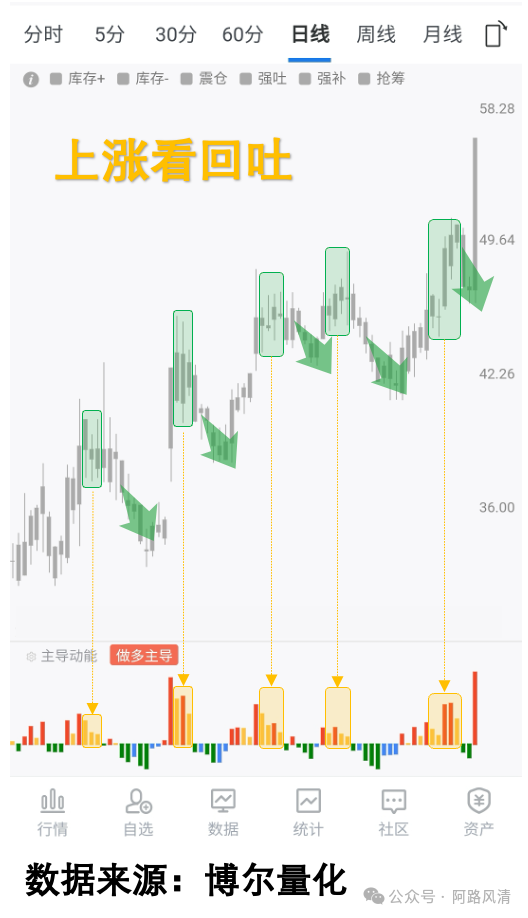
During the rise of this stock, five instances of concentrated “profit taking” corresponded to stage highs. If one could remain cautious at these points, they would not fall into the trap of chasing highs. This is what I summarize as “watch for profit taking during rises, do not rush to take profits”.
Some may argue: not chasing highs means missing out on the trend. But looking at the adjustment after the first profit taking, the stock price nearly fell back to the starting point. At that time, could you really remain calm and hold on?
5. Capturing Opportunities in Downtrends
Similarly, in a downtrend, “short covering” often signals a turning point:
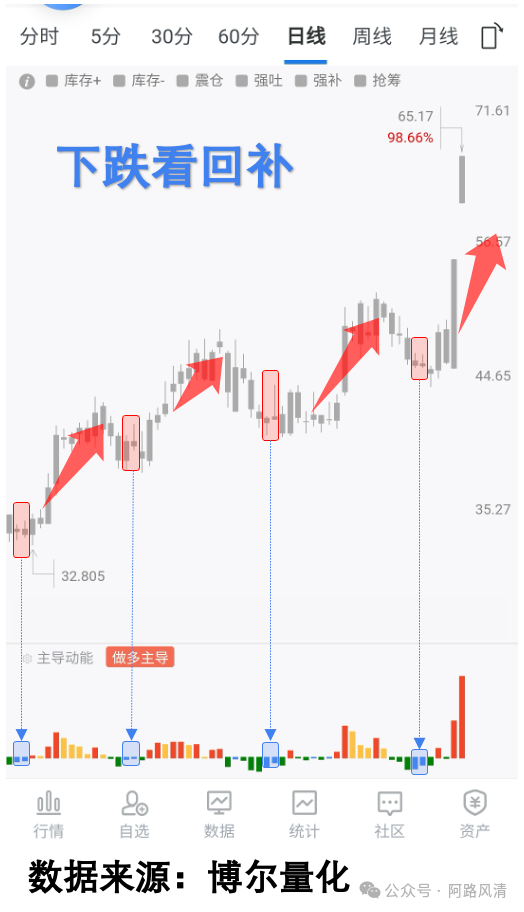
In the image, four instances of “short covering” all occurred near stage lows. This indicates that although stock prices are still adjusting, trading willingness has changed. This is the essence of “watch for short covering during declines, do not panic during covering”.
Returning to the case of Dazhu CNC, although the cash flow data does not look good, if one can observe the true movements of institutional funds, perhaps they can respond more calmly.
6. Returning to Essence: Using Data to Penetrate the Fog
The case of Dazhu CNC tells us that investment cannot be based solely on surface data. Just like the PCB equipment industry, while benefiting from the growth in AI server demand, we must also be wary of the risks brought by increasing accounts receivable and inventory.
In this era of information overload, finding the right analytical tools may be the best way to combat anxiety.
AI has indeed brought new growth points to the PCB industry, with Prismark predicting a compound annual growth rate of 22.1% for related capacity from 2024 to 2029. However, Dazhu CNC’s cash flow dilemma also reminds us not to overlook the fundamentals while chasing hot trends.
Investing is like playing chess; one cannot only look at the immediate move. By using quantitative tools to see through the “four color code” of funds, we may help ourselves seize opportunities in the AI wave without blindly following the trend.
Disclaimer:
All information mentioned in this article comes from public channels. If there are any copyright issues, please contact for removal.
I do not recommend any specific stocks, nor do I provide operational advice.