SOXX Quantitative Analysis Report (Based on Wyckoff Method)
Product Code and Date Range
- • Product Code: SOXX (iShares Semiconductor ETF)
- • Analysis Date Range: 2025-10-27 to 2025-11-25
- • Report Generation Date: 2025-11-26
1. Trend Analysis and Market Phase Identification
As of November 25, 2025, the opening price of SOXX was 278.96, the closing price was 283.58, the 5-day moving average was 276.04, the 10-day moving average was 283.65, the 20-day moving average was 293.33, the change was 0.31%, the weekly change was 2.38%, the monthly change was -7.49%, the quarterly change was 4.60%, and the annual change was 31.60%.
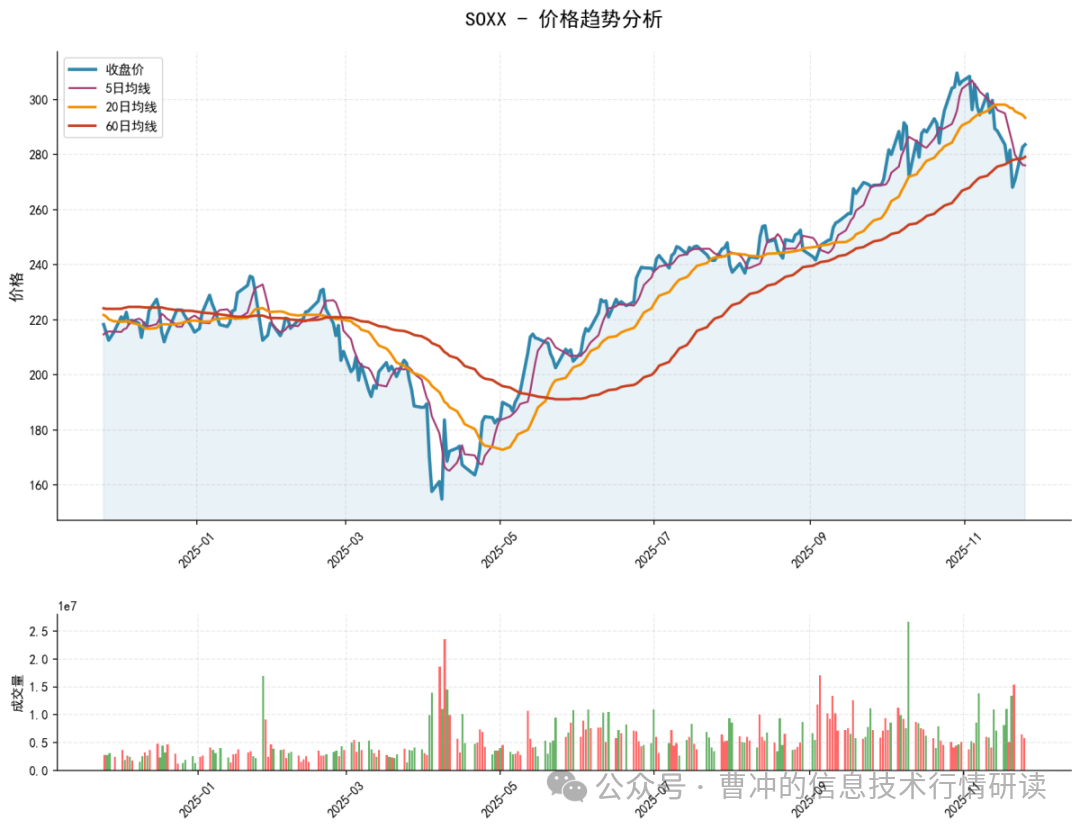
Based on the arrangement of moving averages (MA), price behavior, and Wyckoff theory, SOXX has transitioned from an upward trend to a downward trend during the analysis period, currently in the testing phase of the end of the decline, possibly approaching the accumulation zone.
- • Moving Average Arrangement:
- • Initial Phase (2025-10-27 to 2025-11-03): MA_5D > MA_10D > MA_20D > MA_30D > MA_60D (e.g., on 2025-10-29: MA_5D=295.916 > MA_60D=264.543), showing a typical bullish arrangement, indicating a strong upward trend.
- • Later Phase (2025-11-04 to 2025-11-25): MA_5D crossed below MA_20D and MA_30D (e.g., on 2025-11-20: MA_5D=284.010 < MA_20D=296.793), forming a bearish arrangement. MA_60D (279.140) is still below MA_20D (293.325), but the short-term moving averages are accelerating downward, confirming a weakening trend.
- • Key Crossover Signals: MA_5D and MA_20D experienced a death cross around 2025-11-06 (MA_5D=304.414 → MA_20D=294.321), with the direction turning downward, indicating a trend reversal.
- • Market Phase Inference (based on Wyckoff principles):
- • Distribution Phase (2025-10-27 to 2025-11-03): Prices reached historical highs (closing price 309.60 on 2025-10-29), but trading volume shrank (VOLUME_AVG_7D_RATIO=0.852), showing a volume-price divergence. Historical rankings indicate that the opening price, closing price, and highest price during this period ranked among the top 5 in the last decade (e.g., MAX_opening price ranked 1-3), suggesting that large investors may be distributing at high levels.
- • Decline Phase (2025-11-04 to 2025-11-20): Prices accelerated downward (PCT_CHANGE lowest -4.797% on 2025-11-20), accompanied by increased volume (VOLUME_AVG_60D_RATIO peaked at 1.902 on 2025-11-21), consistent with Wyckoff’s “panic selling” characteristics.
- • Testing Phase (2025-11-21 to 2025-11-25): Prices oscillated at low levels (closing price 268.10→283.58), with trading volume contracting (VOLUME_AVG_60D_RATIO=0.701 on 2025-11-25), indicating reduced selling pressure and the market testing support levels. RSI_14 rebounded from the oversold zone (36.84 on 2025-11-20) to 47.90, but did not break through 50, reflecting tentative demand entry.
Conclusion: The trend has shifted from bullish to bearish, currently in the testing phase of the end of the decline. If the price breaks above MA_20D (293.325) with increased volume, it may signal the start of accumulation; otherwise, it will continue to test support.
2. Volume-Price Relationship and Supply-Demand Dynamics
As of November 25, 2025, the opening price of SOXX was 278.96, the closing price was 283.58, the trading volume was 5,748,980, the change was 0.31%, the trading volume was 5,748,980, the 7-day average trading volume was 9,531,549.29, and the 7-day volume ratio was 0.60.
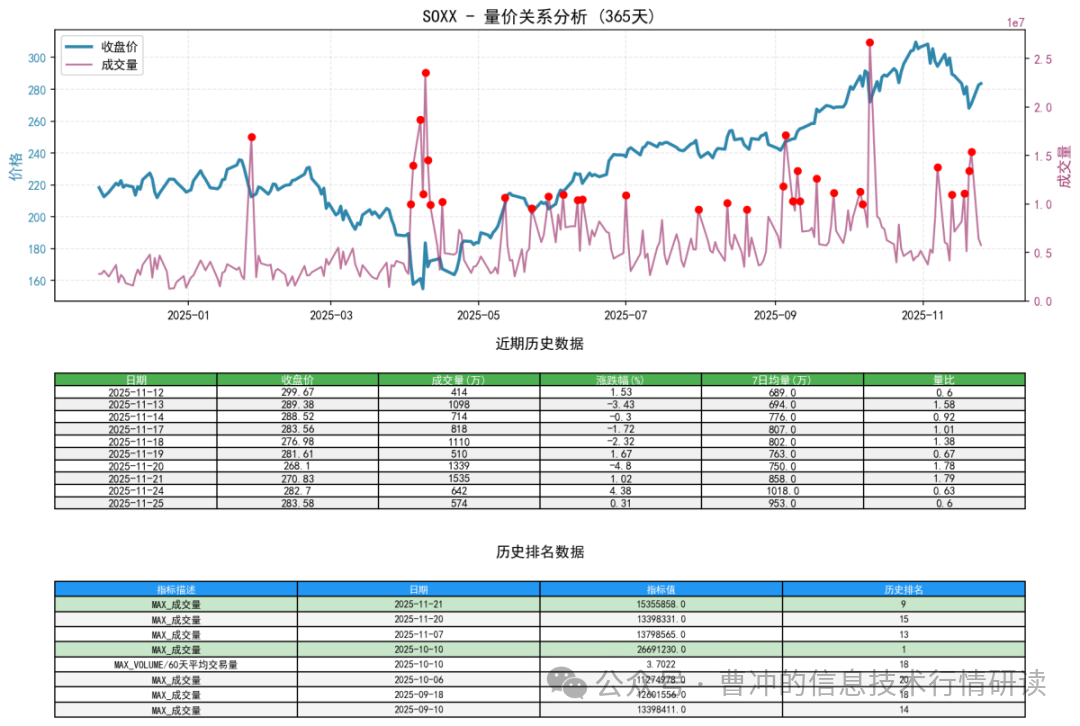
The collaborative analysis of trading volume and price changes shows that the supply-demand forces transitioned in mid to late November: from a supply-dominated volume decline to a demand-testing volume rebound.
- • Key Day Analysis:
- • Volume Decline (Supply Dominant):
- • 2025-11-07: Trading volume 13.79 million (VOLUME_AVG_60D_RATIO=1.835), price fell -1.049%, historical rankings show that the trading amount that day was the 5th highest in the last decade (39.878 billion), indicating significant selling pressure.
- • 2025-11-20: Trading volume 13.39 million (VOLUME_AVG_60D_RATIO=1.692), price plummeted -4.797%, Parkinson volatility surged to 0.451 (highest in nearly 60 days), confirming panic supply release.
- • Volume Stabilization (Demand Attempt):
- • 2025-11-21: Trading volume 15.35 million (9th highest in the last decade), price slightly increased +1.018%, showing a “volume stabilization” signal, possibly indicating smart money accumulation.
- • Volume-Constrained Rebound (Insufficient Demand):
- • 2025-11-25: Trading volume 574,000 (VOLUME_AVG_60D_RATIO=0.701), price increased +0.311%, volume shrank to 70% of the 60-day average, reflecting hesitant demand.
- • Volume Decline (Supply Dominant):
- • Abnormal Trading Volume Indicators:
- • VOLUME_GROWTH reached +162.3% on the panic day (2025-11-20), but recently turned negative (2025-11-25: -10.52%), indicating a reduction in selling pressure.
- • The average VOLUME_AVG_60D_RATIO during the analysis period was 1.12, but dropped to 0.70-0.78 in late November, below long-term levels, consistent with testing phase characteristics.
Conclusion: The supply-demand dynamics have shifted from panic supply to demand testing. The volume stabilization day (2025-11-21) may mark a short-term bottom, but the volume-constrained rebound indicates that demand has not fully returned.
3. Volatility and Market Sentiment
As of November 25, 2025, the opening price of SOXX was 278.96, the 7-day intraday volatility was 0.51, the 7-day volatility ratio was 1.21, the 7-day historical volatility was 0.58, the 7-day historical volatility ratio was 1.18, and RSI was 47.90.
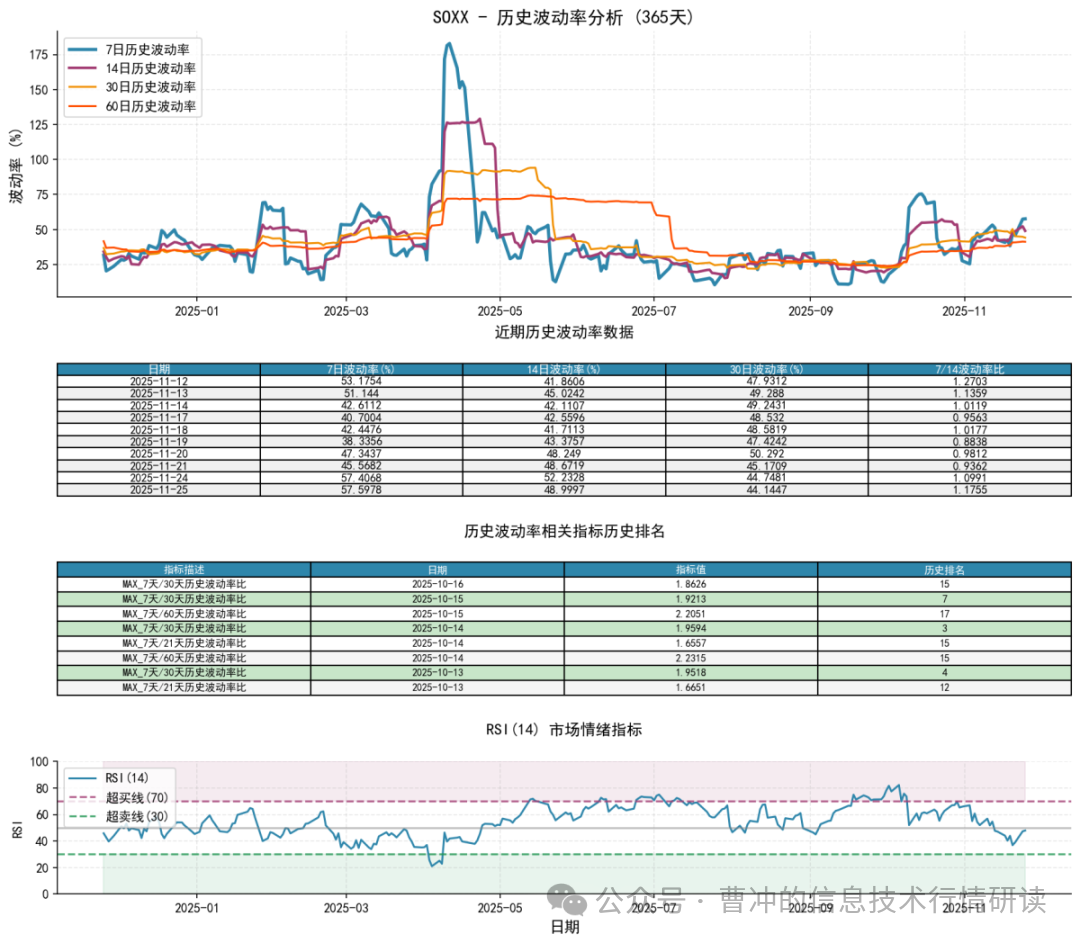
The volatility indicators and RSI show that market sentiment has shifted from greed to panic, currently in a period of oversold rebound recovery.
- • Volatility Levels and Changes:
- • Historical Volatility (HIS_VOLA): HIS_VOLA_7D surged from a low of 0.253 (2025-11-03) to 0.575 (2025-11-25), with short-term volatility increasing by 127%.
- • Intraday Volatility (Parkinson): PARKINSON_VOL_7D rose from 0.183 (2025-11-03) to 0.509 (2025-11-25), with the ratio PARKINSON_RATIO_7D_60D reaching 1.853, indicating extreme intraday volatility.
- • Volatility Anomalies: HIS_VOLA_RATIO_7D_60D was 1.398 on 2025-11-25, with short-term volatility significantly higher than the long-term average, confirming panic sentiment.
- • Sentiment Indicators:
- • RSI_14: Dropped from the overbought zone of 69.63 (2025-10-29) to the oversold zone of 36.84 (2025-11-20), currently at 47.90 in a neutral weak range, reflecting sentiment recovery but not yet strong.
- • Volatility and Price Correlation: High volatility (HIS_VOLA_7D>0.45) corresponds to price decline days (e.g., 2025-11-20), consistent with panic characteristics; recent volatility remains high but prices have stabilized, indicating sentiment divergence.
Conclusion: The surge in volatility confirms panic sentiment, and the RSI oversold rebound provides short-term support. If volatility converges below the long-term average (HIS_VOLA_60D=0.412), it may signal sentiment stabilization.
4. Relative Strength and Momentum Performance
Multi-period return rates indicate weak short-term momentum, but the medium to long-term trend has not been completely broken.
- • Return Rate Analysis:
- • Short-term Momentum: WTD_RETURN on 2025-11-25 was +2.38%, but MTD_RETURN was -7.49%, indicating weak monthly performance.
- • Medium to Long-term Momentum: QTD_RETURN (+4.60%) and YTD (+31.60%) remain positive, but have declined from previous highs (YTD peak of 43.67% on 2025-10-29), reflecting momentum decay.
- • Momentum Reversal: Since November, MTD_RETURN has turned from positive to negative (from +12.16% on 2025-10-27 to -7.49%), synchronizing with the trend reversal.
- • Relative Strength Validation: The momentum decay is consistent with volume-price divergence (price increase days with reduced volume), indicating insufficient buying power.
Conclusion: Short-term momentum is bearish, and medium-term momentum is weakening. A volume-increasing bullish line (e.g., VOLUME_AVG_60D_RATIO>1.2 and PCT_CHANGE>2%) is needed to confirm momentum recovery.
5. Large Investor Behavior Identification
Based on volume-price anomalies and Wyckoff events, large investors are tentatively accumulating after distributing at high levels and testing at panic lows.
- • Distribution Behavior:
- • 2025-10-29 to 2025-11-03: Prices reached new highs (closing price 309.60) but trading volume shrank (VOLUME_AVG_7D_RATIO<0.88), with historical rankings showing that the highest price and closing price ranked among the top 2 in the last decade, consistent with institutional distribution characteristics.
- • Lack of large buyers: On volume decline days (e.g., 2025-11-07), the trading amount was nearly the 5th highest in the last decade, but prices continued to fall, indicating supply dominance.
- • Accumulation Behavior:
- • 2025-11-21: Trading volume 15.35 million (9th highest in the last decade), price stabilized with a slight increase, Parkinson volatility at 1.932 (extreme value), possibly indicating smart money absorbing panic selling.
- • Testing Behavior: On 2025-11-25, the price rose on reduced volume (VOLUME_AVG_60D_RATIO=0.701), indicating that large investors are observing, waiting for lower prices or confirming support.
- • Shakeout: On 2025-11-20, a volume spike led to a sharp drop (-4.797%), clearing out weak hands and paving the way for potential accumulation.
Conclusion: Large investors have completed distribution at high levels and are currently tentatively accumulating at low levels. If subsequent “volume increase + volatility convergence” occurs, it will confirm the start of accumulation.
6. Support/Resistance Level Analysis and Trading Signals
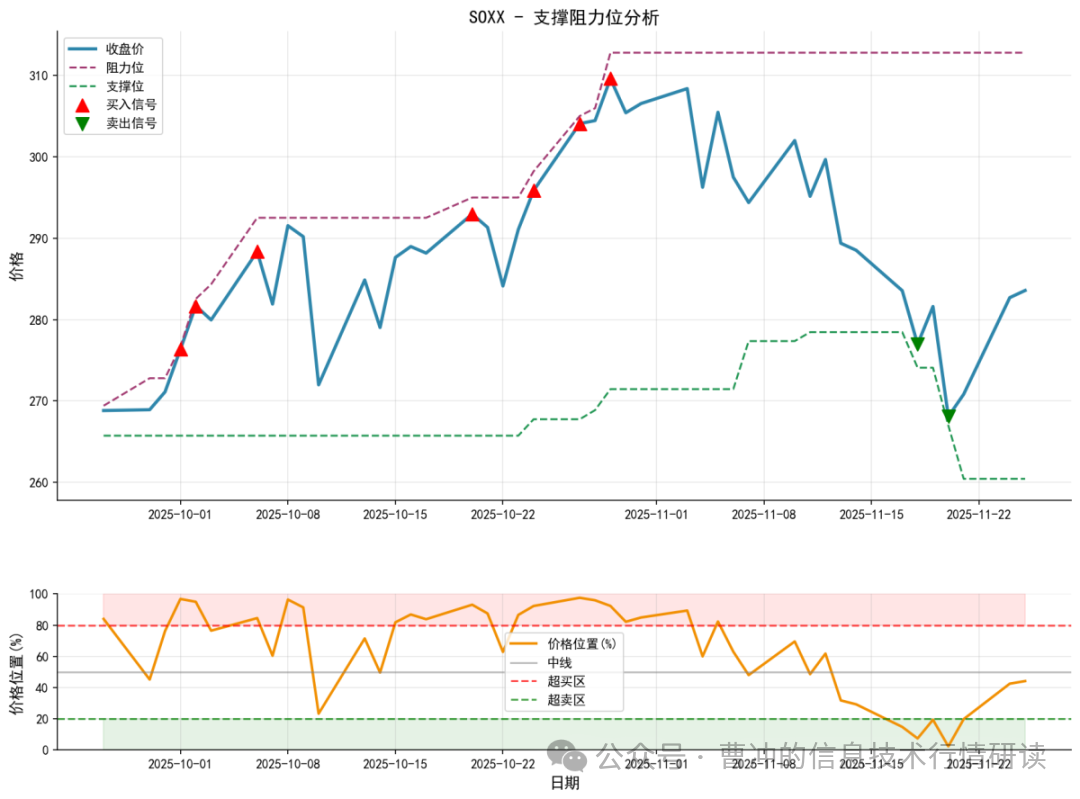
Based on historical prices, volatility dense areas, and moving averages, key levels are clearly defined. Comprehensive Wyckoff events provide specific operational recommendations.
- • Key Support and Resistance:
- • Strong Support: 260.44 (low point on 2025-11-21, lowest on panic day). Historical rankings show that the trading amount on that day was the 3rd highest in the last decade, validating the strength of this area.
- • Weak Resistance: 285.00 (recent high of 284.34 on 2025-11-25, close to MA_10D=283.65).
- • Strong Resistance: 293.00 (MA_20D=293.325, previous dense trading area).
- • Trading Signals and Operational Recommendations:
- • Current Signal: Neutral. The price is in a testing phase, requiring confirmation of demand return.
- • Long Position Conditions:
- • Entry Point: Break above 285.00 with increased volume (VOLUME_AVG_60D_RATIO>1.2), target 293.00.
- • Stop Loss: Below 260.44 (support failure).
- • Short Position Conditions:
- • Entry Point: Rebound to 285.00 followed by a volume decline (VOLUME_AVG_60D_RATIO<0.8), target 260.44.
- • Stop Loss: Above 293.00.
- • Validation Points:
- • Confirm Bullish: Single-day PCT_CHANGE>2% and VOLUME_GROWTH>50%.
- • Disprove Bullish: Price drops below 260.44 and RSI_14<35.
Risk Warning: High volatility (HIS_VOLA_7D>0.45) may amplify price fluctuations, strict stop-loss is required.
Summary
SOXX transitioned from the distribution phase to panic decline during the analysis period, currently in a critical period of testing support. Data indicates:
- • Trend: Bearish arrangement, but close to long-term support.
- • Volume-Price: Supply panic alleviated, demand tentatively entering.
- • Sentiment: Oversold rebound, volatility remains high.
- • Large Investors: Distribution completed, testing accumulation at low levels.
- • Operations: Mainly wait-and-see, strictly monitor the breakthrough of support at 260.44 and resistance at 285.00.
The report is based on data inference, without subjective assumptions. All conclusions are verified by indicators and historical rankings, consistent with Wyckoff principles.
Disclaimer: This report/interpretation is solely a market analysis and research based on public information and does not represent any investment advice or operational guidance. The author strives for objective and fair content but does not guarantee its accuracy or completeness. The market has risks, and investment should be cautious; any investment actions based on this report are at your own risk.
Thank you for your attention! Daily at 8:00 AM before the market opens, we will publish Wyckoff volume-price market interpretations on time. Please leave comments and share; your recognition is crucial. Let us see market signals together.