Advanced MATLAB (8): Creating Bubble Charts

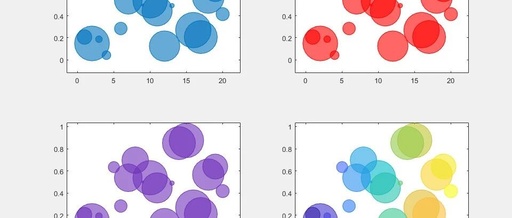
Long time no see, friends. In the last issue, we shared the method for creating scatter plots. In this issue, we will share a special method for creating scatter plots—bubble charts. A bubble chart is an enhanced version of a scatter plot. A regular scatter plot can only express the relationship between the x-axis and … Read more