TRAVEL Follow us on “Cloud Dragon Sect”关注我们
 Content A bubble chart is a multivariate data visualization tool that adds a third dimension (bubble size) to a two-dimensional scatter plot, and sometimes introduces a fourth dimension through color. Today, we will mainly introduce the use of MATLAB’s bubblechart function to draw bubble charts with practical examples.
 1. bubblechart Function
bubblechart syntax: bubblechart(x,y,sz) bubblechart(x,y,sz,c) bubblechart(tbl,xvar,yvar,sizevar) bubblechart(tbl,xvar,yvar,sizevar,cvar) bubblechart(ax,___) bubblechart(___,Name,Value) bc = bubblechart(___)Description
Vector and Matrix Data
bubblechart(x,y,sz) displays colored circular markers (bubbles) at the specified positions in vectors x and y, with bubble size specified by sz. To plot a set of coordinates, x, y, and sz must be equal-length vectors. To plot multiple sets of coordinates on the same axes, at least one of x, y, or sz must be specified as a matrix. bubblechart(x,y,sz,c) specifies the color of the bubbles. You can specify a single color for all bubbles or change the color. For example, you can draw all red bubbles by specifying c as "red".Table Data
bubblechart(tbl,xvar,yvar,sizevar) plots the variables xvar and yvar from table tbl, using variable sizevar to represent bubble size. To plot a dataset, specify one variable each for xvar, yvar, and sizevar. To plot multiple datasets, specify multiple variables for at least one of the parameters. The number of specified variables must be the same for those parameters. bubblechart(tbl,xvar,yvar,sizevar,cvar) uses the colors specified in variable cvar to plot the specified variables in the table. To specify colors for multiple datasets, cvar must be specified as multiple variables. The number of variables must match the number of datasets.Other Options
bubblechart(ax,___) displays the bubble chart in the target axes ax. Specify the axes before all other input parameters. bubblechart(___,Name,Value) specifies BubbleChart properties using one or more name-value pairs. Specify properties after all other input parameters. For a list of properties, see BubbleChart properties. bc = bubblechart(___) returns the BubbleChart object. After creating the chart, use bc to modify chart properties. For a list of properties, see BubbleChart properties.
2. Example and Program
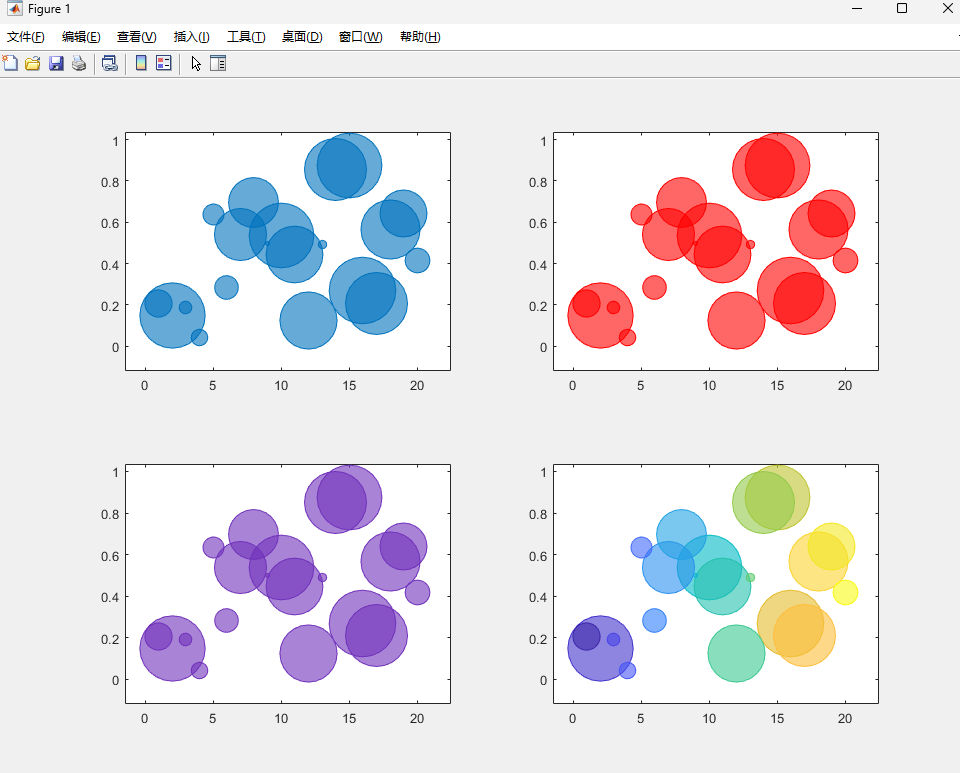
Example 1
Program
clc;clear all;close all;% Define bubble coordinates as vectors x and y. Define sz as a vector specifying bubble sizes. Then create a bubble chart defined by x and y. figure;subplot(2,2,1)x = 1:20;y = rand(1,20);sz = rand(1,20);bubblechart(x,y,sz);% Specify bubble color% Define bubble coordinates as vectors x and y. Define sz as a vector specifying bubble sizes.% Then create a bubble chart defined by x and y, specifying the color as red. By default, bubbles are partially transparent. subplot(2,2,2)bubblechart(x,y,sz,'red');% For custom colors, you can specify RGB triplets or hexadecimal color codes. For example, the hexadecimal color code '#7031BB' specifies purple. subplot(2,2,3)bubblechart(x,y,sz,'#7031BB');% You can specify a different color for each bubble. For example, specify a vector to select colors from the colormap of the figure. subplot(2,2,4)c = 1:20;bubblechart(x,y,sz,c)Running Result
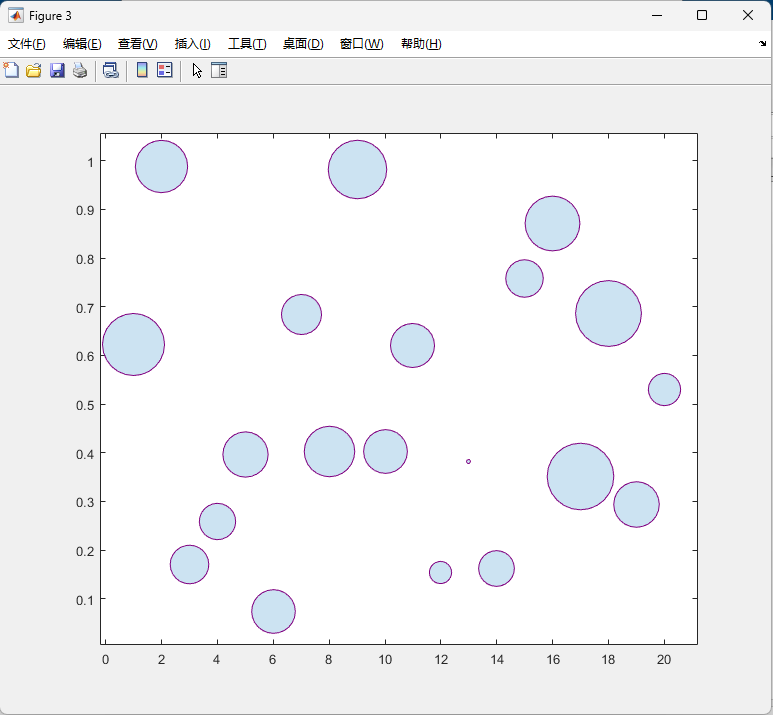
Example 2
Program
clc;clear all;close all;% Specify bubble transparency and outline color% Define bubble coordinates as vectors x and y. Define sz as a vector specifying bubble sizes.% Then create a bubble chart defined by x and y. By default, bubbles are 60% opaque, with fully opaque edges of the same color.% https://ww2.mathworks.cn/help/matlab/ref/bubblechart.htmlfigure;x = 1:20;y = rand(1,20);sz = rand(1,20);bubblechart(x,y,sz);% You can customize opacity and outline color by setting the MarkerFaceAlpha and MarkerEdgeColor properties separately.% One way to set properties is to specify name-value pairs when creating the chart. For example,% you can specify 20% opacity by setting the MarkerFaceAlpha value to 0.20figure;bc = bubblechart(x,y,sz,'MarkerFaceAlpha',0.20);% If you create the chart by calling the bubblechart function with return parameters,% you can use the return parameter to set chart properties after creating the chart. For example, you can change the outline color to purple. figure;bc = bubblechart(x,y,sz,'MarkerFaceAlpha',0.20);bc.MarkerEdgeColor = [0.5 0 0.5];Running Result
3. Reference Content
[1] https://ww2.mathworks.cn/help/matlab/ref/bubblechart.html
The content of this article is sourced from the internet for reference and learning purposes. If there are any copyright issues with the content or images, please contact us for resolution, and we will delete them within 24 hours. Author | Guo Zhilong Editor | Guo Zhilong Proofreader | Guo Zhilong Thank you for your support and attention! Please like, share, and follow us!
 Grow together with the sect!There is a path in the mountain of books, diligence is the way.The sea of learning is boundless, hard work is the boat.