Raspberry Pi Debug Probe: A Powerful Tool for Program Debugging and USB Serial Conversion

Raspberry Pi Debug Probe: A Powerful Tool for Program Debugging and USB Serial Conversion

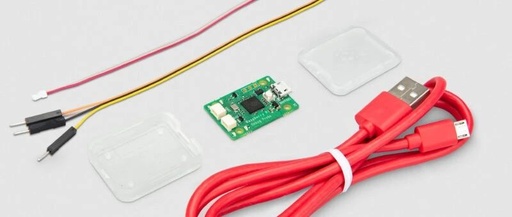
【Click the above「Blue Text」 to follow DF Maker Community and become a tech enthusiast】 Since the launch of Raspberry Pi Pico and RP2040 microcontroller in January 2021, many have been using one Pico to debug programs running on another Pico. Inspired by this trend, yesterday, Raspberry Pi officially launched the Raspberry Pi Debug Probe—a hardware … Read more

A Simple Explanation of Xilinx FPGA MIPI Interface

A Simple Explanation of Xilinx FPGA MIPI Interface

Let’s talk about Xilinx’s MIPI solution. Here, we take the ordinary 7 series as the discussion object, while Xilinx’s high-end KU+/MPSOC+ already support MIPI interface IO directly. Due to the special nature of MIPI signals, low power consumption should be fully considered at the design stage. Therefore, the native signal levels of MIPI support both … Read more

Comprehensive Guide to USB Camera Development and Debugging Tools

Comprehensive Guide to USB Camera Development and Debugging Tools

From the title, it indeed seems quite specific. From the system level, the buses recognized as cameras by the operating system include not only USB but also other buses, such as MIPI cameras, and many software-virtualized cameras. However, during the camera development process, there are always some technical specifications involved, such as the parsing of … Read more

Building the STM32 Debug Output and Time System with Embedded Zorb Framework

Building the STM32 Debug Output and Time System with Embedded Zorb Framework

1 Zorb Introduction Zorb Framework is a lightweight embedded framework built on the principles of object-oriented programming. The purpose of building the Zorb Framework is to enable rapid application development on chips that cannot run Linux, avoiding the need to reinvent the wheel repeatedly. The initial design features of the Zorb Framework include: Time system … Read more

How to Migrate a Sensor? A Detailed Debugging Process for MIPI CMOS Cameras

How to Migrate a Sensor? A Detailed Debugging Process for MIPI CMOS Cameras

█ How to migrate a new sensor? First, confirm whether the hardware interfaces of the motherboard and the module are consistent. Based on specific resolution, frame rate, and other requirements, obtain the corresponding register configuration from the module manufacturer, and configure the sensor driver and DTS according to the platform requirements. After completing the corresponding … Read more

Key CoreSight Technology in Cortex-M Debugging: Are You Using It Effectively?

Key CoreSight Technology in Cortex-M Debugging: Are You Using It Effectively?

Today, many Cortex-M processors can be debugged so conveniently due to the CoreSight technology based on Arm Cortex-M processor devices, which introduces powerful new debug and trace functionalities. Let us focus on the debugging and tracing related content in CoreSight. strongerHuang 1 Debugging and Tracing Functions The two main functions of CoreSight are debugging and … Read more

Understanding the Debugging Interfaces of STM32 Cortex-M Cores

Understanding the Debugging Interfaces of STM32 Cortex-M Cores

Follow+Star Public Account, don’t miss out on exciting content Author | strongerHuang WeChat Public Account | Embedded Column When learning MCU development, debugging is definitely an essential step. This article discusses the debugging interfaces related knowledge using STM32F1 and Cortex-M3 as examples (the principles are similar for other series chips/cores). 1 Overview In STM32, there … Read more

Understanding VxWorks Console Operations

Understanding VxWorks Console Operations

Welcome to follow VxWorks567 Please indicate the source if forwarding! VxWorks generally uses a Console at runtime, providing basic IO operations, such as displaying the output of printf() and providing Kernel Shell services, etc. 1 The Console uses the CONSOLE_TTY serial port by default, with a baud rate of CONSOLE_BAUD_RATE What does TTY mean? It … Read more

Transforming ESP32 into a Portable Oscilloscope

Transforming ESP32 into a Portable Oscilloscope

In embedded development, an oscilloscope is an essential debugging tool that allows developers to visually observe the signal waveforms in circuits, helping them quickly locate issues. However, traditional oscilloscopes are expensive and bulky, making them unsuitable for portable development. The ESP32, as a powerful Wi-Fi microcontroller, has abundant GPIO resources and strong processing capability, making … Read more

Master These Debugging Techniques in Android Studio

Master These Debugging Techniques in Android Studio

Reply 1024, randomly give you beautiful wallpapers Debugging breakpoints tracking is an important means of analyzing code and solving bugs during software development. The use of debugging tools varies across different IDEs, but the debugging features provided are certainly comprehensive. Many programmers’ debugging abilities are limited to basic step execution and breakpoint jumping, unaware that … Read more