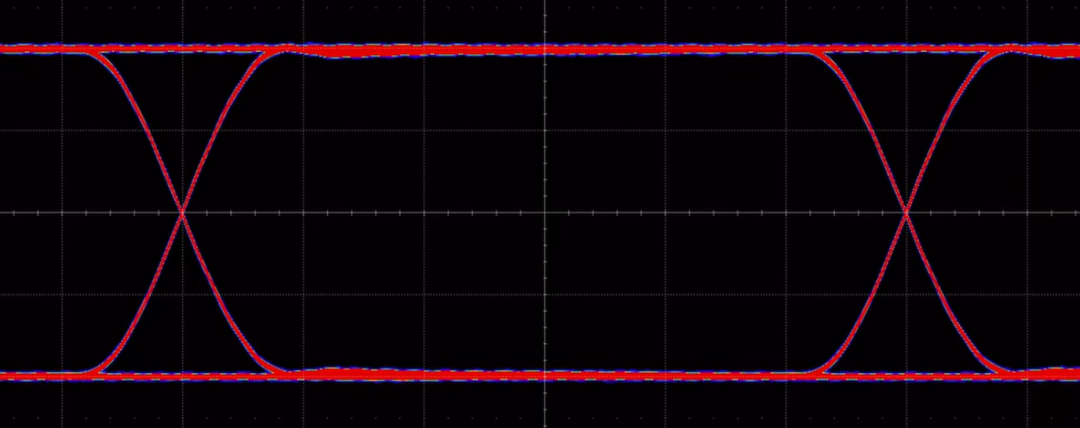
An eye diagram, as the name suggests, is a graphical representation that resembles an eye. How is it formed? This brings us to the persistence mode of an oscilloscope.
The refresh rate of our naked eyes is only 60Hz, which sometimes makes it difficult to detect occasional abnormal signals. The persistence mode can superimpose and display waveforms that have appeared in the past. The eye diagram is essentially the result of separating all symbols from the signal and displaying them superimposed on the screen.
For digital signals, the transitions between high and low levels can have various sequence combinations. Taking 3 bits as an example, there are 8 combinations ranging from 000 to 111. By aligning a sufficient number of these sequences to a specific reference point in the time domain and then superimposing their waveforms, an eye diagram is formed.
The above video helps us understand better: on the left are the 8 sequence combinations and the corresponding signal transitions. It can be seen that since the voltage values of high and low levels cannot remain completely consistent each time, and the rising and falling edges cannot be guaranteed to occur at the same time, the superimposed signal will exhibit this phenomenon of ‘multiple eyelids’ and ‘multiple corners.’
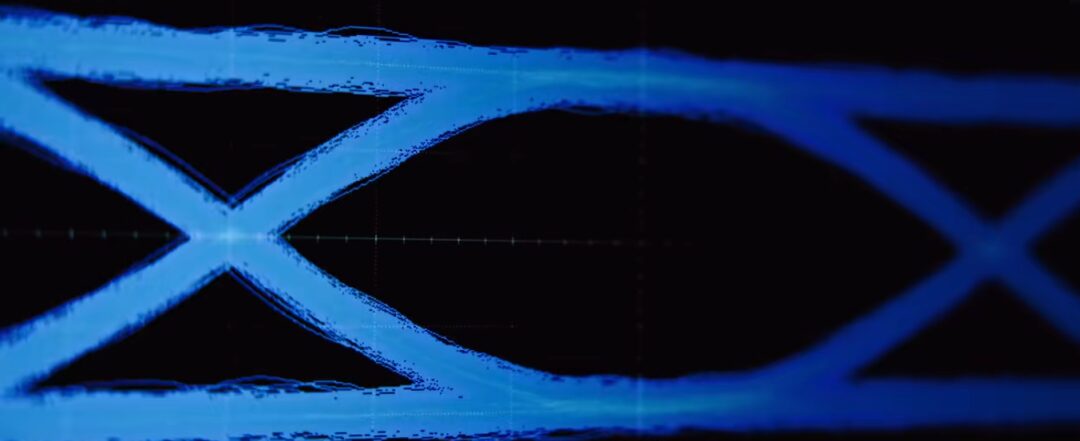
Sometimes, to make the eye diagram clearer, we will enable the color temperature mode, which gives the eye diagram a sense of brightness and darkness. The warmer the tone, the higher the probability of the signal appearing, and it becomes more intuitive to observe the distribution of signal noise and jitter.
What is the significance of eye diagram testing?
In ordinary waveform measurement processes, we analyze the detailed information of a certain segment, such as rising edges, falling edges, overshoot, periods, etc. However, with the increase in digital signal rates, relying solely on ordinary waveform measurements is insufficient. This is because losses in the transmission channel can lead to different waveform positions and measurement results. Therefore, the eye diagram has become the most commonly used method for analyzing high-speed digital signals.
It reflects the overall characteristics of the signal, allowing us to observe inter-symbol interference and noise interference, thereby evaluating system performance based on certain parameters.
How to Evaluate System Performance by Observing Eye Diagram Shapes?
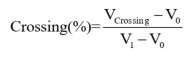
In the ideal case of no inter-symbol interference and noise, the waveform is undistorted, and each symbol overlaps perfectly. The final trace seen on the oscilloscope is a clear and fine ‘eye’ that opens wide.
When there is inter-symbol interference, the waveform distorts, and the symbols do not completely overlap, resulting in a blurry eye diagram trace, causing the ‘eye’ to close. If noise also affects it, the eye diagram lines become fuzzy, and the ‘eye’ opens less.
Therefore, the size of the ‘eye’ opening can reflect the degree of distortion and the strength of inter-symbol interference.
Eye Diagram Testing
Considering the accuracy of eye diagram testing, it is generally necessary to accumulate enough UIs before analysis, which raises higher requirements for the oscilloscope’s storage depth. The higher the storage depth, the more UIs the oscilloscope can analyze at once, resulting in more accurate test results.
Therefore, when measuring the eye diagram of high-speed signals, it is necessary to use a high storage depth whenever possible. Of course, the higher the storage depth, the slower the oscilloscope’s analysis speed will be.
Constant Frequency & Phase-Locked Loop
Constant Frequency
By using the least squares method for linear fitting of the collected data edges, the clock can be recovered. The rate mode can be set to automatic or manual, with automatic mode recommended in most cases. When the signal-to-noise ratio is poor and the oscilloscope cannot accurately determine the recovered clock, it is recommended that users manually input the data rate according to the actual situation, after which the oscilloscope will use the input rate as a reference for clock recovery.
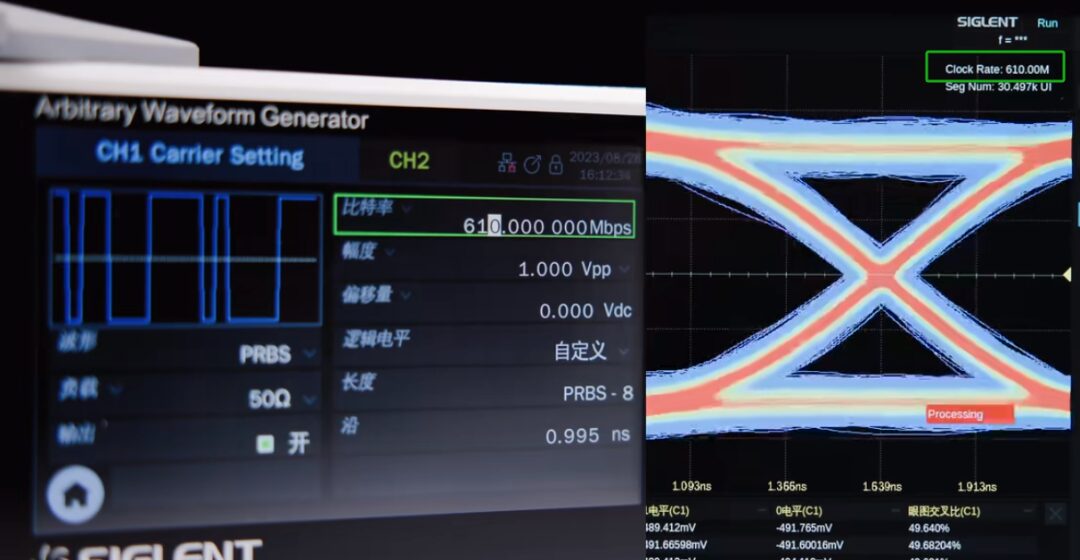
Using the SDG7000A to output a PRBS signal, with a length set to 8 and a bit rate set to 600MHz, the clock is displayed as 600MHz.
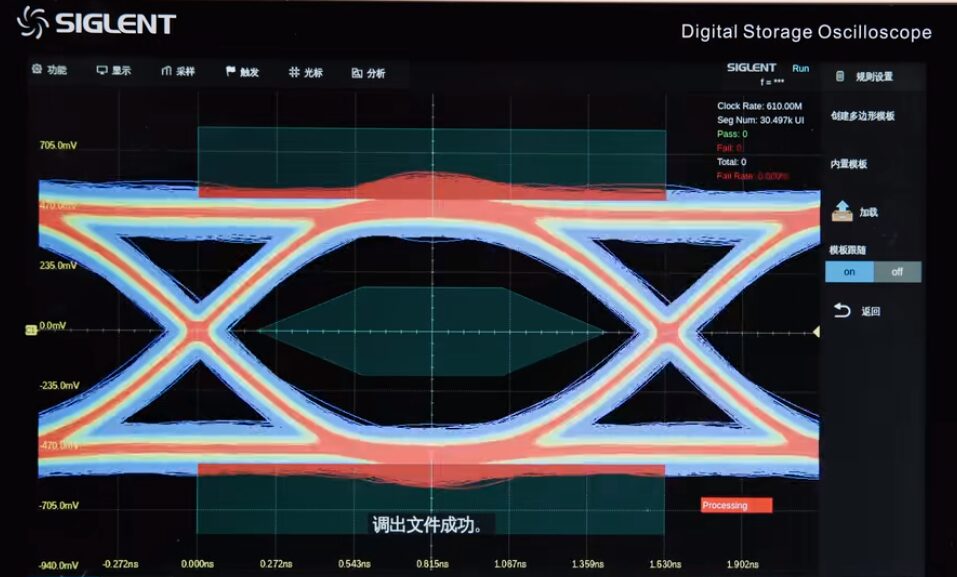
We gradually increase the bit rate to 610MHz, and we can see that the clock rate also increases to 610MHz, which is the automatic mode.
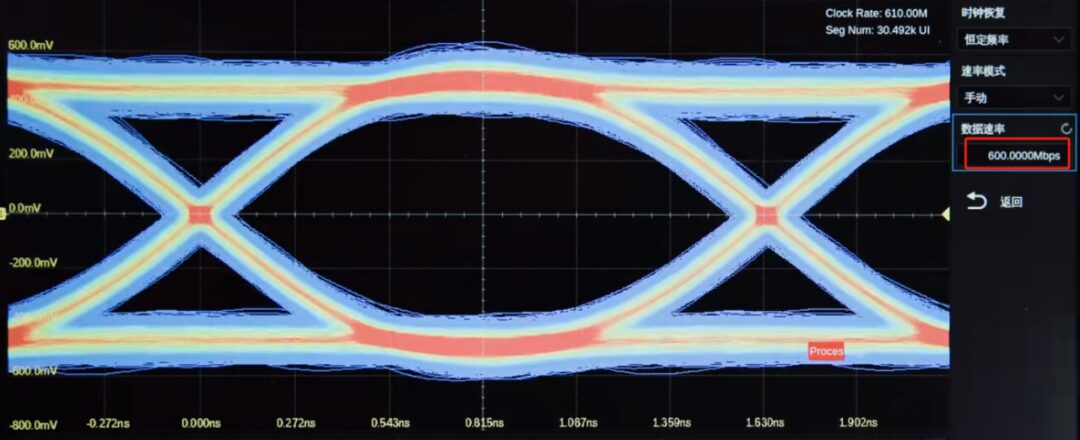
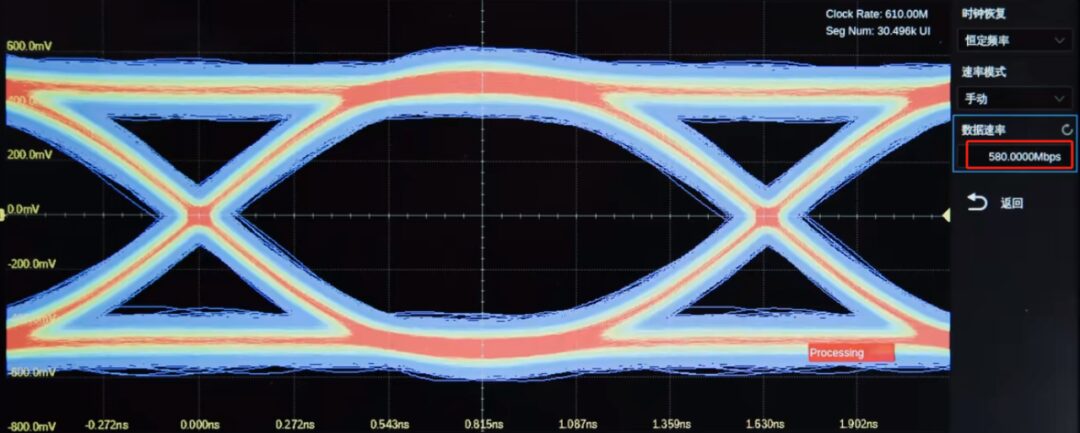
As shown in the figure, in manual mode, if the input reference data rate is 600MHz, we can see that the oscilloscope correctly recovers the clock. If we increase the error between the reference input value and the actual value, setting the reference value to 580MHz, the recovered clock remains correct.
However, when we set the data rate to 570MHz, we find that the displayed recovered clock is 607MHz.
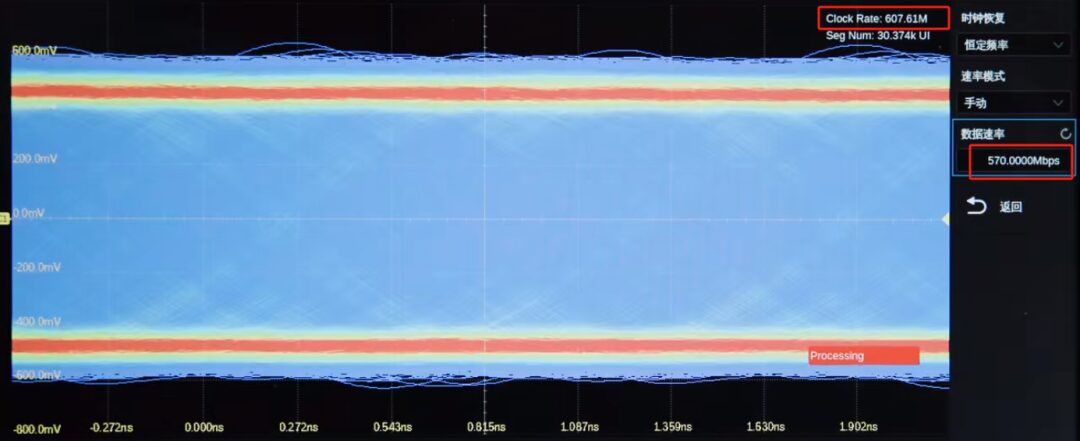
Since the oscilloscope did not find the correct clock, the eye diagram cannot be successfully constructed. There is no exact range for this error; factors like signal-to-noise ratio, waveform bit rate, etc., can all affect this error.
After setting the rate mode, continue to set the Find Mode, where ‘Every Time’ indicates that the oscilloscope will perform clock recovery on each frame of collected data, constructing each frame’s eye diagram using the corresponding recovered clock, and each frame’s eye diagram will replace the previous one.
Let’s observe the actual effect: when the signal frequency is slightly altered, not only does the clock change, but the eye diagram on the screen also continuously updates and replaces.
When ‘First Time’ is selected, the oscilloscope will recover the clock based on the first frame collected, and subsequent frames will use that clock to construct the eye diagram. You can choose to display only the last frame’s eye diagram or select ‘All’ to overlay all frames’ eye diagrams on the screen.
After selecting ‘All’, we can see that when the signal frequency is slightly altered, the clock remains unchanged, while the eye diagram appears overlapped, because the recovered clock from the first frame does not apply to all frames.
Phase-Locked Loop
The ‘Phase-Locked Loop’ clock recovery method is based on the collected digital signal, using a software phase-locked loop method to calculate the position of each reference clock edge.
Because the phase-locked loop method has a certain tracking ability for clock changes, it can eliminate low-frequency components in jitter, thus getting closer to the actual situation seen by the receiver of the serial signal. Similarly, after selecting ‘Phase-Locked Loop’, it is necessary to select the rate mode and find mode, consistent with the ‘Constant Rate’ situation, which will not be repeated here.
The software phase-locked loop currently supports first order and can change the loop bandwidth by configuring the cutoff factor.
Template Testing
Conclusion
Source | Dingyang Hardware Think Tank


☞ Business Cooperation: ☏ Please call 010-82306118 / ✐ Or email [email protected]

Click here ‘Read Original’ to reach the official website of Electronic Technology Application