Colleagues, after receiving the book, please confirm receipt in the small shop, thank you! To order the book, you can click the image below to go to the pre-sale notification for ordering.

Digital Signal Processing (DSP) is performed on the collected time-domain signals to obtain their frequency-domain results. When signals are transformed from the time domain to the frequency domain, there are specific DSP terminologies, and these terms have important mathematical relationships. Are you familiar with them?
The DSP terminologies are as follows.
Time Domain
Frame Length / Frame Size ——————–
Time Interval / Time Resolution —————-
Data Block Size (Number of Analysis Points) —————-
Frequency Domain
Sampling (Frequency) Rate ————————–
Maximum Frequency / Bandwidth ————————
Frequency Resolution —————————
Number of Spectral Lines ——————————–
1. Frame Length / Frame Size:
The length of the time-domain signal captured for one FFT analysis is called one frame of data or frame size, measured in seconds, also referred to as one time-domain data block. Since the actual collected time-domain signal duration is long, and one FFT analysis can only analyze a limited length of time-domain signal, it is necessary to truncate the long time-domain signal into frames of frame size. This truncation process is called signal truncation. Signal truncation can be further divided into periodic truncation and non-periodic truncation (some articles describe this in more detail).
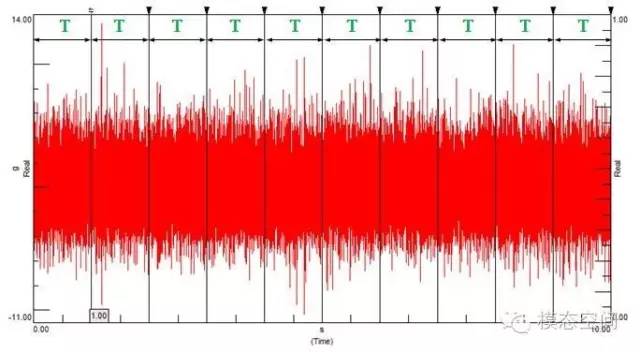
Assuming there is a 10s time-domain signal, taking a frame length without overlap, the signal will be truncated into 10 frames, as shown in the figure below. Following this pattern for FFT calculations will yield 10 instantaneous frequency spectra. If these instantaneous frequency spectra are averaged, the average count will be 10, and the final FFT analysis result will be the average of these 10 instantaneous frequency spectra.
The above truncation does not consider signal overlap. Sometimes, overlap is expressed as a percentage; if the overlap rate is 50%, it means that this frame of signal shares 50% with the next frame. That is, the last 50% of the first frame is used as the first 50% of the second frame. Sometimes, it is expressed in terms of time increment or speed increment. Taking time increment as an example, we need to explain how long to wait before capturing the next frame. This waiting time is referred to as step size or increment, as shown in the figure below.
When the increment is less than the frame size, there is overlap between adjacent frames. The overlap rate calculation formula is as follows:
Overlap Rate = (Frame Size – Increment) / Frame Size * 100%
When the increment equals the frame size, there is no overlap between adjacent frames, but the two frames connect seamlessly, as shown in the first figure.
When the increment is greater than the frame size, there is no overlap between adjacent frames, but there is a gap between the two frames, meaning some time-domain data does not participate in the FFT calculation.
2. Time Interval / Time Resolution:
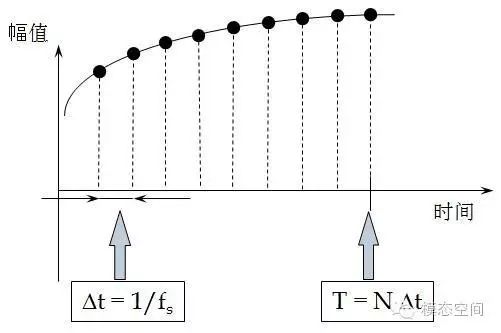
The time difference between two adjacent time-domain data points is called the time interval or time resolution, equal to the reciprocal of the sampling frequency, measured in seconds. The smaller the time resolution, the higher the sampling rate, the denser the sampling, and the closer the signal is to the real signal, as shown in the figure below. Assuming the sampling frequency is 1000Hz, the time resolution is 1ms, indicating that the time interval for collecting two data points is 1ms, which also means 1000 data points are collected in 1s.
3. Data Block Size:
The number of data points (sample points, analysis points) corresponding to one frame of data is called the time-domain data block size, as represented by the solid black points in the figure above, indicating one data point. Therefore, one frame of data can be described not only by its time length but also by the number of data points. The relationship between them is as follows:
Thus, the number of data points contained in one frame of data can be calculated. Some software does not determine the length of one frame of data by setting the size of frequency resolution (which equals the reciprocal of frequency resolution) but by setting the data block size to determine the length of one frame of data.
4. Sampling Rate:
Since computers cannot process analog signals, it is necessary to convert analog signals into digital signals through sampling. The parameter that characterizes the speed of sampling is called the sampling (frequency) rate, measured in Hz. Essentially, it is more appropriate to refer to the sampling frequency as the sampling rate because it represents the speed of sampling; a higher sampling rate means faster sampling. The sampling rate indicates how many sample points (or data points) are collected per second, which can also be expressed as sample/s or number of sample points/second.
The higher the sampling frequency, the shorter the time interval between two sample points, and the closer the collected digital signal is to the real signal.
5. Maximum Frequency / Bandwidth:
Half of the sampling frequency is called bandwidth, or maximum analysis frequency, or Nyquist frequency. The relationship with the sampling rate is as follows:
In other words, all frequencies ultimately analyzed are within the bandwidth, even if frequency aliasing occurs, the presented frequencies are still within this range. Therefore, to prevent frequency components above the bandwidth from aliasing into the bandwidth, anti-aliasing filtering must be performed before analog-to-digital conversion.
6. Frequency Resolution:
We have understood that the collected time-domain signals are discrete, and the time difference between two time-domain data points is called time resolution. Similarly, the frequency spectrum is also discrete, and the frequency difference or frequency interval between two adjacent spectral lines is called frequency resolution. The results obtained from FFT calculations only exist at integer multiples of frequency resolution, that is, at spectral lines, with no results in other places, as shown in the figure below. Assuming the dashed lines in the figure represent spectral lines, the frequencies corresponding to each spectral line are integer multiples of frequency resolution. The calculated frequency spectrum results only exist at these spectral lines.
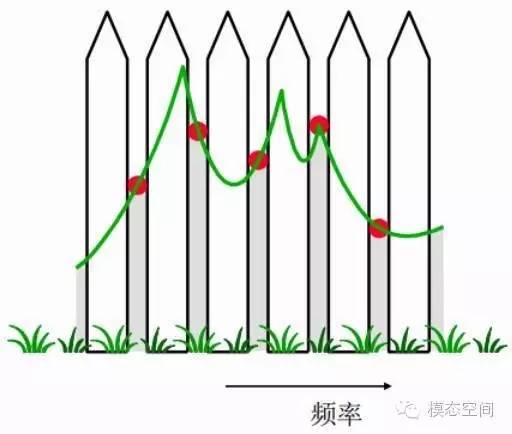
Frequency results can only exist at each spectral line; there are no results between spectral lines. This discrete effect of the frequency spectrum is called the fence effect. Just as people can only see the outside world through the gaps between adjacent fences, only data exists at the spectral lines, and there are no results in the areas between the spectral lines, as shown in the figure below. Only at the spectral lines can there be red frequency results, and the final frequency spectrum curve is formed by connecting these points on the spectral lines.
The larger the frequency resolution, the farther apart the adjacent spectral lines are, thus the greater the frequency error obtained. During FFT analysis, the maximum frequency error will not exceed half of the frequency resolution. This is because frequencies are rounded to the nearest spectral line. The reciprocal of frequency resolution is the length of the time-domain signal truncated for one FFT, which is the length of one frame of data. When the frequency resolution is smaller, the length of one frame of data must be larger. Therefore, when performing FFT calculations, one cannot set the frequency resolution too small or too large; a frequency resolution that is too large may lead to increased frequency errors.
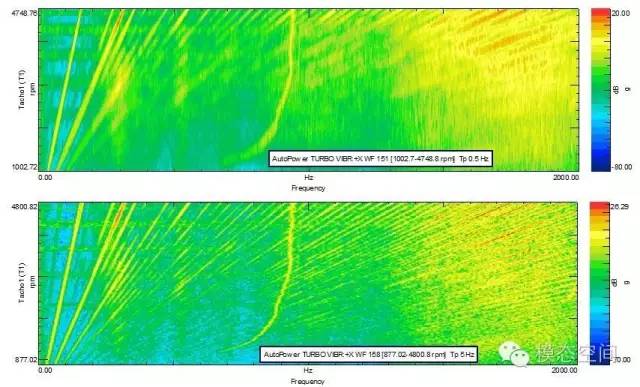
On the other hand, when performing waterfall analysis on rotating machinery, the size of frequency resolution is related to the rate of change of speed. The figures below show frequency resolutions of 0.5Hz (top) and 5Hz (bottom) for the same speed-up signal’s waterfall analysis results. The time-domain data block length corresponding to 0.5Hz is 2s, while for 5Hz it is 0.2s. From the figures, it can be seen that the frequency resolution of 5Hz shows clearer levels because the corresponding time-domain data block is shorter, and the speed change within this shorter time is less than that of the time-domain data block corresponding to 0.5Hz, thus the frequency is clearer. The shorter the time-domain data block, the more it can be considered that the signal is steady-state within that time period.
Therefore, when performing waterfall analysis, it is necessary to choose an appropriate frequency resolution based on the rate of change of speed. A better frequency resolution (smaller frequency interval) leads to more severe spectral tailing, especially at high speeds. The phenomenon of signal “tailing” occurs because the frequency of the signal changes significantly during the process of collecting the time-domain data block. Thus, for waterfall analysis of rotating machinery, special attention should be paid to the impact of frequency resolution on the analysis results.
7. Number of Spectral Lines:
The total number of spectral lines in the frequency spectrum is called the number of spectral lines. It can also be understood as the bandwidth divided by the frequency resolution, with the number of divisions being the number of spectral lines. The FFT of N time-domain sample points yields N/2 spectral lines, meaning that two time-domain data points can yield one spectral line.
The relationship between the number of spectral lines, bandwidth, and frequency resolution is as follows:
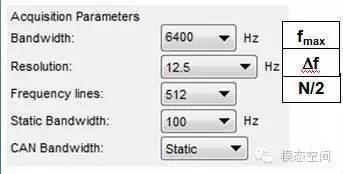
Since these three are interrelated, when performing data collection, it is sufficient to set two of the parameters, and the third parameter will automatically change to the corresponding value. In Testlab software, the interface for setting these three parameters is shown in the figure below. Here, it is recommended to set the bandwidth and frequency resolution parameters. Because once the bandwidth is set, the sampling frequency is also determined. Once the frequency resolution is determined, the number of spectral lines is also determined. Additionally, setting the frequency resolution is more intuitive.
Relationships Among Them
The relationship between time resolution and sampling frequency:
The relationship among frame length, data block size, time resolution, sampling frequency, and frequency resolution:
The relationship among bandwidth, sampling frequency, frequency resolution, number of spectral lines, and frame length:
The relationship among frequency resolution, frame length, sampling frequency, data block size, bandwidth, and number of spectral lines:
Graphically represented as follows:
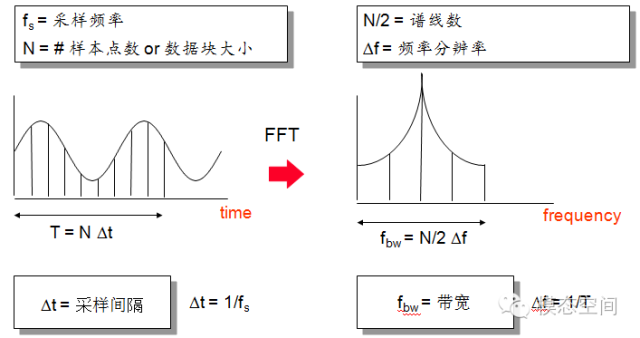
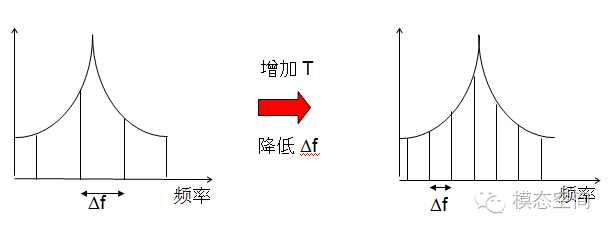
Through the above relationships, we understand the relationship between frequency resolution and the length of one frame of data. Reducing the length of one frame of data is equivalent to increasing the frequency resolution, which means poorer frequency resolution. To obtain better frequency resolution, it is equivalent to capturing longer time-domain data, as shown in the figure below. Increasing the length of one frame of data will decrease the frequency resolution, resulting in denser spectral lines and more accurate frequency calculations.
References:
1. Tan Xiangjun. Learn NVH from Here – Introduction and Advanced Analysis of Noise, Vibration, and Modal Analysis (2nd Edition), Mechanical Industry Press, 2021
To ordersigned editioncolor-printed book, pleasego to the store to take a photo (click the image below to jump to the store)


Further Reading
1. What is Quantization?
2. The Difference Between Sampling Frequencies of 2 Times and 2.56 Times
3. Why Do We Usually Only Care About Low-Order Modes or Natural Frequencies
4. Several Terminology Explanations in Signal Processing (I)
5. Several Terminology Explanations in Signal Processing (II)