2025

#Understanding C-Peptide Reports: From Values to Curves, Decoding the Secrets of Pancreatic Function!#

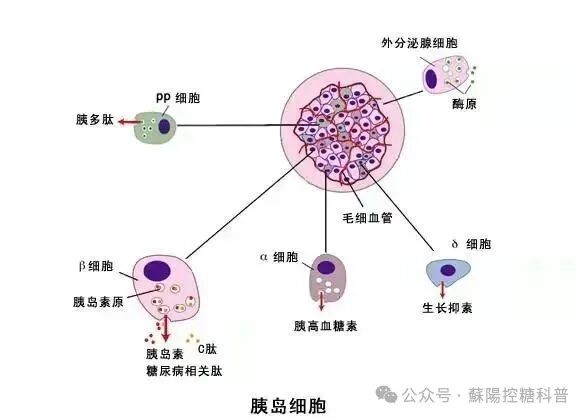
🔍 What is C-Peptide? Why measure it?

C-Peptide (Connecting Peptide) is a “byproduct” of insulin secretion from pancreatic β-cells, produced in equal amounts to insulin. However, it is more stable than insulin—it is not metabolized by the liver and is not affected by exogenous insulin, thus providing a more accurate reflection of pancreatic function. Especially for patients who have injected insulin, C-Peptide is the “gold standard” for assessing the activity of their own pancreatic β-cells.

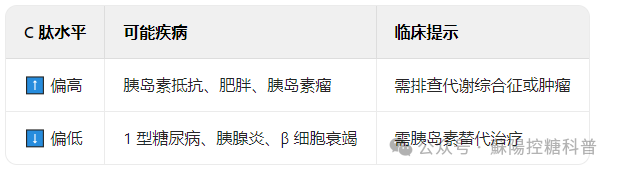
👉 Three Major Significances of Measuring C-Peptide:1️⃣ Differentiating Diabetes Types: C-Peptide is extremely low in Type 1 diabetes, while it may be normal or elevated in Type 2 diabetes.
2️⃣ Guiding Treatment: Determining whether insulin therapy is needed or if medication adjustments are required.3️⃣ Predicting Complications: Persistently low C-Peptide indicates a risk of β-cell failure.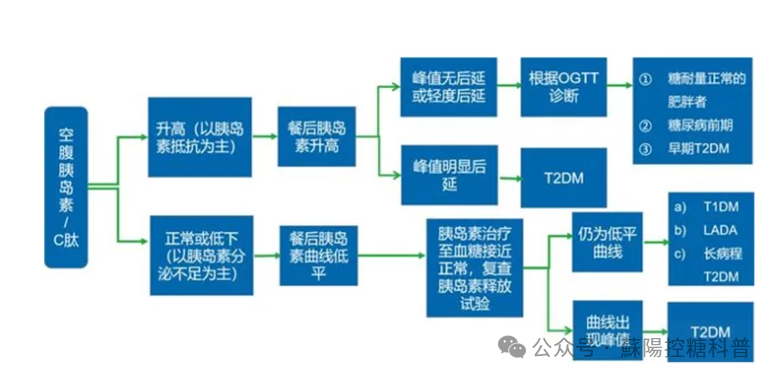
part 01
🧪 How to Read C-Peptide Reports? Key Indicators Explained

1. Normal Reference Range
-
Fasting C-Peptide: 0.3~1.3 nmol/L (or 0.81~3.85 ng/mL)
-
Postprandial Peak: Approximately 5~6 times the fasting value, peaks at 1 hour, returns to baseline at 3 hours.
2. Abnormal Value Alerts
part 02
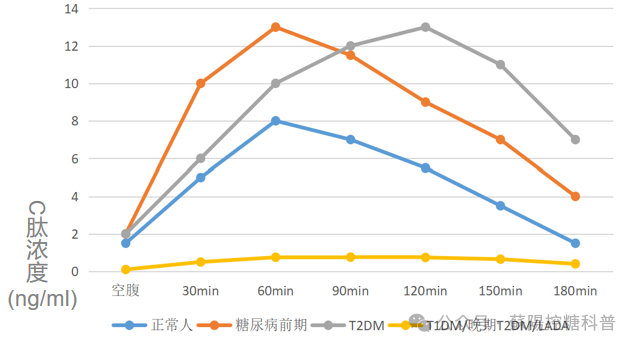
📈 C-Peptide Release Curve: Dynamically Observing Pancreatic Function
By measuring C-Peptide changes at five time points after an oral glucose/steamed bun meal, a curve can be plotted: (Illustration: Normal Curve vs Abnormal Curve)
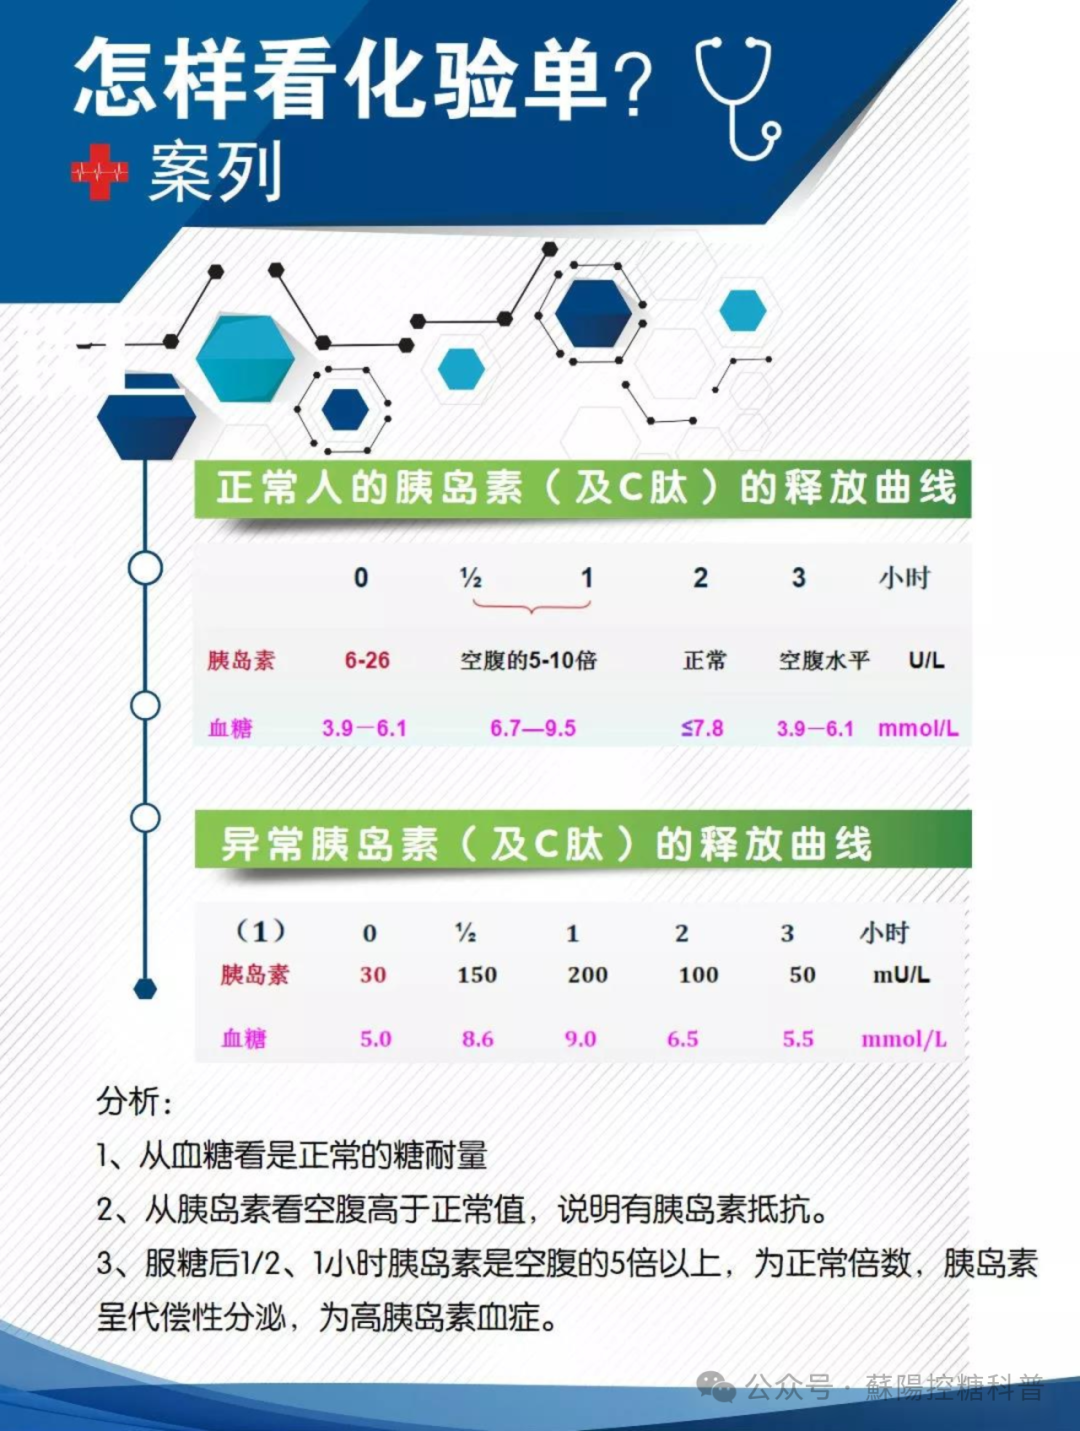
Common Curve Types
1️⃣ Normal Curve: Normal fasting, peaks at 1 hour (5~6 times), returns to baseline at 3 hours.
2️⃣ Resistant Curve: High fasting C-Peptide, normal peak but delayed (early Type 2 diabetes).
3️⃣ Flat Curve: Low C-Peptide at all points, indicating β-cell failure (Type 1 or late Type 2 diabetes).
⚠️ Note: Must be analyzed in conjunction with blood glucose values! If blood glucose is high but C-Peptide is low, it indicates absolute insulin deficiency; if both are high, it suggests insulin resistance.
part 03
🏥 Case Sharing: The Story Behind the Report
Case 1: Mr. Zhang, fasting C-Peptide 0.2 nmol/L, no peak after meals.
Interpretation: β-cell function failure, diagnosed with Type 1 diabetes, requires lifelong insulin therapy.
Case 2: Ms. Li, fasting C-Peptide 3.8 nmol/L, postprandial peak delayed to 2 hours.
Interpretation: Insulin resistance + secretion delay, classified as prediabetes, requires lifestyle intervention.
part 04
📝 Testing Precautions
1️⃣ Fasting for 8~12 hours, with daily carbohydrate intake of 150~300g for the previous 3 days.
2️⃣ Discontinue interfering medications: Corticosteroids, diuretics, etc., should be stopped 3~7 days prior.
3️⃣ Do not test if blood glucose is too high: Fasting blood glucose >10mmol/L will suppress C-Peptide secretion, glucose control is needed first.
part 05
🌟 Summary
C-Peptide is a “mirror” of pancreatic function, understanding the report requires considering:
✅ Value levels ✅ Dynamic curves ✅ Blood glucose matching ✅ Clinical manifestations
It is recommended to bring the complete report (including blood glucose, glycated hemoglobin, etc.) to the endocrinology department for comprehensive evaluation!