Digital Signal Processing (DSP) is applied to the collected time-domain signals to obtain their frequency-domain results. When a signal is transformed from the time domain to the frequency domain, there are specific DSP terminologies, and these terms have important mathematical relationships with each other. Are you clear about them? The following are the DSP terminologies.
Time Domain
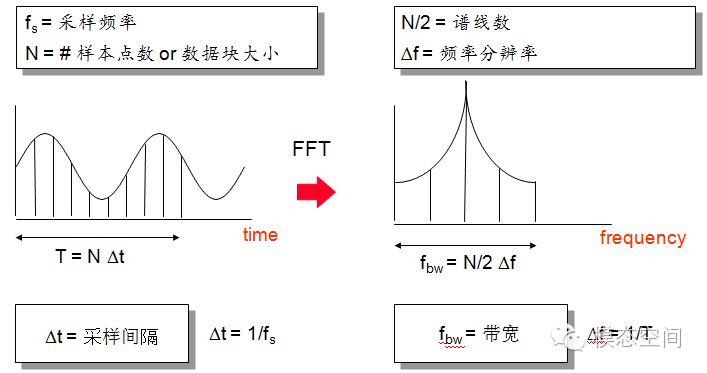
Frame Length/frame size ———————— T
Time Interval/Time Resolution —————- Δt
Data Block Size ——————————— N
Frequency Domain
Sampling Rate —————————————- fs
Maximum Frequency/Bandwidth ————————– fmax
Frequency Resolution ——————————- Δf
Number of Spectral Lines————————————– N/2
1.Frame Length/frame size:T
The length of the time-domain signal captured for a single FFT analysis is called one frame or frame size, measured in s, also known as one time-domain data block. Due to the long duration of the actual collected time-domain signal, and the fact that a single FFT analysis can only analyze a limited length of time-domain signal, it is necessary to truncate the long time-domain signal into individual frame sizes. This process is called signal truncation. Signal truncation is further divided into periodic truncation and non-periodic truncation (which will be described in detail in subsequent articles).
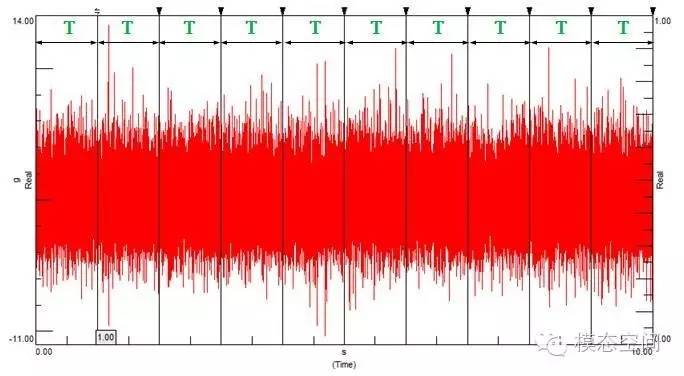
Assuming there is a segment of 10s of time-domain signal, taking a frame length of T=1s without overlap, the signal will be truncated into 10 frames, as shown in the figure below. By following this pattern for FFT calculations, we will obtain 10 instantaneous frequency spectra. If these instantaneous frequency spectra are averaged, the average count will be 10 times, and the final FFT analysis result will be the average of these 10 instantaneous frequency spectra.
The above does not consider signal overlap; sometimes a percentage is used to represent the overlap. If the overlap is 50%, it means that this frame’s signal will share 50% with the next frame’s signal. That is, the latter 50% of the first frame is used as the first 50% of the second frame. Sometimes, time increments or rotational speed increments are used to represent this; here, we will use time increment as an example. The length of time for each frame we capture is fixed, but how long should we wait to capture the next frame? This waiting time is called step size or increment (increment), as shown in the figure below.
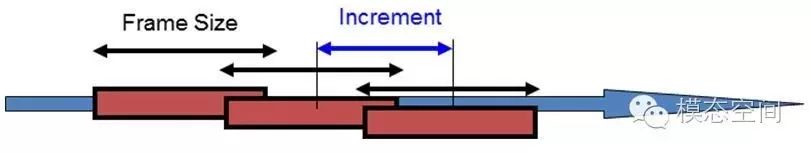
When the increment is less than the frame size, there is overlap between adjacent two frames of data. The overlap rate calculation formula is as follows:
Overlap Rate = (frame size – increment)/frame size *100%
When the increment equals the frame size, there is no overlap between adjacent two frames of data, but the two frames of data are seamlessly connected, as shown in the first figure.
When the increment is greater than the frame size, there is no overlap between adjacent two frames of data, but there is a gap between the two frames of data, meaning that some time-domain data does not participate in the FFT calculation.
2. Time Interval/Time Resolution:Δt
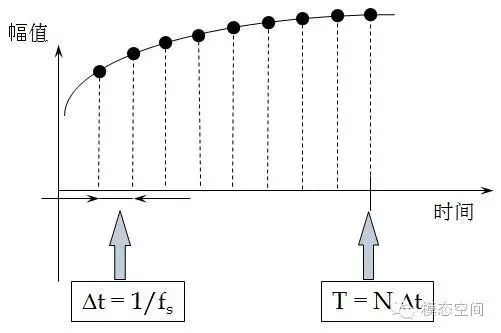
The sampling time difference between two adjacent time-domain data points is called the time interval or time resolution, equal to the reciprocal of the sampling frequency, measured in s. The smaller the time resolution, the higher the sampling rate, the denser the sampling, and the closer the signal is to the real signal, as shown in the figure below. Assuming the sampling frequency is 1000Hz, then the time resolution is 1ms, meaning that the time interval for collecting two data points is 1ms, which also indicates that in 1s, 1000 data points are collected.
3. Data Block Size:N
The number of data points (sample points) corresponding to one frame of data is called the time-domain data block size (time block size), as represented by the black solid points in the figure above, indicating one data point. Therefore, a frame of data can be described not only by its time length but also by the number of data points. The relationship between them is as follows:
T=NΔt
Thus, the number of data points contained in a frame of data can be calculated. Some software does not determine the length of a frame of data by setting the size of frequency resolution (which equals the reciprocal of frequency resolution) but rather by setting the data block size N, like DASP, which adopts this setting mode.
4. Sampling Rate:fs
Since computers cannot process analog signals, analog signals must be converted into digital signals through sampling. The parameter used to characterize the speed of sampling is called sampling (frequency) rate, measured in Hz. Essentially, I prefer to call the sampling frequency as the sampling rate because it represents the speed of sampling; the higher the sampling rate, the faster the sampling. The sampling rate indicates how many samples (or data points) are collected per second, which can also be expressed as sample/s or number of sample points/second.
The higher the sampling frequency, the shorter the time interval between sampling two points, and the digital signal collected is closer to the real signal. Do you still remember the sampling frequency that should be high enough to avoid significant distortion of the signal amplitude? If you don’t know, please refer to the article from August 2 titled “How High Should the Sampling Frequency Be to Avoid Significant Distortion of Signal Amplitude?“.
5. Maximum Frequency/Bandwidth:fmax
Half of the sampling frequency is called bandwidth, or maximum analysis frequency, or Nyquist frequency. The relationship with the sampling rate is as follows:
fmax= fs/2
This means that all frequencies finally analyzed are within the bandwidth, even if frequency aliasing exists, the displayed frequencies are still within this range. Therefore, to prevent frequency components above the bandwidth from aliasing into the bandwidth, anti-aliasing filtering needs to be performed before analog-to-digital conversion.
6. Frequency Resolution:Δf
We have understood that the collected time-domain signals are discrete, and the time difference between two time-domain data points is called time resolution. Similarly, the spectrum is also discrete, and the frequency difference or frequency interval between two adjacent spectral lines is called frequency resolution. The results obtained from FFT calculations only exist at integer multiples of frequency resolution, that is, at the spectral lines, with no results in other places, as shown in the figure below. Assuming the dashed lines in the figure represent spectral lines, the frequencies corresponding to each spectral line are integer multiples of frequency resolution. The calculated frequency spectrum results only exist at these spectral lines.
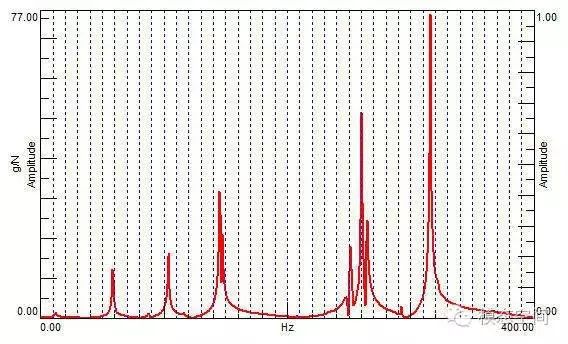
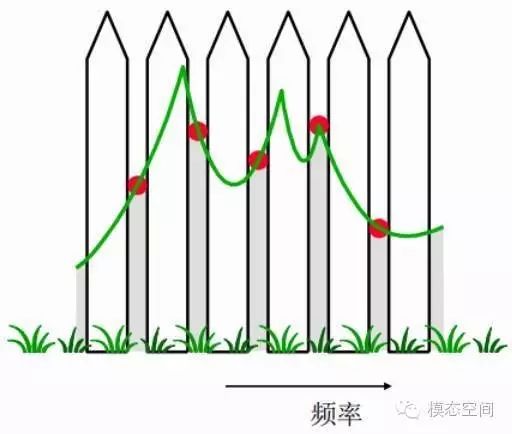
Frequency results can only exist on the spectral lines, and there are no results between spectral lines. This discrete effect of the frequency spectrum is called the fence effect. Just like people looking at the outside world through a fence, they can only see the outside world through the gaps between adjacent fences, while the fence blocks their view. The gaps between two adjacent fences can be likened to the spectral lines in the frequency spectrum, where data only exists on the spectral lines, and there are no results in the areas between the spectral lines, as shown in the figure below; only on the spectral lines can red frequency results be seen, and the final frequency spectrum curve is formed by connecting the points on these spectral lines with a solid line.
The greater the frequency resolution, the further apart the adjacent spectral lines are, thus the greater the frequency error obtained. During FFT analysis, the maximum frequency error will not exceed half of the frequency resolution. This is because frequencies are also rounded to the nearest spectral line. The reciprocal of frequency resolution is the length of the time-domain signal truncated for one FFT operationT, which is the length of one frame of data. When the frequency resolution is smaller, the length of one frame of data must be larger. Therefore, when performing FFT calculations, the frequency resolution cannot be set too small, nor can it be set too large; a frequency resolution that is too large may lead to an increase in frequency error.
On the other hand, when performing waterfall plot analysis on rotating machinery, the size of frequency resolution is related to the rate of change of rotational speed. The following figures show the waterfall plot results for frequency resolutions of 0.5Hz and 5Hz. The time-domain data block length corresponding to 0.5Hz is 2s, while the time-domain data block length corresponding to 5Hz is 0.2s. From the figures, it can be seen that the frequency resolution of 5Hz is more pronounced; this is due to the shorter corresponding time-domain data block, where the change in rotational speed during this shorter time is not as significant as that corresponding to the time-domain data block of 0.5Hz, thus the frequency is clearer. The shorter the time-domain data block, the more it can be considered that the signal is a steady-state signal during that time period.
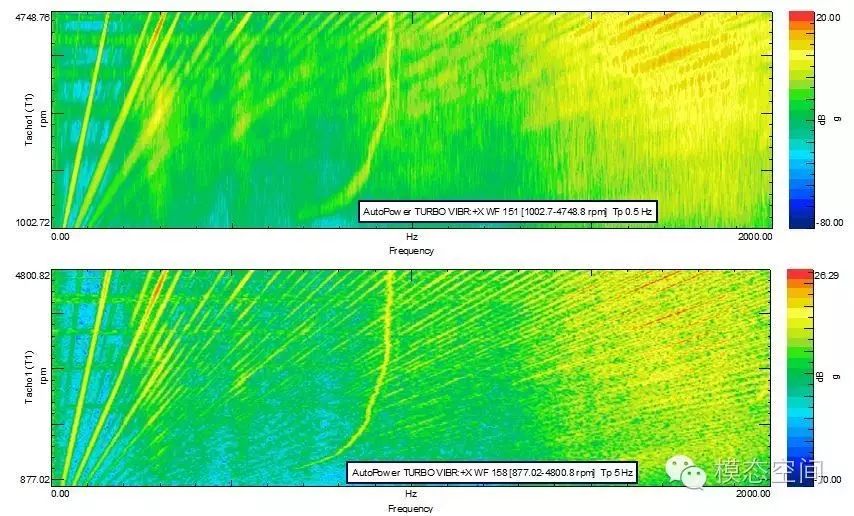
Therefore, when performing waterfall plot analysis, it is necessary to choose an appropriate frequency resolution based on the rate of change of rotational speed. A better frequency resolution (smaller frequency interval) leads to more serious spectral tailing, especially at high rotational speeds. The phenomenon of signal “tailing” occurs because the frequency of the signal changes significantly during the process of capturing the time-domain data block. Thus, for waterfall plot analysis of rotating machinery, you should pay special attention to the impact of frequency resolution on the analysis results.
7. Number of Spectral Lines:N/2
The total number of spectral lines in the frequency spectrum is called the number of spectral lines. It can also be understood as the bandwidth divided into equal parts based on frequency resolution, and the number of parts is the number of spectral lines.N time-domain sample points yield FFT results of N/2 spectral lines, which means that two time-domain data points can yield one spectral line.
The relationship between the number of spectral lines, bandwidth, and frequency resolution is as follows:
N/2= fmax/Δf
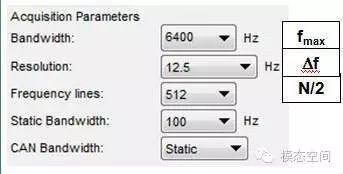
Since these three are interrelated, when performing data collection, it is sufficient to set any two parameters, and the third parameter will automatically change to the corresponding value. For example, in the LMS.Test.Lab software, the interface for setting these three parameters is shown in the figure below. Here, it is recommended that you set the bandwidth and frequency resolution as these two parameters. Once the bandwidth is set, the sampling frequency is also determined. Once the frequency resolution is fixed, the number of spectral lines is also determined accordingly. Additionally, setting the frequency resolution is more intuitive.
Relationships Among Them
The relationship between time resolution and sampling frequency:
Δt = 1/fs
The relationship between frame length, data block size, time resolution, sampling frequency, and frequency resolution:
T=NΔt = N/fs = 1/Δf
The relationship between bandwidth, sampling frequency, frequency resolution, number of spectral lines, and frame length:
fmax = fs/2 =Δf*N/2 = N/2*1/T
The relationship between frequency resolution, frame length, sampling frequency, data block size, bandwidth, and number of spectral lines:
Δf = 1/ T = fs /N = fmax /( N/2)
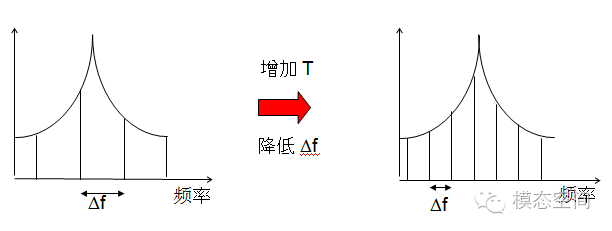
Graphically represented as follows:
Through the above relationships, we understand the relationship between frequency resolution and the length of one frame of data. Reducing the length of one frame of data T is equivalent to increasing the frequency resolution Δf, which means poorer frequency resolution. To obtain better frequency resolution Δf, it is equivalent to capturing a longer time-domain data T, as shown in the figure below. Increasing the length of one frame of data T will decrease the resolution, making the spectral lines denser, and the calculated frequencies will be more accurate.
If you find this useful, please like it!
————————————————————
For more exciting content, please follow our public account:Modal Space
 Long press to recognize the QR code for quick follow-up