(Add to your bookmarks for Python developers to enhance Python skills)
Source: Machine Heart
Jupyter can now perform visual debugging as the Jupyter team releases its first debugging plugin and kernel.

How to choose a Python code editor? PyCharm, VS Code, and Jupyter Notebook each have their unique features. Jupyter is suitable for data analysis and other operations that require visualization, while PyCharm is better for complete Python projects. However, due to its interactive nature, few developers think of using Jupyter for debugging.
Although many readers may think that Jupyter is sufficient for presentations and small experiments, and that debugging is not a significant need, filling this gap in Jupyter will make it more useful, and debugging will likely become a default mode in the future.Why does Jupyter need debugging?While Jupyter tools have excellent interactive performance, they also understand that for large codebases, traditional IDEs are more reliable. Therefore, to address this shortcoming, the Jupyter project has aimed to enhance the handling of large codebases through JupyterLab over the past few years.However, JupyterLab still has a significant flaw: it cannot perform debugging visually, which limits further debugging capabilities. Recently, the Jupyter team announced that after several months of development, they are excited to release the Jupyter visual debugger for the first time.Although this is just the first version, it already allows for common breakpoint debugging and viewing various variables, executing modules, and more.
The new tool is also very easy to use, similar to common debugging methods. If readers want to install this new tool, you first need to install the frontend plugin for JupyterLab:
jupyter labextension install @jupyterlab/debuggerAs for the backend kernel, the Jupyter team states that the kernel currently needs to implement the Jupyter Debug Protocol, so it can only usexeus-python:
conda install xeus-python -c conda-forgeOnce the frontend and backend are properly installed, we can use it directly. The developers also provide an online experience version of the debugger, which requires no installation to try out.Online debugging environment:https://hub.gke.mybinder.org/user/jupyterlab-debugger-hwxovlw4/lab/tree/examples/index.ipynbXeus-python: The first kernel to support Jupyter debuggingXeus is a C++ implementation of the Jupyter kernel protocol. It is not a kernel itself but a library that helps build kernels. It is very useful when developers want to build language kernels like Python or Lua that have C/C++ APIs.Currently, some kernels have been developed using xeus, and the Xeus-python kernel is an option for Python development that was released last year. The reason Xeus-python was chosen by the Jupyter team as the first kernel to implement debugging is mainly due to its two significant advantages:
-
Xeus-python has a pluggable concurrency model that allows the Control channel processing to run in different threads;
-
Xeus-python has a very lightweight codebase, making iteration and updates very convenient.
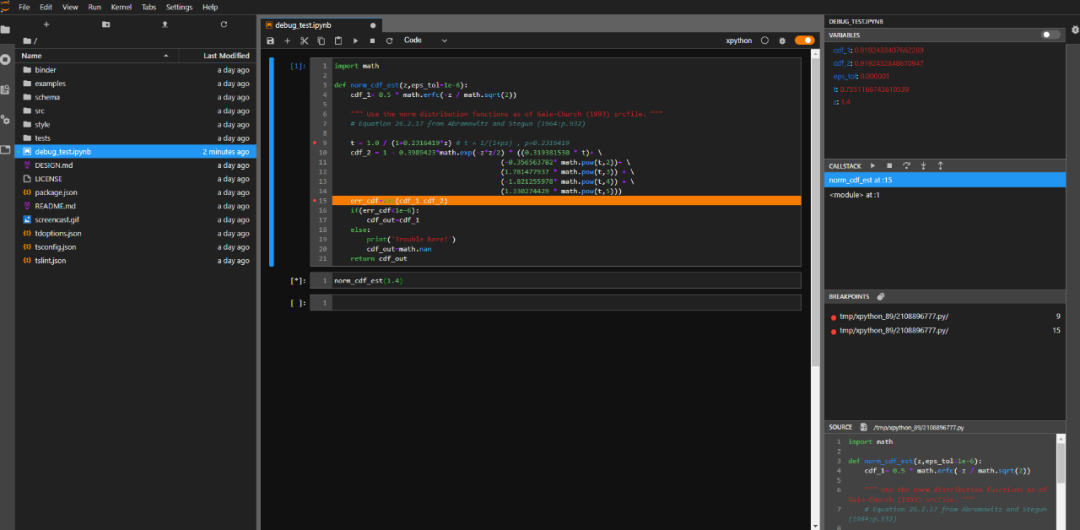
In the short term, xeus-python will also have further enhancement plans, such as adding IPython magic methods and optimizing xeus-python’s PyPI.Deep Dive into the Debugger’s Frontend ArchitectureThe JupyterLab debugger extension provides typical features based on user habits from IDE usage:
-
A sidebar with a resource manager, unordered list, source preview, and navigation to the call stack
-
The ability to set breakpoints directly next to the code (in code cells and the code console)
-
Visual markers indicating the current execution stop location
When using Jupyter notebooks, the execution state is saved in the kernel. However, if we execute a cell and then delete the entire cell, what happens when the user wants to run that code again during debugging? As shown in the animated image below, this plugin supports specific use cases and allows viewing previously executed cells in read-only mode.
Accessing deleted cells
Debugging the code console in JupyterLab
Debugging files in JupyterLabDebugging can be enabled at the notebook level, allowing users to work on another notebook while debugging one.
Simultaneously debugging multiple notebooksUsers can inspect variables using tree and table viewers:
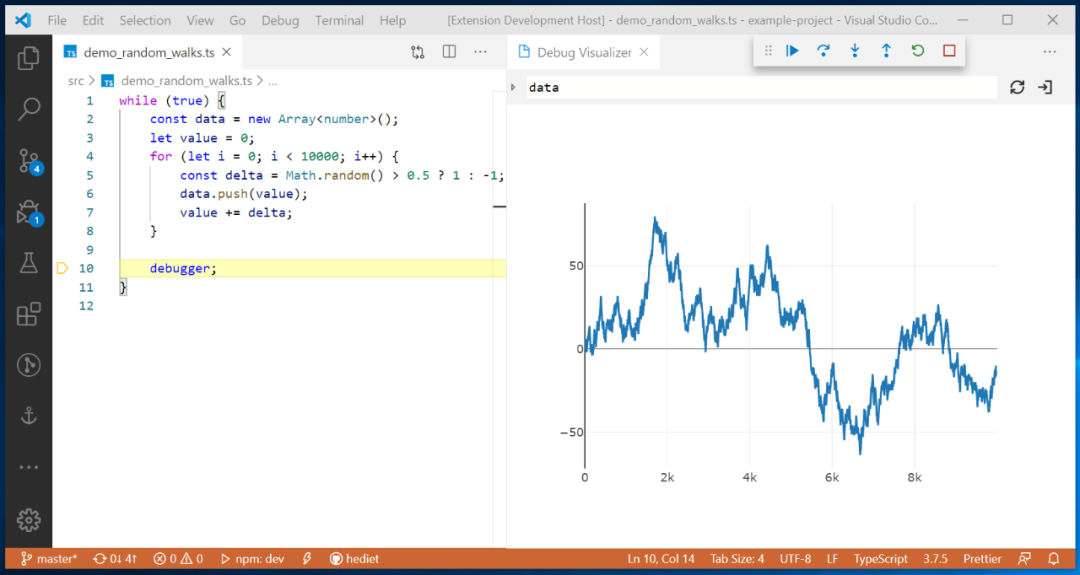
Variable BrowserThe goal of the JupyterLab debugger plugin is to work with any kernel that supports debugging. Through the Debug Adapter Protocol, the debugger plugin can abstract language-specific functionalities and provide users with a matching debugging interface.Additionally, the team plans to make significant improvements to the debugging experience in 2020, such as supporting rich rendering in the variable browser and conditional breakpoints in the UI.VS Code Visual Debugging ToolsDebugging is a long journey. Recently, Machine Heart also introduced a real-time visual debugging tool for VS Code, which can serve as a reference. Helping users find code issues in a more elegant and concise way is one of the future optimization directions, and the previously introduced visual debugging tool can quickly display data structures.From an effect perspective, this tool is more stunning and completely different from traditional debugging display methods, such as setting a breakpoint at line 32 to define a doubly linked list, and then running the code line by line will show the corresponding data structure diagram on the right.
It will also present data structures in different ways, such as trees, tables, curves, and graphs.
It also includes other customizable visualizers that can choose more understandable visualization methods based on different processing objects, such as chart visualization, Plotly visualization, tree visualization, grid visualization, text visualization, etc.
Plotly Visualization
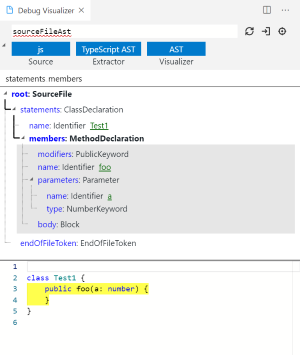
AST VisualizationHowever, the developers of this VS Code debugging tool are exploring its support for Python, and perfect support for Python would make the project more convenient and applicable.For debugging, whether using print() statements, assert statements, or directly setting breakpoints, including various newly launched debugging tools, from the perspective of auxiliary tools, as long as they can improve work efficiency, any debugging tool that suits you is worth trying.Reference links:https://blog.jupyter.org/a-visual-debugger-for-jupyter-914e61716559https://www.reddit.com/r/MachineLearning/comments/foum00/n_jupyter_visual_debugger/
– EOF –
Recommended Reading Click the title to jump
1. Complete Tutorial on Using VS Code with Jupyter Notebook
2. Selection of Common Visualization Frameworks in Jupyter
3. Detailed and Practical PyCharm Tutorial, this article is worth a look
If you find this article helpful, please share it with more people
Recommended to follow “Python Developers” to enhance Python skills

Likes and views are the biggest support❤️