MQTT and Remote Chart Updates
Method Description
Utilize the JS component of the Weilin touch screen with MQTT functionality to achieve remote updates of screen charts.
JS Component
The JS component refers to the JavaScript (JS) components used in the Weilin touch screen system. These components are designed to facilitate the display of dynamic content on the touch screen interface and enhance user experience.
Through the JS components, the touch screen can achieve dynamic content updates and refreshes, allowing users to obtain the latest information and data in real time.
During the configuration development process, developers can use these JS components to build user interfaces, respond to user actions, and exchange data with backend systems. This enables the creation of more rich, flexible, and intelligent touch screen applications to meet various demands in different scenarios.
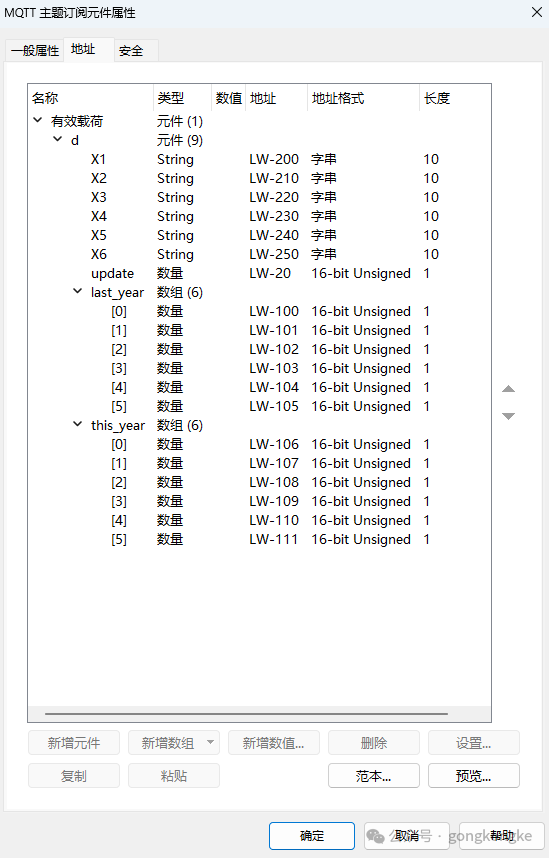
For instance, we can first simply define a radar chart and assign it initial data and labels as follows:
var radarChart = new Chart(ctx, configuration)var configuration = { type: 'radar', data: { labels: [ 'Employee 1', 'Employee 2', 'Employee 3', 'Employee 4', 'Employee 5', 'Employee 6', ], datasets: [{ label: 'Last Year Production', data: [0, 1, 2, 3, 4, 5], fill: true, backgroundColor: 'rgba(255, 99, 132, 0.2)', borderColor: 'rgb(255, 99, 132)', pointBackgroundColor: 'rgb(255, 99, 132)', pointBorderColor: '#fff', }, { label: 'This Year Production', data: [5, 4, 3, 2, 1, 0], fill: true, backgroundColor: 'rgba(54, 162, 235, 0.2)', borderColor: 'rgb(54, 162, 235)', pointBackgroundColor: 'rgb(54, 162, 235)', pointBorderColor: '#fff', }] }, options: { elements: { line: { borderWidth: 3 } }, scales: { r: { beginAtZero: true } } }, };This is a basic code for creating a radar chart, and without modifications, it will have the following effect:
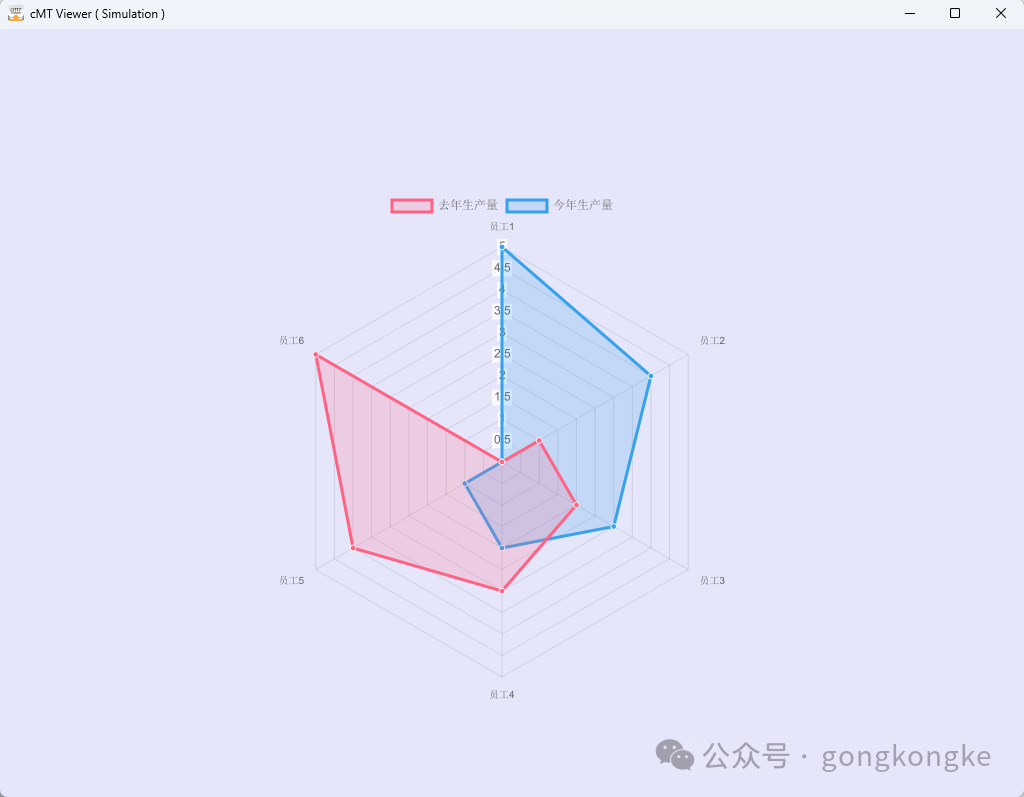
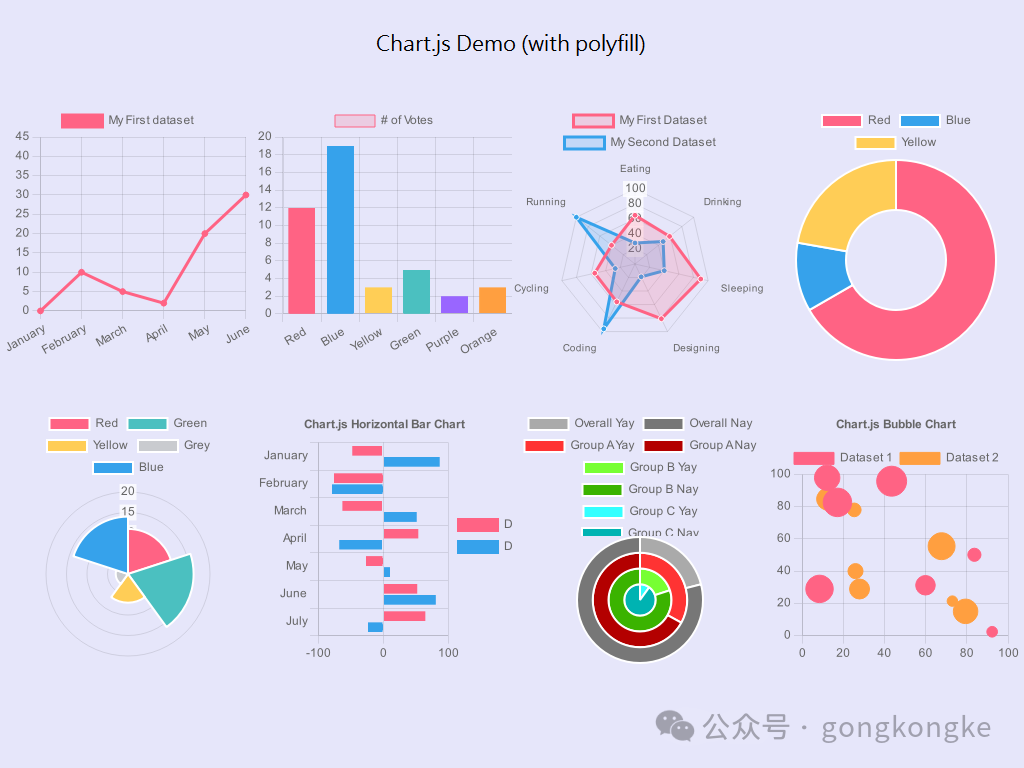
A radar chart (also known as a spider chart or star chart) is a commonly used data visualization tool. It has advantages such as multi-dimensional display, comparability, and wide applicability, making it a powerful and intuitive data visualization tool.
However, after creating the radar chart via the JS component, its data can only be changed by modifying the data in the address, which limits its convenience of use.
So how can we achieve remote changes to the chart? This is where another tool—MQTT—comes into play.
MQTT
MQTT (Message Queuing Telemetry Transport) is a lightweight messaging protocol specifically designed for the Internet of Things (IoT) and machine-to-machine (M2M) communication. It has the following features:
1. Lightweight
The MQTT protocol is designed to be simple, with small message headers and low communication overhead, making it suitable for use in environments with limited bandwidth or unstable network connections, such as sensor networks or mobile devices.
2. Asynchronous Communication
MQTT uses a publish-subscribe model, where the message sender is called the Publisher and the message receiver is called the Subscriber, allowing for asynchronous communication and decoupling between publishers and subscribers.
3. Reliability
MQTT supports QoS (Quality of Service) levels, including Level 0 (At most once), Level 1 (At least once), and Level 2 (Exactly once), allowing users to choose the appropriate level to ensure reliable message transmission based on application needs.
4. Persistent Sessions
MQTT clients can choose whether to create persistent sessions, which retain the client’s subscription information. When the client reconnects, the subscription relationship is automatically restored, ensuring that messages are not lost.
5. Last Will Messages
MQTT allows clients to set a last will message, which the server will send to other clients subscribed to that client’s topic when the client disconnects unexpectedly, to handle exceptional situations.
6. Security
MQTT supports TLS/SSL encryption protocols, ensuring the security of communications and preventing messages from being intercepted or tampered with.
The numerous advantages of MQTT make it one of the widely used protocols in IoT and M2M communications.
Here, we will use a free MQTT tool for demonstration.
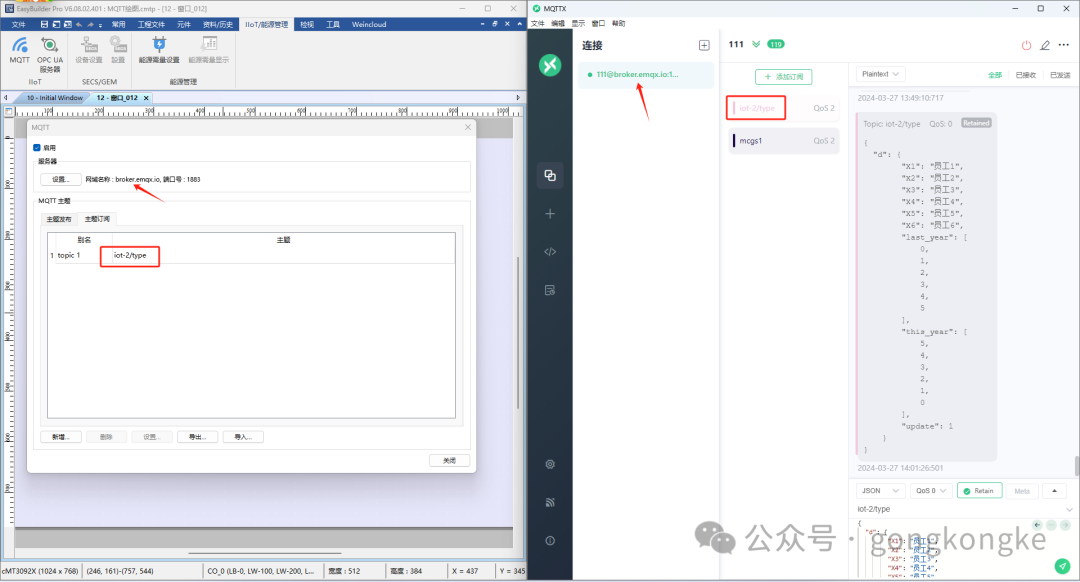
By connecting to the same domain and publishing/subscribing to the same topic, we can achieve remote changes to the data in the touch screen address.
Similarly, data can also be sent remotely; just configure it in the topic publishing.
Thus, when we update charts or change data, we are not limited by distance, because MQTT is an application layer protocol based on TCP/IP, allowing for communication over the Internet. Therefore, in theory, communication can occur over any distance as long as there is a network connection.
Below is a demonstration of the effect:
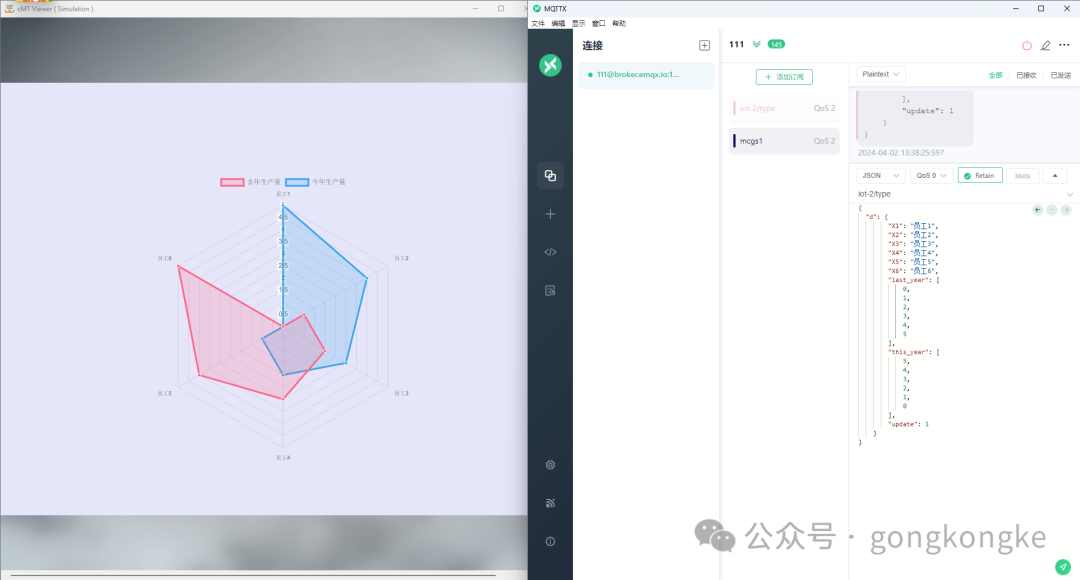
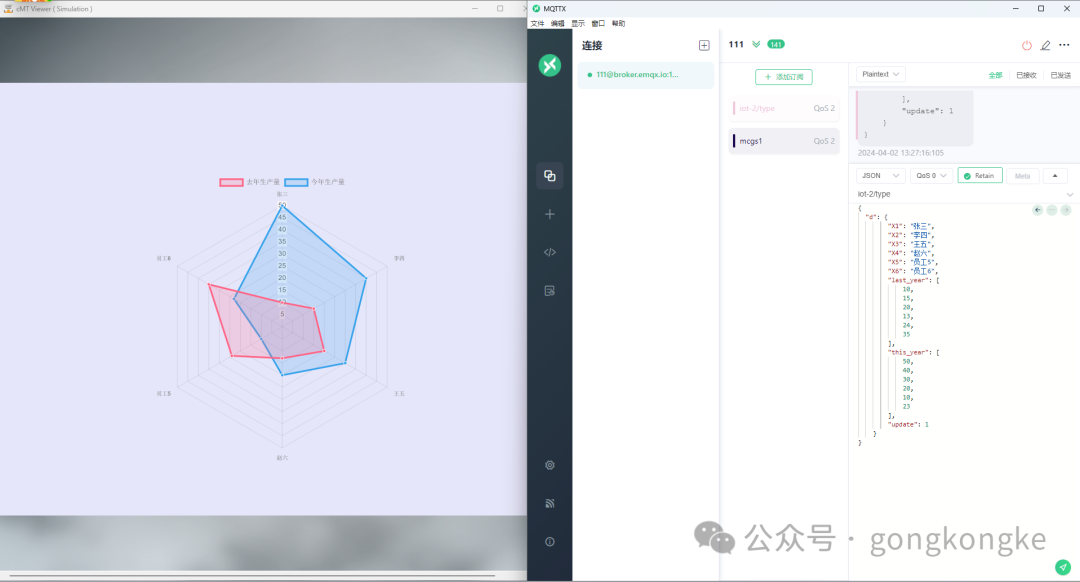
This is the effect displayed using the MQTT tool. In practical use, we can publish and subscribe to topics using various devices and methods, achieving the interconnection of all things.
For example, in the manufacturing industry, we can have the touch screen subscribe to topics published by the company server, displaying commands, processing technology, and other content issued by the server in real time. This allows operators to clearly understand the task arrangements for the day.
Alternatively, we can use PLCs to collect data from various devices on the factory production line (such as sensors, robots, etc.) and transmit data in real time through MQTT for monitoring and control of the production process.
In our daily lives, MQTT also has many application scenarios, such as in smart homes.
Devices in smart home systems (such as smart bulbs, smart plugs, smart locks, etc.) can use MQTT for communication, achieving remote control and monitoring.
These examples are just the tip of the iceberg; MQTT’s applications in the IoT field are extensive, covering almost every industry and sector. We can see MQTT’s presence in agricultural IoT, smart transportation, energy management, environmental monitoring, healthcare, and more.
Appendix