
Notes Summary:
In June, a graduate student from a certain university, focusing on confidential computing.
Chen Weilin, currently engaged in R&D of 5G network acceleration solutions, and a part-time performance researcher.
1. Discussing the Observability of Mobile Performance
Instructor Introduction:
Xia Bing, currently employed at Honor as a senior performance R&D engineer..
1. Overview

Performance on mobile devices refers to a comprehensive change, as can be seen from the above image, mobile phones focus more on the interaction between humans and machines, while cloud systems focus more on the interaction between machines.
The unique aspect of mobile systems is that resources are quite limited, for example: battery, performance… Thus, specific metrics need to be established for user experience..
Metrics (METRIC) – The industry has specific experience measurement models, aiming to identify problems in products and services and understand user behaviors and preferences..
Performance experience measurement is multi-layered, across multiple dimensions, and using a single metric to represent all performance characteristics is far from sufficient.
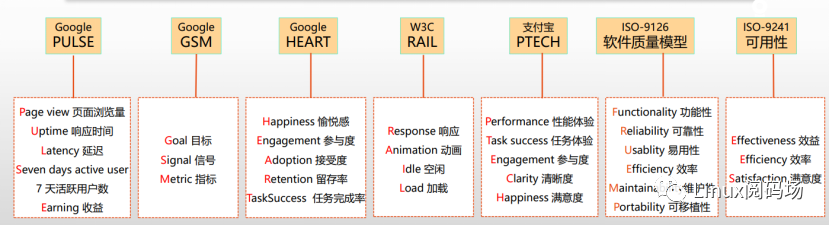
Above are several commonly used metrics, these metrics often complement each other, for example Android has commonly used GSM+HEART in recent years. The measurement model revolves around the user’s journey, identifying key experience paths (KEP), and breaking down different performance metrics for various touchpoints.
2. Performance Tracking
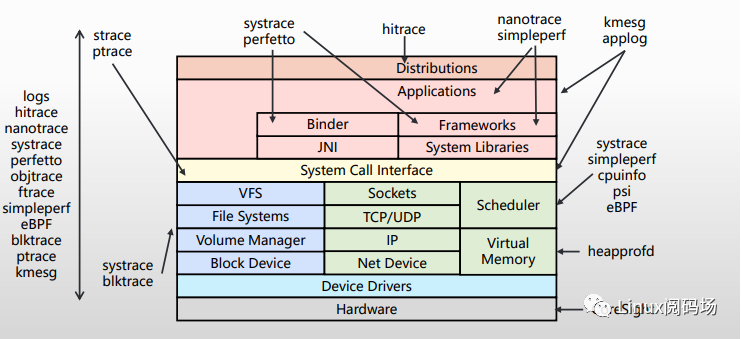
In fact, how to build mobile observability involves a layered breakdown, as can be seen from the above image, with the help of Android/Linux system ecosystems, there are already many tools available for tracking system information.
Challenges of Performance Tracking on Mobile Devices:
1. Low Overhead: It should not degrade user experience, since mobile resources are limited, how to collect data effectively will be a significant challenge.
2. Inaccessible: Developers cannot obtain real-time user fault information from the first scene, as many user operations are not easy to replicate in reality, thus identifying key experience paths will be one of the development processes.
3. Occasional: Low probability, hard to reproduce (Heisenberg Bug) , issues arising from the interaction between third-party applications and the system or user behavior often have sporadic and hard-to-detect problems that require accurate tracking mechanisms to assist in finding the causes.
4. Unforeseeable: Analyzing unknown problems using known patterns.
The instructor introduced some common tools on Android:
žSystrace : A tool for saving device activity to trace files for Android.
žcpu_profile : Periodically collects call stacks on the Android platform.
žsimpleperf : simpleperf is a performance analysis tool for the Android platform, similar in functionality to linux perf.
žnanotrace : Obtains the call chain and function execution duration from APK to framework layer by instrumentation in the virtual machine (including the interpreter and compiler).
žobjtrace : Dyanmically tracks function parameter values.
žblktrace : blktrace combined with btt can measure how long an IO spends in the scheduling queue versus how long it consumes on hardware.
žHitrace : For cross-device/process/thread business process handling, passing the same traceid throughout the entire business process, linking and displaying the call hierarchy and various output information.
3. Logging for Observability
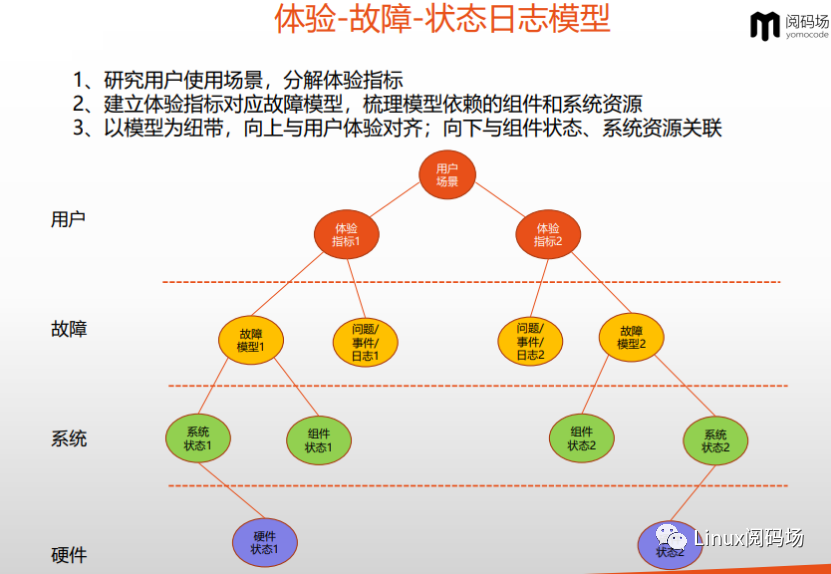
The above image illustrates the importance of logs from top to bottom, first, we need to understand user behavior, focus on user experience and record corresponding error logs, along with system and hardware states to improve user experience..
The logging system of mobile systems often needs to integrate third-party applications, since third-party applications are not open source, managing logs often lacks sufficient permissions, and also mobile storage is limited, therefore the final logging system solutions are aimed at consolidating logs and more precisely establishing models as the goal..
To summarize the above points, user experience is subjective, not merely numbers, thus the speaker believes that technology should have warmth..
Q&A
Q : Are there any AI optimization ideas?
A: Currently still making efforts, trying to use AI to analyze user experience, but the effects are not obvious. Most still focus on basic experience metrics.
Q : How to view benchmark scores versus user experience?
A: Benchmark scores cannot be directly regarded as user experience indicators; accumulated layout shifts can be referenced.
Q: Can nanotrace allow third-party instrumentation?
A: Yes.
Q : Can the wake source be identified?
A: IRQ and IPI interrupt events can be opened to see the wake source.
2. Unveiling ARM Architecture Support for Linux Debugging Features
Instructor Introduction: Zhang Jian, currently employed at Beijing DaJian Technology Co., Ltd., with 14 years of front-line R&D experience in ARM architecture and operating systems. He has delivered technical speeches in multiple cities including Beijing, Berlin, and Las Vegas.
First, this sharing categorizes debugging features from the perspectives of debugging angles and performance impacts.
1. Types of Debugging
Debugging includes two dimensions of characteristics: debugging angle dimension and performance impact dimension.
1. Debugging Angle Dimension
From the debugging angle dimension, debugging is divided into external debug and self-hosted debug. The former includes kernel debugging infrastructure such as openocd, kgdb, ftrace, and perf, while the latter connects chips via architecture-related debugging interfaces like JTAG and FTOI, using debugging software to control hardware debuggers for debugging.
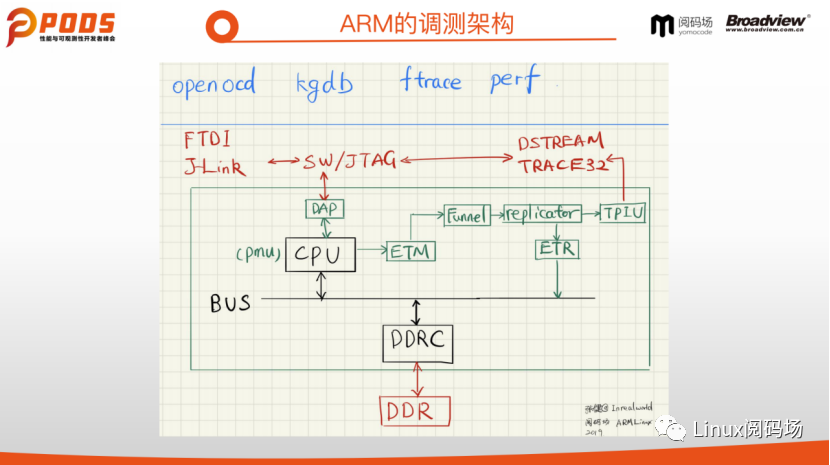
The technologies indicated in red are hardware debugging interfaces, while those in blue are related software debugging tools. Software and hardware debugging tools share the debugging capabilities provided by the CPU and kernel.
2. Performance Impact Dimension
From the performance impact dimension, debugging is divided into intrusive debugging, which affects (mostly halts) the current CPU state, and non-intrusive debugging, which does not affect CPU operation. The former usually pauses the current CPU execution flow and informs other cores of the current debugging state through related mechanisms (e.g., AR cross trigger), thus affecting system state.
This type of debugging, while providing powerful debugging capabilities, requires consideration of the relationship between CPU debugging status and other peripheral devices during chip and kernel design and development, as the debugging state of the CPU does not affect other hardware, and consistency issues are classic challenges of this method; for non-intrusive debugging types, they do not directly stop the current CPU running state, serving more to monitor and track the system.
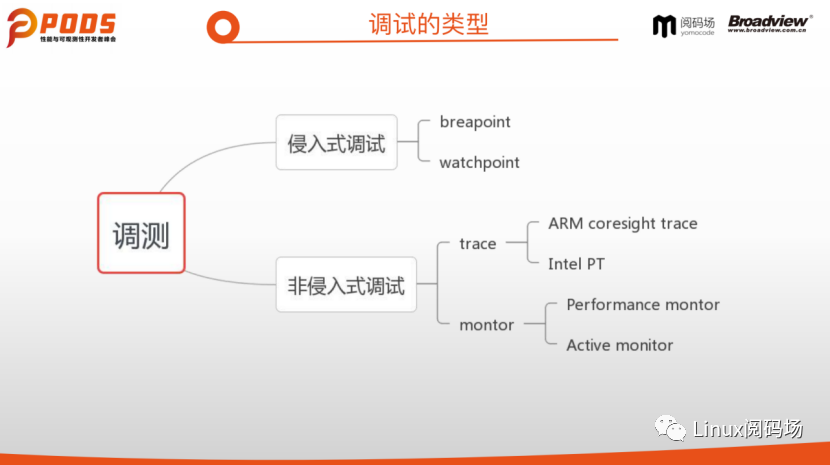
Next, the sharing will discuss the system debugging features of ARM architecture based on three types of debugging methods: breakpoints, Trace, and PMU.
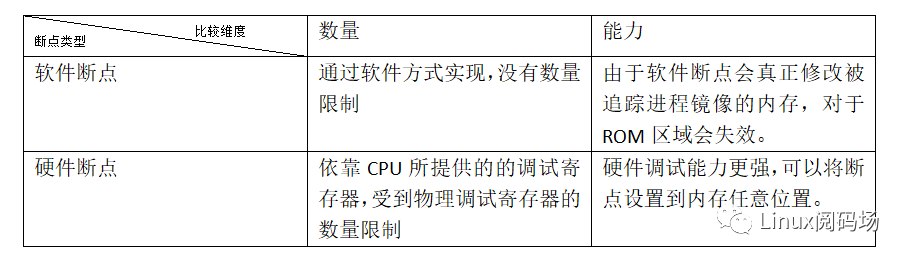
2. Intrusive Debugging Method: Breakpoints
Breakpoint debugging is intrusive; relying solely on user-space infrastructure or top-level applications cannot meet the capability requirements for starting and stopping the system. Therefore, the design of breakpoint debugging requires support from hardware and the operating system, meaning breakpoint debugging must have the ability to enter a high privilege level environment.
Users obtain the specified platform’s gdb debugger by configuring compile options, passing the program to be traced as a parameter to the gdb debugger, which forks a child process of the program being debugged; the two establish a connection through PTRACE_XXX requests.
For software breakpoints, gdb will insert debugging instructions (INT3 for x86, BRK/BRKT for ARM) at the locations specified by the developer using symbol tables and other information; for hardware breakpoints, gdb will write the addresses of specified locations into the debugging registers.
When the program runs to the software or hardware breakpoint, the child process will trigger the corresponding exception; once the exception signal is captured by gdb, it compares the recorded breakpoint information to determine whether the exception was triggered by the debugging cause, thus achieving the ability to start and stop the gdb debugging process.
3. Non-Intrusive Debugging Type: Trace
The ARM Coresight architecture is designed to comply with observability, with the ETM after the Cortex Processor responsible for capturing instruction sequences outside the processor without affecting the CPU’s operational state. Moreover, the Trace information transmission does not go through the system bus, reducing the impact on system bandwidth. There are multiple execution flow capture points in the Coresight architecture, with multiple corresponding ETMs, and the information collected by multiple ETMs is sent to downstream funnels, which will process the execution flow information based on the information present in the data.
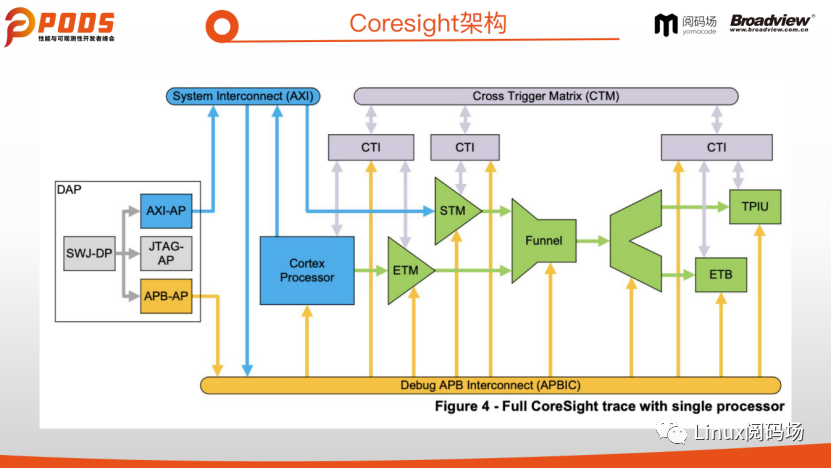
For specific interconnection structures, refer to the corresponding version of the device tree file (located in the source code directory /arch/arm64/boot/dts).
4. Non-Intrusive Debugging Type: Performance Monitor Unit (PMU)
The CPU contains a PMU component that monitors relevant performance information of the CPU, and users can access the corresponding registers to obtain related information. Perf is a user-space tool that can access the PMU.
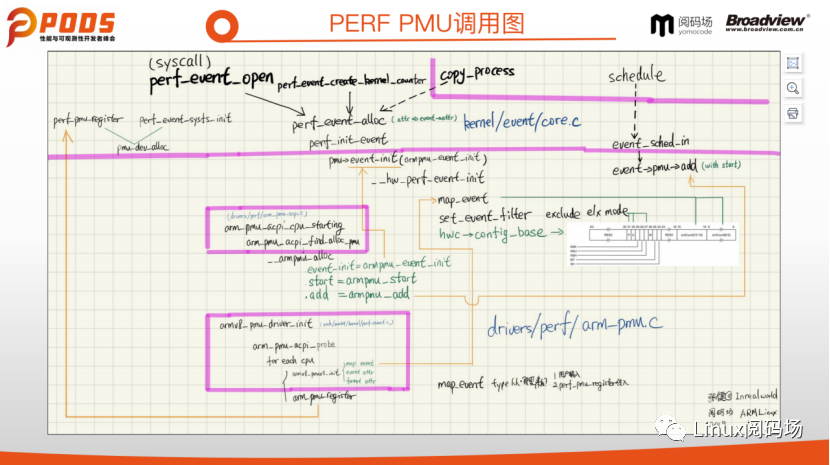
The process for perf to access PMU is as follows:
1. Register PMU events using perf_pmu_register.
2. Use the perf_event_open system call to open the file descriptor for the corresponding event and read the recorded values.
Scan to add customer service Xiao Ma’s WeChat to join the group.