In the process of Linux system operation and maintenance, performance optimization is a crucial task. Disk I/O performance is often one of the key factors affecting the overall performance of the system. To accurately grasp the status of disk I/O, it is necessary to use some practical tools, and the iostat command is one of them.
The full name of the iostat command is Input/Output Statistics, which is part of the sysstat toolkit. Its main responsibility is to monitor CPU usage and disk I/O statistics in real-time. If this command is not available on your system, you can install it using the following methods:
For Debian/Ubuntu systems:
sudo apt install sysstat
For CentOS/RHEL systems:
sudo yum install sysstatOnce the installation is complete, we can happily use the iostat command.
Basic Syntax and Output Analysis of iostat
The syntax of the iostat command is relatively simple and can usually be expressed as:
iostat [options] [interval] [count]
Here, “options” are used to specify the specific functions of iostat, such as displaying only CPU information or only disk information; “interval” is in seconds, indicating how often to output the statistics; and “count” specifies how many times to output such statistics. If “interval” and “count” are not specified, iostat will directly output the average since the system was started.
Explanation of Output Fields
Next, we will take the common output of the iostat -x command as an example to explain the meaning of each field in detail. Suppose we execute the command iostat -x 2 3, which outputs detailed information every 2 seconds for a total of 3 times.
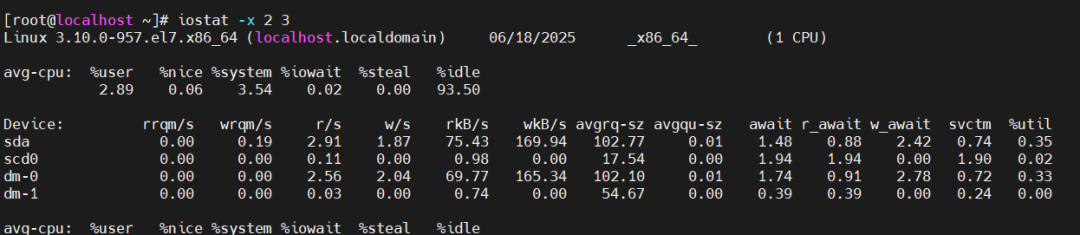 avg-cpu Section%user: The percentage of CPU time spent running user space programs. In simple terms, it is the proportion of time spent executing our own applications on the CPU relative to the total CPU time.%nice: The percentage of CPU time spent running user space programs with adjusted nice values. Generally, this value is not particularly large unless you manually adjust the priority of certain programs.%system: The percentage of CPU time spent running kernel space programs. This includes CPU time spent on operations such as handling interrupts and scheduling processes.%iowait: This is a critical indicator that represents the percentage of time the CPU spends waiting for disk I/O operations to complete. If this value is too high, it indicates that there may be a bottleneck in disk I/O, which is dragging down system performance.%steal: In a virtual machine environment, this is the percentage of time the current virtual CPU is waiting while the host’s hypervisor serves other virtual processors. For physical machines, this value is usually 0.%idle: The percentage of time the CPU is idle. The higher this value, the more idle the CPU is; conversely, a lower value indicates a busier CPU.Device SectionDevice: Indicates the name of the disk device, such as sda, which is a disk device.rrqm/s: The number of read requests merged per second. Sometimes, the system merges multiple small read requests into a larger one to improve disk I/O efficiency; this value reflects the rate of such merged read requests.wrqm/s: The number of write requests merged per second. Similar to rrqm/s, but this value reflects the merging of write requests.r/s: The number of read operations initiated from the disk per second. This is the number of read operations initiated to the disk every second.w/s: The number of write operations initiated to the disk per second. This is the number of write operations initiated to the disk every second.rkB/s: The amount of data read from the disk per second, in KB. This value intuitively reflects the disk’s read data rate.wkB/s: The amount of data written to the disk per second, in KB. Similarly, it reflects the disk’s write data rate.avgrq-sz: The average number of sectors per I/O request. This can be understood as the average size of data blocks for each read/write operation.avgqu-sz: The average length of the disk request queue. If this value is too large, it indicates that many I/O requests are waiting to be processed, which may indicate disk I/O performance issues.await: The average wait time for each I/O operation, in milliseconds. This includes not only the time the disk device actually spends processing I/O but also the time I/O requests spend waiting in the queue.r_await: The average wait time for each read operation, in milliseconds. This separately counts the wait time for read operations, helping us analyze read performance issues more accurately.w_await: The average wait time for each write operation, in milliseconds. This corresponds to r_await, counting the wait time for write operations.svctm: The average service time for each I/O operation, in milliseconds. This value theoretically represents the actual time the disk device spends processing I/O operations, but it may not be very accurate in some cases and is for reference only.%util: The degree of busyness of the disk device, indicating the percentage of CPU time occupied by disk I/O operations. When this value approaches 100%, it indicates that the disk is running close to full capacity, which may lead to performance bottlenecks.
Practical Application of the iostat Command
In actual operation and maintenance, we often need to understand the CPU and disk I/O load of the system in real-time to promptly identify performance issues. At this point, we can use the iostat command with appropriate options. For example, if we want to observe the CPU and disk I/O load of the system in real-time, updating the information every 5 seconds, we can execute the following command:
iostat 5
With this command, we can clearly see the changes in CPU usage over each 5-second interval, as well as the I/O operations of each disk device, such as the number of reads and writes per second and the amount of data read and written. This is very helpful for quickly determining whether there are performance bottlenecks in the system.
I hope everyone can make good use of the iostat command in their daily Linux operation and maintenance work, continuously accumulating experience and improving their system performance optimization skills. If you encounter any issues during use or have any insights, feel free to share them in the comments!