
Produced by Big Data Digest
Source: Medium
Translated by: Zhu Shuai, Xue Qing, Xia Yawei
This is an introductory guide to pandas, where the author uses simple language and straightforward example code to showcase the overview of pandas and some advanced operations. “… It is a library that everyone engaged in data science must master,” “… pandas is one of the reasons why Python is so user-friendly.” Is pandas really that great? Let’s take a look!
Python is an open-source programming language that is very convenient to use, but it also has some inherent issues common to open-source languages: there are many libraries available to implement a function. For beginners in Python, it can be challenging to know which library is best to call for a specific function. At this point, experienced individuals are needed to provide guidance. This article aims to tell you: there is a library that all data science practitioners must master, and that library is called “pandas.”
The most interesting aspect of pandas is that it encompasses many functionalities of other Python libraries, meaning that pandas is a comprehensive library. This implies that, many times, you can accomplish most tasks using just pandas.
Pandas is like Excel in Python: its basic data structure is a table (called “DataFrame” in pandas), which allows for various operations and transformations on the data. Of course, it can do many other things as well.
If you are already familiar with Python, feel free to skip to the third section.
Let’s get started:
import pandas as pdDon’t ask me why I use “pd” instead of “p” or some other abbreviation; the fact is, everyone uses it this way, and you should too! 🙂 (Just having a bit of fun~)
Beginner Functions in Pandas
Reading Data
data=pd.read_csv('my_file.csv')data=pd.read_csv('my_file.csv', sep=';', encoding='latin-1', nrows=1000, skiprows=[2,5])The sep parameter indicates the delimiter. If you are dealing with French data, the CSV delimiter used in Excel is “;”, so you need to explicitly declare the delimiter with this parameter. The encoding parameter should be set to “latin-1” to recognize French characters; nrows=1000 indicates reading the first 1000 rows of data; skiprows=[2,5] means to skip the data in the 2nd and 5th rows when reading the file.
The most commonly used functions are: read_csv and read_excel.
Other very useful functions include: read_clipboard and read_sql.
Writing Data
data.to_csv("my_new_file.csv", index=None)By setting index=None, the data will be written to the file exactly as it is. If you do not specify index=None, the program will add an index column to the file, which will be at the front of all columns, with values 0, 1, 2, 3… up to the last row.
I generally do not use functions like .to_excel, .to_json, or .to_pickle because the .to_csv function is already very useful! Moreover, CSV is currently the most commonly used file format for storing tabular data.
Checking Data
data.shapeValidates whether the (rows, columns) information matches the number of rows and columns in the data.
data.describe()Calculates some basic statistics, such as count, mean, standard deviation, and percentiles.
Viewing Data
data.head(3)Prints the first 3 rows of data. Similar to the .head() function, you can also use the .tail() function to view the last few rows of data.
data.loc[8]Prints the row with index 8. (Note that indexing starts from 0 by default.)
data.loc[8,'column_1']Prints the data corresponding to row index 8 and column name ‘column_1’.
data.loc[range(4,6)]Outputs the row data from index 4 to 6 (excluding 6).
Basic Functions in Pandas
Logical Operators
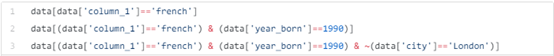
Use logical operators to subset data. You can use & (AND), ~ (NOT), and | (OR) as common operators, remembering to add parentheses around logical operations.
data[data['column_1'].isin(["french", "english"]) ]If you need to use a lot of OR operations on the same column, it is common to use the .isin() function instead.
Basic Plotting Functions
This functionality is mainly due to the matplotlib library. As mentioned in the introduction, most of this library’s features can be directly used through pandas.
data['column_numerical'].plot()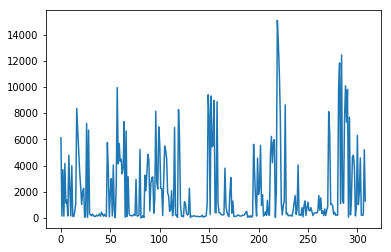
Example output of the .plot() function
data['column_numerical'].hist()This function plots a distribution graph (also known as a histogram).
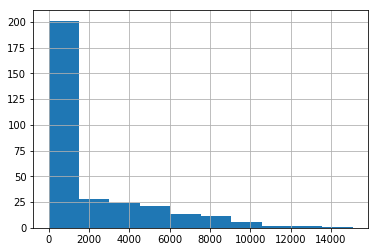
Example output of the .hist() function
%matplotlib inlineIf you are using Jupyter, don’t forget to add this line before plotting (you only need to declare it once in the notebook).
Updating Data
data.loc[8,'column_1']='english'Replaces the value pointed to by row index 8 and column name ‘column_1’ with “english”.
data.loc[data['column_1']=='french','column_1']='French'Changes the values of multiple rows in one line of code.
Now you have learned some common functionalities that can be accomplished in Excel. Next, let’s explore some magical features that Excel cannot achieve!
Intermediate Functions
Counting Frequencies
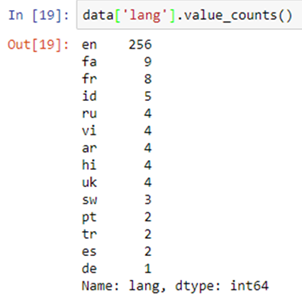
Example output of the .value_counts() function.
Operations on Rows, Columns, or All Data
data['column_1'].map(len)The len() function will be applied to each element under ‘column_1’.
The .map() operation will apply a function to each element of the specified column.
data['column_1'].map(len).map(lambda x: x/100).plot()A very useful feature in the pandas library is the chaining method. It allows you to perform multiple operations in one line of code (like the .map() function and .plot() function here), making it both simple and efficient.
Chaining method:
https://tomaugspurger.github.io/method-chaining
The apply function will apply a function to all columns.
The applymap() function will apply a function to all cells in the table.
tqdm — A Unique Module
When dealing with large datasets, pandas takes some time to complete operations like .map(), .apply(), and .applymap(). tqdm is a very useful library that can predict when these operations will finish. (Okay, I lied; I previously said we only use the pandas library). You can install tqdm using the command “pip install tqdm”.
from tqdm import tqdm_notebooktqdm_notebook().pandas()Using pandas to create tqdm progress
data['column_1'].progress_map(lambda x: x.count('e'))Replace .map() with .progress_map() function, and the same goes for .apply() and .applymap() functions.

This is the progress bar you can see after using tqdm and pandas in Jupyter.
Correlation Matrix and Scatter Matrices
data.corr()data.corr().applymap(lambda x: int(x*100)/100)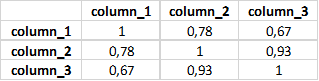
Using .corr() gives you the correlation matrix of all columns.
pd.plotting.scatter_matrix(data, figsize=(12,8))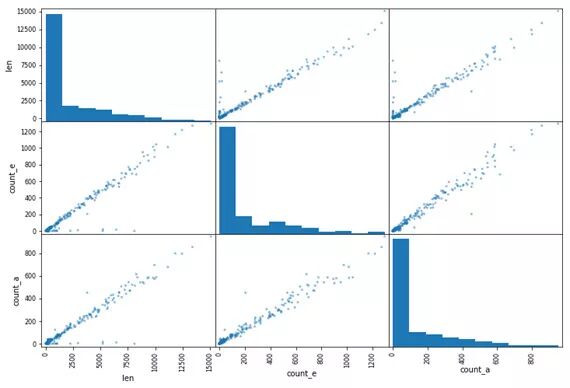
Example of scatter matrices. It plots all combinations of values from two columns in the same graph.
Advanced Operations in Pandas
SQL Join Functionality
Join operations in Pandas are very simple.
data.merge(other_data, on=['column_1', 'column_2', 'column_3'])With just one line of code, you can join three columns together.
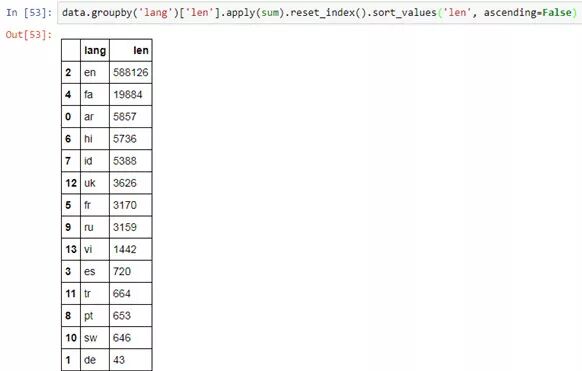
Grouping Functionality
When you first start using this functionality, it may not be easy; you first need to master some syntax knowledge, but then you will find that you cannot live without this functionality.
data.groupby('column_1')['column_2'].apply(sum).reset_index()Groups the data based on a certain column and then performs some function operation on another column’s data. The .reset_index() function can convert the data into a DataFrame format.
As previously mentioned, using chaining methods to implement as many function features as possible in one line of code can greatly optimize code structure. (Digest reminder: but also consider the readability of the code~)
Iterating Rows
dictionary={}for i, row in data.iterrows():dictionary[row['column_1']]=row['column_2']The .iterrows() function retrieves two variables simultaneously and implements a loop: the row index and the row object (which are i and row in the above code).
In summary, the pandas library is one of the reasons why Python is so user-friendly.
It is difficult to comprehensively showcase all the functionalities of the Pandas library in this article, but through the above content, you should understand why a data scientist cannot do without the Pandas library. Overall, the Pandas library has the following advantages:
-
Convenient and easy to use, hiding all complex and abstract computational processes;
-
Most functionalities are implemented in a very intuitive way;
-
Fast, although it is not the fastest data analysis library (optimized in C language).
Pandas is a very important tool that helps data scientists quickly read and understand data, completing their work more efficiently.
Alright, if you find this article useful, please remember to give the Digest a thumbs up, haha 🙂 Additionally, the Digest also suggests that everyone regularly check the official documentation and API!
Related reports:
https://towardsdatascience.com/be-a-more-efficient-data-scientist-today-master-pandas-with-this-guide-ea362d27386
Volunteer Introduction
Reply with “Volunteer” to join us