The Journal of Surveying Science
Building Bridges with Academia to Shorten the Distance to Authority
Monitoring Drought Events in Southwest China Using GPS Vertical Displacement
YAO Chaolong1 , LUO Zhicai2, HU Yueming1,3,4,5
 , WANG Changwei1, ZHANG Rui1, LI Jinming1
1. College of Natural Resources and Environment, South China Agricultural University, Guangzhou 510642, China; 2. MOE Key Laboratory of Fundamental Physical Quantities Measurement, Institute of Geophysics, School of Physics, Huazhong University of Science and Technology, Wuhan 430074, China; 3. Key Laboratory of the Ministry of Land and Resources for Construction Land Transformation, South China Agricultural University, Guangzhou 510642, China; 4. Guangdong Provincial Key Laboratory of Land Use and Consolidation, South China Agricultural University, Guangzhou 510642, China; 5. Guangdong Province Land Information Engineering Technology Research Center, South China Agricultural University, Guangzhou 510642, China
Received: 2018-06-27; Revised: 2019-02-21
Funded by: National Natural Science Foundation of China (41604017); Open Fund of Key Laboratory of Geospace Environment and Geodesy, Ministry of Education, Wuhan University (17-01-08); Dean’s Fund of College of Natural Resources and Environment, South China Agricultural University (ZHXY2018A01)
First Author: YAO Chaolong (1986-), Male, PhD, Lecturer, Research direction: time-variable gravity field, GNSS theory and applications. E-mail: [email protected]
Corresponding Author: HU Yueming E-mail: [email protected]
Abstract: GPS vertical displacements contain information on the elastic deformation of the Earth caused by changes in terrestrial water storage (TWS). This paper analyzes drought events in Southwest China using vertical displacement data from 31 GPS stations of the Crustal Movement Observation Network of China (CMONOC) from August 2010 to December 2016. The results show a strong negative correlation between the seasonal variation of GPS vertical displacement and precipitation, GRACE-derived water storage, and river water level changes. The abnormal variations (non-seasonal changes) correlate strongly with the Composite Meteorological Drought Index (CI) and the GRACE Drought Severity Index (GRACE-DSI) used in China (correlation coefficient of about -0.70), while the correlation with the Standardized Precipitation Evapotranspiration Index (SPEI) is weaker. Compared to the CI drought index, GPS vertical displacement can better detect drought events caused by sudden decreases in short-term rainfall. Data loss affects the accuracy of GRACE-DSI in detecting drought, while SPEI exhibits significant fluctuations and tends to overestimate the severity of certain short-term rainfall deficits. The study results demonstrate the reliability and advantages of GPS in drought monitoring.
Keywords: GPS vertical displacement terrestrial water storage GRACE drought
Detecting droughts in Southwest China from GPS vertical position displacements
YAO Chaolong1 , LUO Zhicai2, HU Yueming1,3,4,5
 , WANG Changwei1, ZHANG Rui1, LI Jinming1
1. College of Natural Resources and Environment, South China Agricultural University, Guangzhou 510642, China;2. MOE Key Laboratory of Fundamental Physical Quantities Measurement, Institute of Geophysics, School of Physics, Huazhong University of Science and Technology, Wuhan 430074, China;3. Key Laboratory of the Ministry of Land and Resources for Construction Land Transformation, South China Agricultural University, Guangzhou 510642, China;4. Guangdong Provincial Key Laboratory of Land Use and Consolidation, South China Agricultural University, Guangzhou 510642, China;5. Guangdong Province Land Information Engineering Technology Research Center, South China Agricultural University, Guangzhou 510642, China
Foundation support: The National Natural Science Foundation of China (No. 41604017); The Key Laboratory of Geospace Environment and Geodesy, Ministry of Education, Wuhan University (No. 17-01-08); The Dean’s Fund of College of Natural Resources and Environment, South China Agricultural University (No. ZHXY2018A01)
First author: YAO Chaolong (1986—), male, PhD, lecturer, majors in the theory and applications of time-variable gravity field and GNSS. E-mail:[email protected].
Corresponding author: HU Yueming E-mail: [email protected].
Abstract: The solid Earth responds elastically to terrestrial water storage (TWS) changes. Here global positioning system(GPS) vertical position data at 31 stations from the Crustal Movement Observation Network of China (CMONOC) from August 2010 to December 2016 are used to detect droughts in Southwest China. Monthly GPS vertical position displacements respond negatively to precipitation changes and TWS changes observed by gravity recovery and climate experiment(GRACE) as well as river water level variations. GPS vertical position anomalies (the nonseasonal term) are well correlated negatively (correlations of about -0.70) with the commonly used meteorological composite index (CI) in China and the GRACE drought severity index (GRACE-DSI), but less correlated with the standardized precipitation evapotranspiration index (SPEI). Compared to CI, GPS vertical position anomalies have the advantage in detecting droughts caused by abrupt precipitation deficits in a short time period. GRACE-DSI is less accurate in drought monitoring for some periods due to the missing data, while the severity of abrupt precipitation absent in some cases can be overestimated from SPEI with big variability. This study shows the reliability and advantages of GPS data in drought monitoring.
Key words: GPS vertical displacement terrestrial water storage GRACE drought
The drought issue is not only one of the major research topics in the global Earth science community but also a focal point of concern for governments and the public worldwide. Drought disasters not only lead to ecological degradation and significant economic losses but can also trigger social issues such as famine, mass migration, and casualties. China is one of the countries most severely affected by drought, making drought monitoring, assessment, and forecasting research of great significance. Drought characteristics (intensity, duration, and impact range) are typically described using a composite numerical representation of surface wetness (i.e., drought index). Traditional drought indices are mainly based on ground observations and remote sensing data. Due to the uneven distribution and limited number of hydrometeorological stations, ground observations are often inadequate for reflecting large-scale drought conditions, while drought indices based on multi-spectral, multi-temporal, and multi-angular remote sensing information are primarily used for qualitative or semi-quantitative analyses of agricultural drought. Furthermore, the applicability of different drought indices varies across regions in China, including commonly used Palmer Drought Index and the Comprehensive Meteorological Drought Index (CI) used in China. Since 2002, GRACE (Gravity Recovery and Climate Experiment) has provided new avenues for large-scale monitoring of terrestrial water storage changes, which has been utilized for drought event studies in regions such as Xinjiang and Southwest China. However, GRACE data has suffered from significant missing data since 2011, and there are data gaps between GRACE and GRACE Follow-On missions, severely affecting the application of this data. Therefore, to better monitor the characteristics and evolution trends of drought, there is an urgent need to explore new drought monitoring methods.
GPS coordinate time series contain information on the elastic deformation of the Earth caused by changes in surface loading, closely related to variations in environmental factors such as atmospheric pressure, seabed pressure, snow, ice, surface water, and groundwater. Among these, changes in terrestrial hydrological loading are significant contributors to periodic vertical deformations observed at GPS stations. An increase in terrestrial hydrological loading leads to subsidence, causing the vertical position of GPS stations to move downward. Conversely, a decrease in terrestrial hydrological loading causes the surface to rebound, making the vertical position of GPS stations move upward. After accounting for non-terrestrial hydrological effects such as tidal, atmospheric, and crustal movements, GPS vertical displacements can be used to infer regional water storage changes and monitor water losses caused by drought. Recent domestic research results indicate that GPS vertical displacements can detect annual variation characteristics of drought in Southwest China and infer changes in terrestrial water storage in that region, but have not compared GPS vertical displacements with drought indices to analyze their reliability in drought monitoring. Additionally, the ability of GPS to detect drought events is influenced by regional environmental characteristics and station distribution.
China’s Crustal Movement Observation Network Phase II project has been operational for nearly a decade, providing a solid data foundation for hydrological geodesy research. The Southwest region hosts the densest distribution of GPS stations in the Crustal Movement Observation Network. This study, by considering rainfall, water storage changes, river water level variations, and various drought indices, explores the reliability and advantages of GPS vertical displacements for monitoring actual drought events, providing new methods for drought monitoring.
1 Data and Methods1.1 Processing of GPS Vertical Displacement Data
This study utilizes daily vertical displacement time series data from 33 GPS stations (Fig. 1) provided by the GNSS Data Product Service Platform of the China Earthquake Administration from August 2010 to December 2016. The average distance between stations is approximately 100 km. After analyzing data quality, data from 31 stations were ultimately used for the study. The product has accounted for the effects of solid tide, ocean tide, and pole tide. To mitigate random noise in GPS vertical displacements, a second-order Butterworth filter (with a normalized cutoff frequency of 0.087) was applied to perform low-pass filtering on daily solution data. Figure 2 shows that Butterworth filtering can effectively reduce the impact of random noise and discontinuous outliers, providing more accurate data for subsequent research. However, several stations still contained outlier data in the monthly GPS vertical displacement time series averaged over the month. The handling methods for stations with significant data anomalies (Fig. 3) are as follows: ① The vertical displacement at SCMB station showed discontinuous jumps, and SCML station data contained significant systematic bias. Due to the inability to determine the cause, inappropriate corrections could significantly impact research results, so all data from these two stations were directly excluded; ② For GPS stations with continuous outliers, the standard deviation of vertical displacements for all 31 GPS stations relative to the average value of all stations was calculated (one standard deviation corresponding to each month). When the absolute value of vertical displacement at a GPS station in a month exceeded three times the standard deviation, it was deemed an outlier and removed, including abnormal data from SCJL, SCNN, YNJP, and YNYM stations, such as data with significant deviations between 2012-2013 and 2015-2016. To extract the hydrological effects from GPS vertical displacements, the atmospheric model MERRA2 was used to account for atmospheric loading effects. Since non-tidal ocean load has a minimal impact on vertical deformation in most inland areas (approximately 1 mm), this factor was ignored.
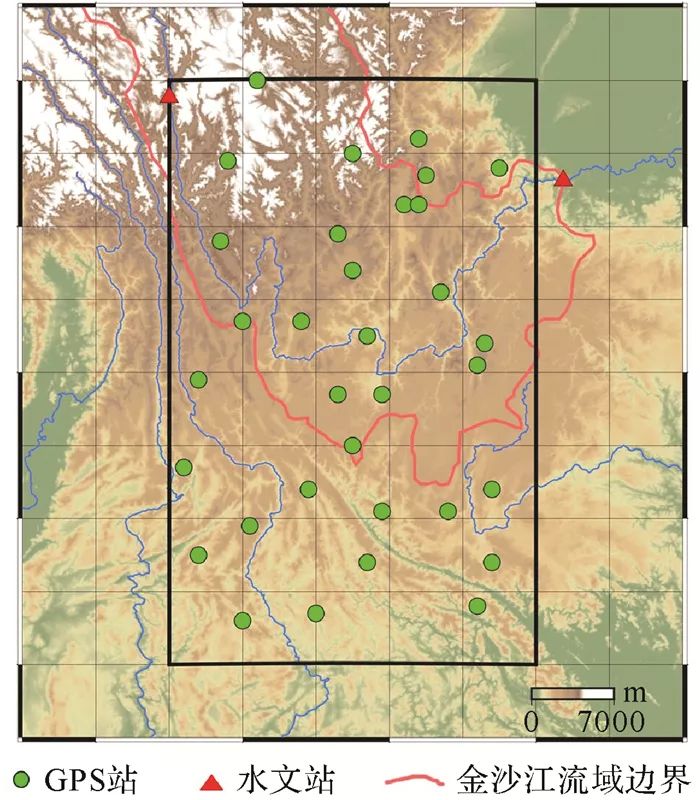 |
| Fig. 1 Locations of the GPS stations and two gaging stations in the Jinsha River basin |
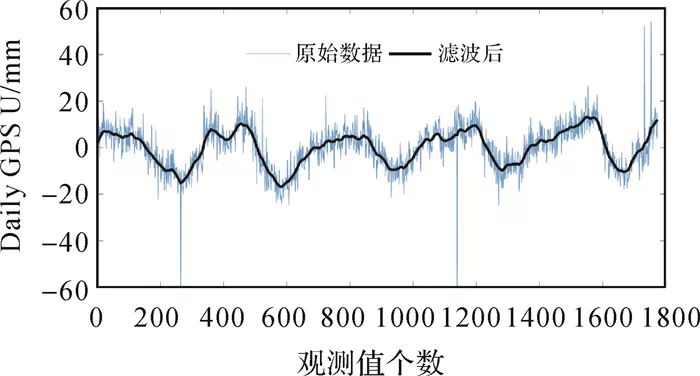 |
| Fig. 2 Time series of daily GPS vertical position variations at YNHZ before and after filtering |
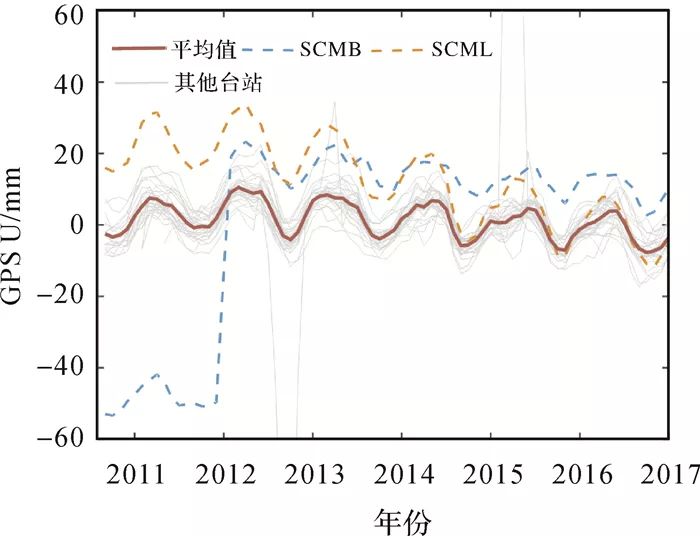 |
| Fig. 3 Monthly GPS vertical position variations at each station and the regional mean time series |
1.2 Hydrometeorological Data and Drought Index Data
This study utilizes GRACE-derived water storage changes (GRACE TWSC), river water level observations, and rainfall data to analyze the hydrological effects reflected by GPS vertical displacements, and verifies the reliability of GPS monitoring drought using three drought indices. GRACE data is based on JPL’s Mascon products, and missing data for certain months were obtained through linear interpolation. River water level data were collected from two hydrometric stations in the Jinsha River basin, Pingshan and Gangtuo (Fig. 1). Rainfall data were obtained from the National Meteorological Science Data Sharing Service Platform of the China Meteorological Administration, with missing data for December 2016 filled in through linear interpolation. Drought index data include the GRACE Drought Severity Index (GRACE-DSI), Standardized Precipitation Evapotranspiration Index (SPEI), and the Comprehensive Drought Index (CI) provided by the National Climate Center of the China Meteorological Administration. Detailed data information is shown in Table 1. It should be noted that although JPL Mascon products are in a 0.5°×0.5° format, their actual resolution is 3°×3°, approximately 300 km.
Table 1 Information about the adopted hydro-meteorological data and drought indices
| Type | Name | Time Range | Spatial Expression |
| Hydrological Data | GRACE TWSC | 2010-08—2016-12 | 0.5°×0.5° |
| Water Level | Pingshan | 2010-08—2012-04 | Station |
| Gangtuo | 2010-08—2013-12 | Station | |
| Meteorological Data | Rainfall | 2010-08—2016-12 | 0.5°×0.5° |
| Drought Index | GRACE-DSI | 2010-08—2016-12 | 0.5°×0.5° |
| SPEI | 2010-08—2015-12 | 0.5°×0.5° | |
| CI | 2010-08—2016-12 | Station |
GRACE-DSI is used to reflect hydrological drought and is established based on GRACE-derived terrestrial water storage changes, containing changes in all hydrological elements (surface water, soil moisture, groundwater, etc.). SPEI is a meteorological drought index constructed based on the Standardized Precipitation Index (SPI) by incorporating potential evapotranspiration (influenced by temperature). CI is a meteorological drought index used by the National Climate Center for drought monitoring, calculated using the SPI indices for the past 30 days (monthly scale) and 90 days (seasonal scale) along with the 30-day wetness index. Table 2 provides the drought degree classification for each index.
Table 2 Drought degree classification of the three drought indices
| Grade Classification | GRACE-DSI | SPEI | CI |
| Normal | -0.49~0.49 | — | > -0.60 |
| Minor Drought | -0.79~-0.50 | 0~-0.99 | -1.20~-0.60 |
| Moderate Drought | -1.29~-0.80 | -1.49~-1.00 | -1.80~-1.20 |
| Severe Drought | -1.59~-1.30 | -1.99~-1.50 | -2.40~-1.80 |
| Extreme Drought | -1.99~-1.60 | < -2.00 | — |
| Extraordinary Drought | < -2.00 | — | < -2.40 |
2 Results and Discussion2.1 Analysis of Hydrological Effects of GPS Vertical Displacement
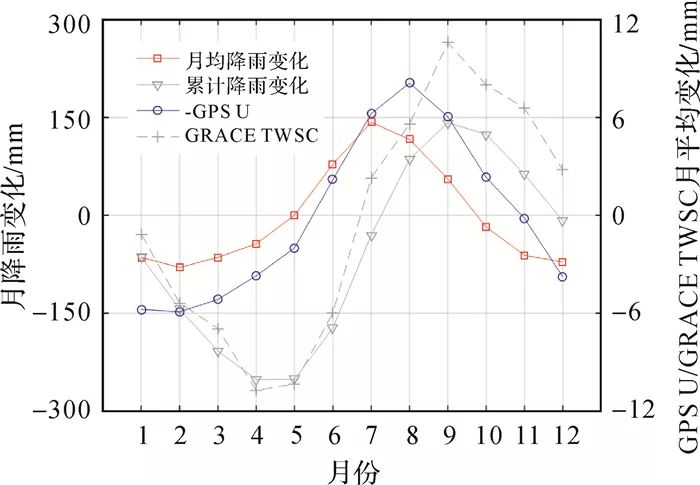
Figure 4 shows the average vertical displacements of 31 GPS stations and the monthly average changes in GRACE water storage and rainfall in the region. For comparison, the GPS vertical displacement data underwent sign reversal processing (the same processing applies hereafter), meaning that an increase in rainfall corresponds to a downward movement of the GPS station’s vertical position (GPS U is negative), while a decrease in rainfall corresponds to an upward movement (GPS U is positive). From Figure 4, it can be seen that, regarding seasonal variations, GPS vertical displacements show a strong correlation with both rainfall and GRACE water storage changes, with correlation coefficients reaching -0.81 and -0.62, respectively. As the Southwest region is located in a monsoon area, rainfall, GPS vertical displacements, and GRACE-derived water storage all exhibit strong seasonal variations. However, in the winter and spring seasons with less rainfall, GPS vertical displacements can promptly reflect changes in rainfall, while in the rainy summer season, there is a one-month time delay (Figure 5). In contrast, GRACE shows a clear delayed response to changes in rainfall. The monthly average changes shown in Figure 5 indicate that GRACE exhibits an overall time delay of approximately two months with respect to rainfall changes, aligning with the cumulative changes in rainfall (the cumulative value of monthly average rainfall changes shown in the figure). The results indicate that GPS can effectively reflect immediate changes in rainfall, while GRACE primarily reflects the cumulative effects of rainfall changes. From a water balance perspective, the change in water storage equals the difference between input (rainfall) and output (runoff and evapotranspiration), and changes in water storage are also influenced by runoff and evapotranspiration, leading to time delays between GPS vertical displacements and GRACE water storage changes relative to rainfall. Additionally, due to the combined effects of crustal structure and hydrological patterns, GPS vertical displacements and GRACE water storage changes may exhibit delays of 2 to 4 months in certain regions.
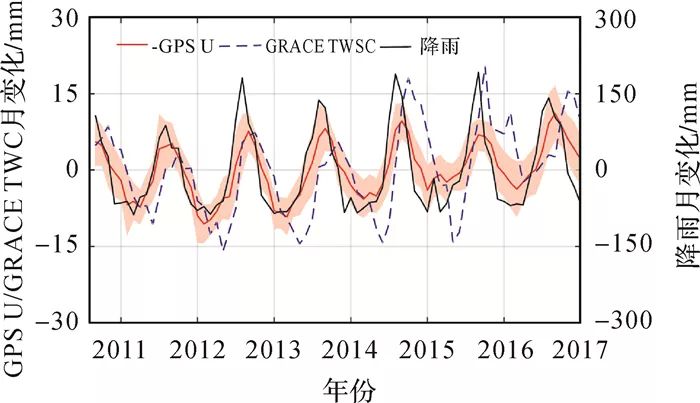 |
| Note: The red shaded area represents the standard deviation of the vertical displacement time series of 31 GPS stations.Fig. 4 Monthly variations in GPS vertical position, precipitation and GRACE TWSC |
 |
| Fig. 5 Monthly mean variations in precipitation, GPS vertical position and GRACE TWSC |
From the perspective of long-term trends, GPS vertical positions show an overall downward trend (-0.9 mm/a), which aligns with the increase in rainfall (4.6 mm/a) leading to an increase in hydrological loading (the trend of water storage changes observed by GRACE is 1.6 mm/a). However, the Sichuan-Yunnan region, located at the southeastern edge of the Tibetan Plateau, has complex crustal movement patterns, with both uplift and subsidence occurring simultaneously in Yunnan. The rate of GPS vertical displacement includes the effects of tectonic factors, and therefore, its consistency with water storage changes in terms of long-term trends requires further investigation.
To further analyze the hydrological effects reflected by GPS vertical displacements, a comparison was made with river water level changes. Figure 6 shows the average changes in vertical displacement of 17 GPS stations in the Jinsha River basin (station locations shown in Figure 1) alongside the river water level changes observed at two hydrometric stations. The Pingshan station is located at the outlet of the basin, and while its water level reflects the hydrological changes of the entire basin, its geographical position means it is more rapidly influenced by downstream hydrological changes. In contrast, the Gangtuo station reflects upstream hydrological changes and is more delayed in its response to downstream hydrological changes. Although water level change data is limited, the results shown in the figure are consistent with the previous analysis, indicating that GPS vertical displacements coincide with peak water level changes at the Pingshan station, while there is a one-month delay with the Gangtuo station water level changes.
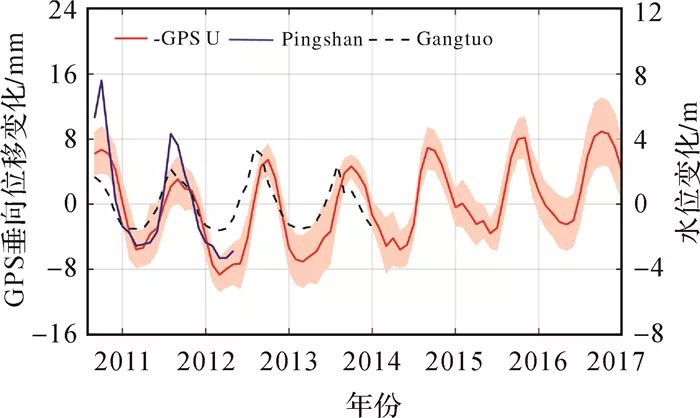 |
| Note: The red shaded area represents the standard deviation of the vertical displacement time series of 17 GPS stations.Fig. 6 Monthly water level variations at Pingshan and Gangtuo and GPS vertical position variations in the Jinsha River basin within the study area |
2.2 Analysis of Drought Monitoring Using GPS Vertical Displacement
The previous analysis shows that GPS vertical displacements can effectively reflect the seasonal changes of regional hydrological effects. This section compares GPS with three drought indices to verify its reliability in drought monitoring. Since drought reflects abnormal climatic changes, it is necessary to remove the seasonal variations from GPS vertical displacements and rainfall. Similar to the method used in literature [32], this study obtained non-seasonal changes by removing seasonal signals from the original signals of rainfall and GPS vertical displacements (Figure 4).
Figure 7(a) indicates that there was a significant decrease in rainfall in Southwest China prior to May 2013, particularly during the periods of April 2011 to May 2012 and October 2012 to March 2013, where negative rainfall anomalies lasted for 13 and 6 months, respectively, with maximum anomalies reaching -73 mm. This led to a reduction in hydrological loading, causing the vertical positions of GPS stations to rise significantly, with a maximum value of 5.2 mm; during the second period of rainfall deficit, the drought intensity indicated by different drought indices varied considerably. GRACE-DSI indicated no drought conditions (minimum value of -0.24), while CI and SPEI both indicated moderate drought conditions, with minimum values of -1.61 and -1.09, respectively, and the maximum vertical position rise of regional GPS stations was 4.3 mm. Clearly, GRACE-DSI failed to detect this drought event. During the third period of rainfall deficit, GRACE had a one-month data gap, and the GRACE-DSI values for the remaining two months were positive. CI indicated no drought conditions (minimum value of -0.07), while SPEI indicated mild drought conditions (minimum value of -0.87), and the maximum vertical position rise of GPS stations was 1.9 mm.
Table 3 Mean of drought indices and GPS vertical position anomalies during three periods of precipitation deficits
| Time Period | Rainfall/mm | GRACE-DSI | CI | SPEI | GPS U/mm |
| Phase 1 (2011-04—2012-05) | -16.8 | -0.39 | -0.82 | -0.53 | 2.51 |
| Phase 2 (2012-10—2013-03) | -12.0 | -0.08 | -0.94 | -0.78 | 2.57 |
| Phase 3 (2015-05—2015-07) | -32.1 | 0.24 | -0.05 | -0.66 | 0.45 |
To better compare the differences in drought intensity reflected by different indices, statistical analysis of GPS vertical displacements and drought indices during the three rainfall deficit phases was performed (Table 3). GRACE-DSI experienced data gaps of two months and one month during the second and third phases, respectively. As shown in Table 3, although the average loss of rainfall during the second phase was the smallest, both CI and SPEI had the lowest average values among the three phases, while the vertical positions of GPS stations exhibited the highest rise (2.57 mm), indicating that the Southwest region was most severely affected by drought during this period. This is primarily due to the close proximity of this phase to the first phase, coupled with a longer duration of loss (6 months), significantly affected by the cumulative effects of drought. Although the rainfall loss during the third phase was the most severe, the duration was shorter, and the subsequent significant positive anomalies in rainfall (Figure 7) effectively alleviated the impact of rainfall loss.
GRACE-DSI derives abnormal values of water storage changes by subtracting the corresponding multi-year averages for each month, but GRACE suffers from about 15% data loss. When certain months experience severe data loss throughout the entire period, the multi-year average may not accurately reflect the average level of water storage changes, thus failing to accurately capture abnormal situations of water storage changes. Additionally, GRACE’s time length is less than 17 years, while multi-year averages typically require 30 years of data to accurately reflect average changes, leading to an underestimation of drought severity in the Southwest region. Different drought events dominated by various factors may also exhibit discrepancies between GRACE-DSI and other drought indices. Furthermore, the relatively low spatial resolution of GRACE (approximately 300 km) may also contribute to its inability to detect drought events during the second and third phases.
The CI index treats the influences of daily rainfall within 30 days and 90 days on drought development as equal, meaning equal weighting during calculations. Therefore, compared to drought events caused by long-term rainfall losses, short-term rainfall deficits (such as the three-month period in the third phase) significantly influence the CI values due to prior rainfall, thus affecting its ability to detect short-term drought events. To address this, some scholars have proposed assigning different weights to rainfall amounts over different times and have made improvements to the CI index for specific regions. Additionally, the significant topographic variations in the Southwest region lead to considerable spatial distribution differences in rainfall, which may introduce certain limitations in analyzing the spatiotemporal distribution characteristics of drought indices.
Although SPEI can effectively detect rainfall deficits during the three phases (Table 3), it indicates that the most severe drought during the study period occurred in May 2014 (with a minimum value of -1.98), almost reaching extreme drought levels. This is inconsistent with rainfall, GPS vertical displacements, and other drought indices. As shown in Figure 7, compared to other drought indices, SPEI exhibits more pronounced fluctuations due to its sensitivity to the method of calculating potential evapotranspiration.
3 Conclusion
This study utilizes vertical displacement data from 31 GPS stations of the Crustal Movement Observation Network of China (CMONOC) from August 2010 to December 2016. By reducing the impact of random noise and excluding outlier data, the GPS vertical displacements reflecting hydrological effects were obtained after accounting for atmospheric loading effects, and used to analyze drought events in Southwest China, while discussing the differences between various drought indices. The research results indicate: ① The seasonal changes in GPS vertical displacements have a strong negative correlation with regional hydrological changes (rainfall, water storage, and river water level changes); ② The non-seasonal changes in GPS vertical displacements have a strong correlation with GRACE-DSI and CI drought indices (correlation coefficients of about -0.7). Compared to the CI drought index, GPS vertical displacements can better reflect the hydrological effects caused by sudden decreases in short-term rainfall. However, data loss affects the accuracy of GRACE-DSI in monitoring drought, while SPEI significantly overestimates the hydrological effects of certain rainfall deficits. The study results indicate that GPS vertical displacements can serve as an effective tool for drought research.
It should be noted that this study focuses on the Southwest region, which has a relatively dense distribution of CMONOC stations. The reliability of GPS monitoring drought in sparsely distributed areas requires further analysis, and research on using GPS to monitor drought events at smaller time scales (such as daily or weekly scales) would have greater practical value. Furthermore, the atmospheric water vapor content detected by GPS can provide more information for drought research. As the number of stations increases and observational data accumulates, along with the improvement of China’s BeiDou Satellite Navigation System, GNSS will effectively promote the application of spatial geodetic technology in hydrology research.
Acknowledgments: Thanks to the GNSS Data Product Service Platform of the China Earthquake Administration (http://www.cgps.ac.cn/) for providing data support.
[Citation Format] YAO Chaolong, LUO Zhicai, HU Yueming, et al. Monitoring drought events in Southwest China using GPS vertical displacements. The Journal of Surveying Science, 2019, 48(5): 547-554. DOI: 10.11947/j.AGCS.2019.20180308