Click the "Linux Tech Enthusiast" above and select "Set as Star" to receive high-quality articles promptly.

☞【Essentials】ChatGPT 4.0 is unlocked, no limit on questions!!!
☞【Essentials】Tsinghua University senior's self-study Linux notes, top-level quality!
☞【Essentials】Comprehensive guide to commonly used Linux commands, all in one article.
☞【Essentials】Collection! Linux basic to advanced learning roadmap.

Link: https://mp.weixin.qq.com/s/Rey0gSnnj-zoAEwE6J-Gjw
The performance of a Linux system refers to the effectiveness, stability, and response speed with which the operating system completes tasks. Linux system administrators may often encounter issues such as system instability and slow response times. For example, when setting up a web service on Linux, one might frequently experience web pages that fail to load or load slowly. When faced with these issues, some may complain about the Linux system’s performance, but these are merely surface phenomena.When an operating system completes a task, it is closely related to various factors, including system settings, network topology, routing devices, routing policies, access devices, and physical lines. Any problem in one of these areas can affect the overall system performance.Therefore, when issues arise in Linux applications, one should comprehensively investigate from the perspectives of the application, operating system, server hardware, and network environment to pinpoint where the problem lies and then focus on resolving it.With the rise of the container era and the disruption caused by AI technology, coupled with increasingly complex business and architecture requirements, and the need for enterprises to reduce costs and increase efficiency, higher demands for Linux’s performance and reliability have emerged. Thus, Linux performance optimization has become an essential core skill for operations personnel.For instance, when a host’s CPU usage triggers an alert, logging into Linux and running top may not provide clarity on whether the issue is due to insufficient CPU resources or application-related problems. These Linux performance issues have long troubled us, even experienced engineers with many years of work experience.
1. What are the common factors affecting Linux system performance?
@zhaoxiaoyong081 Ping An Technology Senior Engineer:
The performance of a Linux system is influenced by multiple factors. Here are some common factors affecting Linux system performance:
-
CPU Load: The utilization and load level of the CPU directly impact system performance. High CPU load may lead to slower process responses, increased latency, and system instability.
-
Memory Usage: Memory is a critical resource for system operation. When the system runs low on memory, it may lead to process termination, excessive swap usage, and decreased system performance.
-
Disk I/O: Disk I/O performance is a significant factor affecting system response time and throughput. High disk I/O load may result in increased latency, slower responses, and reduced system performance.
-
Network Load: Increased network traffic and latency can impact system performance. High network load may lead to increased network latency, slower responses, and resource contention.
-
Process Scheduling: The Linux system uses a process scheduler to manage and allocate CPU resources. The choice and configuration of scheduling algorithms can affect process priority and execution order, thereby impacting system responsiveness and load balancing.
-
File System Performance: The choice and configuration of the file system can affect disk I/O performance. Different file systems may vary in performance, and appropriate file system options and adjustments can improve system performance.
-
Kernel Parameters: The Linux kernel has many adjustable parameters that can affect system performance and behavior. For example, TCP/IP parameters, memory management parameters, and file system caching. Proper adjustment of kernel parameters can enhance system performance and resource utilization.
-
Resource Limits and Quotas: In a multi-user environment, resource limits and quotas can control the amount of resources each user or process can use. Proper resource management can prevent certain processes from exhausting system resources and causing performance issues.
These factors are interrelated and collectively impact system performance. To optimize Linux system performance, it is necessary to consider and appropriately adjust these factors to meet specific needs and usage scenarios.
2. Are there quick troubleshooting methods in work?
@zhaoxiaoyong081 Ping An Technology Senior Engineer:
1. CPU Performance Analysis
By using common tools such as top, vmstat, pidstat, strace, and perf to obtain CPU performance metrics, and then combining them with the principles of process and CPU operation, one can quickly identify the source of CPU performance bottlenecks.
For example, when you receive an alert for high user CPU usage, you can directly query the monitoring system to find the process causing the high CPU usage; then log into the Linux server where the process is located to analyze its behavior. You can use strace to view the summary of system calls made by the process; you can also use tools like perf to identify the hot functions of the process; or even use dynamic tracing methods to observe the current execution process of the process until the root of the bottleneck is determined.
2. Memory Performance Analysis
Memory bottlenecks can be confirmed using performance metrics output by free and vmstat; then, based on the type of memory issue, further analyze memory usage, allocation, leaks, and caching to identify the source of the problem.
For example, when you receive an alert for insufficient memory, you can first find the processes consuming the most memory from the monitoring system. Then, based on the historical memory usage of these processes, observe if there are any memory leak issues. After identifying the most suspicious process, log into the Linux server where the process is located to analyze its memory space or memory allocation, ultimately clarifying why the process consumes a large amount of memory.
3. Disk and File System I/O Performance Analysis
When you use iostat and find a performance bottleneck in disk I/O (such as high I/O utilization, long response times, or sudden increases in wait queue length), you can further confirm the source of I/O using pidstat, vmstat, etc. Then, based on the source, further analyze the usage rates of the file system and disk, caching, and process I/O to pinpoint the true culprit of the I/O issue.
For example, when you find that the I/O utilization of a certain disk is 100%, you can first find the process with the most I/O from the monitoring system. Then, log into the Linux server where the process is located and use tools like strace, lsof, and perf to analyze the I/O behavior of that process. Finally, combine the principles of the application to identify the reasons for the high I/O.
4. Network Performance Analysis
To analyze network performance, one should start from several protocol layers, observing performance metrics such as utilization, saturation, and error counts to check for performance issues. For example:
At the link layer, analyze network interface throughput, packet loss, errors, and soft interrupts, as well as network function offloading;
At the network layer, analyze routing, fragmentation, and overlay networks;
At the transport layer, analyze TCP and UDP protocol principles from the perspectives of connection counts, throughput, latency, and retransmissions;
For example, when you receive an alert for network connectivity issues, you can check the packet loss metrics at each protocol layer from the monitoring system to confirm which protocol layer is experiencing packet loss. Then, confirm from the monitoring system data whether there are performance bottlenecks in network bandwidth, buffer sizes, connection tracking counts, etc. Finally, log into the Linux server where the issue occurred and use tools like netstat, tcpdump, and bcc to analyze the incoming and outgoing network data, combining the kernel’s network options and TCP protocol principles to identify the source of the problem.
3. How to troubleshoot high system load in Linux OS?
@zhaoxiaoyong081 Ping An Technology Senior Engineer:
To troubleshoot the causes and bottlenecks of high system load in a Linux environment, the following steps can be taken:
-
Use the top or htop command to observe the overall system load. Check the load average values, which represent the average load on the system over 1 minute, 5 minutes, and 15 minutes. If the load values exceed 70-80% of the number of CPU cores, it indicates that the system load is too high.
-
Use the top or htop command to check CPU usage. Observe which processes are consuming a large amount of CPU resources. If a particular process consistently has high CPU usage, it may be one of the causes of the high load.
-
Use the free command to check the system’s memory usage. Observe the amount of memory used and remaining. If the memory usage approaches or exceeds the physical memory capacity, it may cause the system to start using swap space, thereby affecting system performance.
-
Use the iotop command to check disk I/O usage. Observe the disk read/write rates and utilization. If the disk I/O load is too high, it may lead to slower system responses.
-
Use the netstat command or similar tools to check network connection status. Observe if there are a large number of network connections or network traffic. If there are too many network connections or excessive network traffic, it may affect system performance.
-
Check log files. Review system log files (such as /var/log/messages, /var/log/syslog) and application logs for any anomalies or error messages that may help identify the cause of the high load.
-
Use tools like perf or strace for process-level performance analysis. These tools can help track system calls, function calls, and performance bottlenecks of processes, further identifying the specific causes of high load.
-
Check system configuration and parameter settings. Review relevant configuration files (such as /etc/sysctl.conf, /etc/security/limits.conf) and parameter settings to ensure that the system’s settings match actual needs and make appropriate adjustments.
By following the above steps, you can help identify the causes and bottlenecks of high system load and take corresponding measures to optimize system performance. Search for the public account: Architect’s Guide, reply: Architect to receive materials.
4. How to find the top 5 processes consuming load in Linux and identify the main bottleneck resource (CPU, memory, or disk I/O)?
@zhaoxiaoyong081 Ping An Technology Senior Engineer:
CPU Usage Ranking
ps aux –sort=-%cpu | head -n 5
Memory Usage Ranking
ps aux –sort=-%mem | head -n 6
I/O Usage Ranking
iotop -oP
@zwz99999 dcits System Engineer:
View the top 10 processes consuming CPU
#ps aux|grep -v USER|sort +2|tail -n 10
View the top 10 processes consuming memory
#ps aux|grep -v USER|sort +3|tail -n 10
I/O
iostat 1 10 to see which disk is busy.
5. How to resolve inaccurate memory calculations in Linux?
@Acdante HZTYYJTechnical Director:
The free command provides instantaneous counts of execution time, while /proc/memory reflects real-time changes.
Moreover, the free command includes memory used for caching and buffering, which can lead to a significant reduction in the available memory seen.
For accurate values, it is recommended to combine various monitoring metrics and command methods to continuously observe memory conditions.
For example: htop, nmon, syssta, top, etc., can be combined with operation and maintenance software and platforms, rather than relying on a single point in time. It is best to have a certain amount of performance data accumulation over time to analyze from the overall trend and specific problem points. Memory is just a resource metric; the calls that use memory are the root of the problem.
@zhaoxiaoyong081 Ping An Technology Senior Engineer:
In some cases, there may be significant discrepancies between the cumulative memory usage values seen through the ps or top commands and the memory statistics in the free command or /proc/meminfo. This can be caused by the following reasons:
-
Cache and Buffers: The Linux system uses cache and buffers to improve file system performance. The memory occupied by these caches and buffers is marked as “cached” and “buffers” types. However, this memory is not necessarily the memory actually used by processes but is reserved by the kernel to enhance I/O performance. Therefore, the cumulative memory usage values displayed by ps or top commands may include these caches and buffers, while the statistics in free command or /proc/meminfo typically do not.
-
Shared Memory: Shared memory is a special memory area that multiple processes can access and share. The cumulative memory usage values displayed by ps or top commands may include the size of shared memory, while the statistics in free command or /proc/meminfo usually do not account for it.
-
Memory Reclamation: The Linux system has a memory reclamation mechanism that can reclaim unused memory when needed. This means that some memory released by processes may not immediately reflect in the cumulative memory usage values displayed by ps or top commands. In contrast, the statistics in free command or /proc/meminfo typically reflect actual memory usage more promptly.
In summary, the differences between the cumulative memory usage values displayed by ps or top commands and the memory statistics in free command or /proc/meminfo are usually caused by factors such as caches and buffers, shared memory, and memory reclamation. If you need a more accurate understanding of the actual memory used by processes, it is recommended to refer to the statistics in free command or /proc/meminfo and combine other tools and methods for comprehensive analysis.
@wenwen123 Project Manager:
In Linux, there may be inaccuracies in memory calculations, leading to significant discrepancies between the cumulative memory usage values in ps and top commands and the memory statistics in free command or /proc/meminfo. This discrepancy may be caused by the following reasons:
-
Shared Memory: Shared memory is a memory area shared between multiple processes for inter-process communication. Shared memory is not counted in memory usage by tools like ps and top, as they only account for private memory usage of processes. Therefore, if a process uses a large amount of shared memory, its memory usage displayed in these tools may appear low.
-
Cache and Buffers: The Linux system allocates a portion of memory for cache and buffers to enhance file system and I/O operation performance. The memory used for these caches and buffers is considered reclaimable in tools like ps and top, so they are typically not included in the memory usage of processes. However, in the free command or /proc/meminfo, this memory for caches and buffers is included in the statistics.
-
Memory Reclamation Mechanism: The Linux kernel has a memory reclamation mechanism that automatically reclaims and allocates memory as needed. This may lead to discrepancies between the memory usage displayed by tools like ps and top and the statistics in free command or /proc/meminfo. This discrepancy is usually normal, and Linux dynamically manages memory to meet system demands.
Regarding the issue of inaccurate memory calculations, paying attention to shared memory is reasonable. The use of shared memory may impact the memory usage of processes but will not be counted in the memory usage by tools like ps and top. If you need a more accurate understanding of process memory usage, you can use specialized tools like pmap, smem, etc., which can provide more detailed and accurate memory statistics.
It is important to note that the accuracy of memory calculations in Linux also depends on factors such as kernel version, system configuration, and the tools used. When troubleshooting memory calculation inaccuracies, it is advisable to use multiple tools for comparison and analyze and judge based on specific scenarios and needs.
6.What are the current application scenarios for Swap?
@zhaoxiaoyong081 Ping An Technology Senior Engineer:
Although modern computers have increasingly larger memory capacities, swap partitions still play an important role in certain scenarios. Here are some common scenarios for using swap partitions:
-
Insufficient Memory: Swap partitions serve as a backup mechanism when memory is insufficient, transferring infrequently used or temporarily unnecessary memory pages to disk. When physical memory (RAM) is insufficient to accommodate all active processes and data, swap partitions can provide additional virtual memory space to avoid out-of-memory errors.
-
Hibernation/Sleep Mode: Swap partitions are used in some operating systems to support hibernation or sleep modes. When a computer enters hibernation or sleep state, the system’s memory state is saved to the swap partition to restore to the previous state upon waking.
-
Virtualization Environment: In a virtualization environment, swap partitions can be used for memory management of virtual machines. When the host’s physical memory is insufficient, the memory pages of virtual machines can be swapped to the host’s swap partition to provide additional memory space.
-
Memory Reclamation and Page Replacement: Swap partitions can be used for memory reclamation and page replacement algorithms. When the operating system needs to free physical memory to meet more urgent demands, it can swap inactive memory pages to the swap partition to allocate physical memory to more important tasks or processes.
Although swap partitions play a role in the above scenarios, it is important to note that over-reliance on swap partitions may lead to performance degradation. Frequent swapping operations can increase I/O load and cause response time delays. Therefore, in modern systems, it is generally recommended to configure physical memory reasonably to minimize reliance on swap partitions and maintain sufficient memory availability.
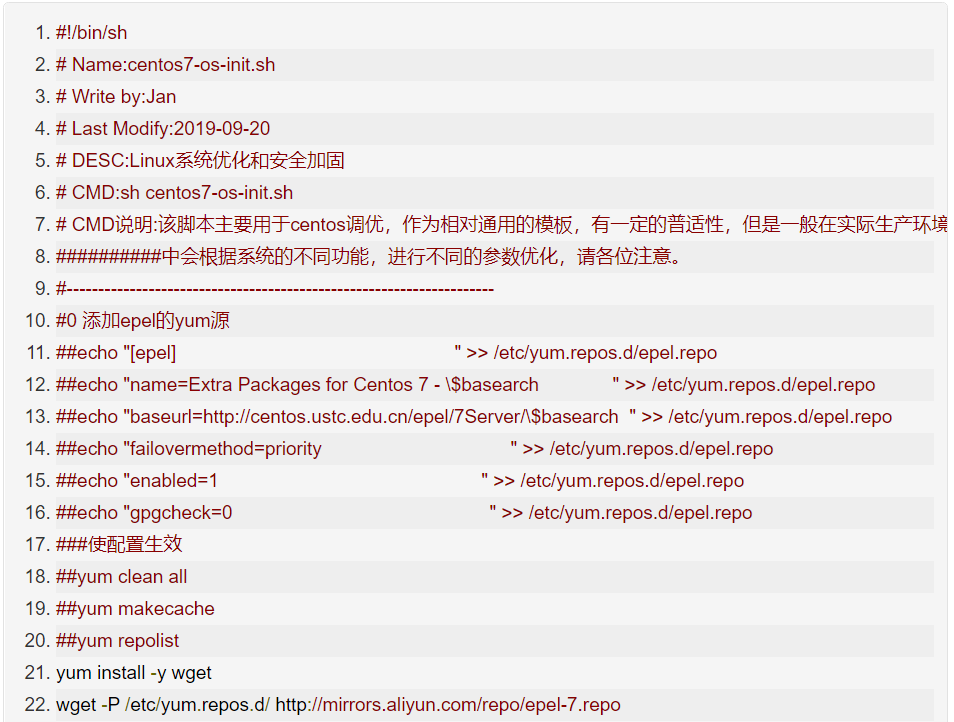
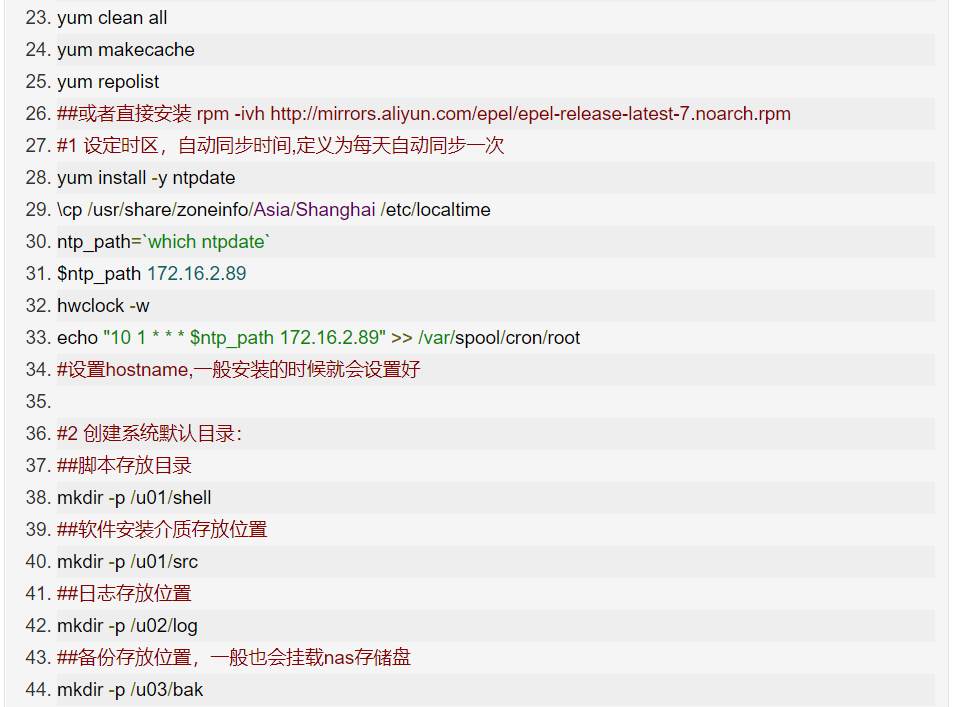
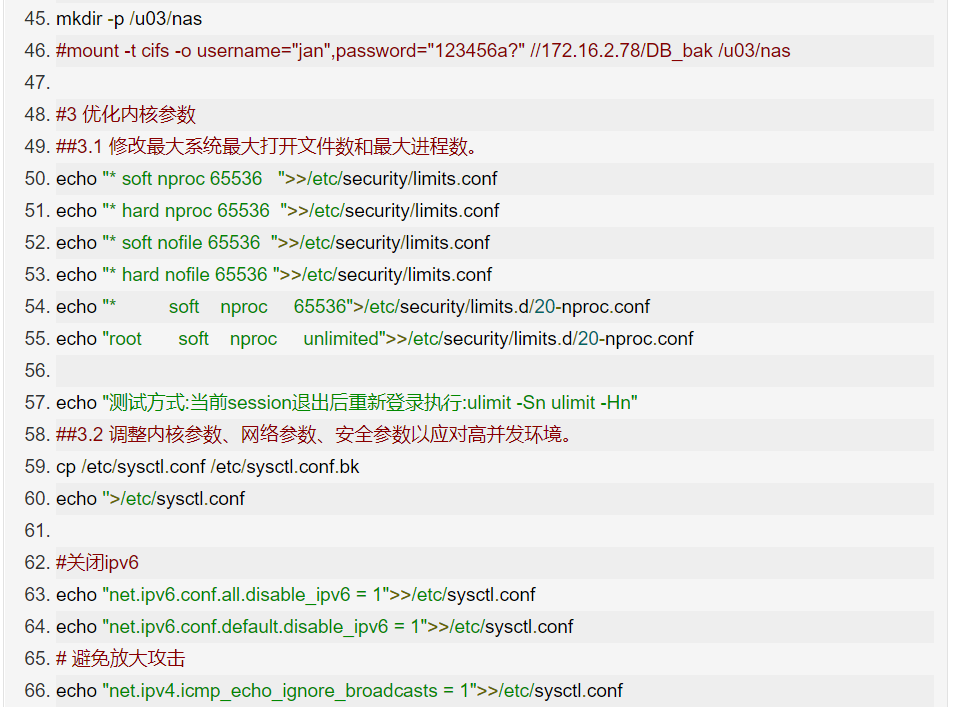
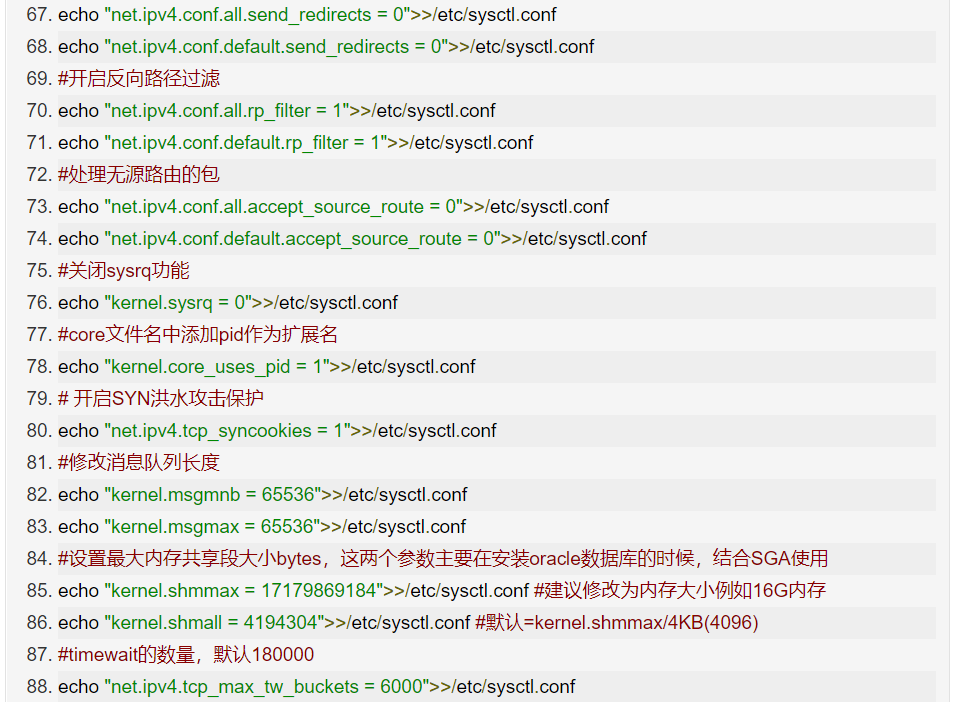
7. What tuning experiences or cases are there for TCP in Linux?
@zhanxuechao Digital Research Institute Consulting Expert:
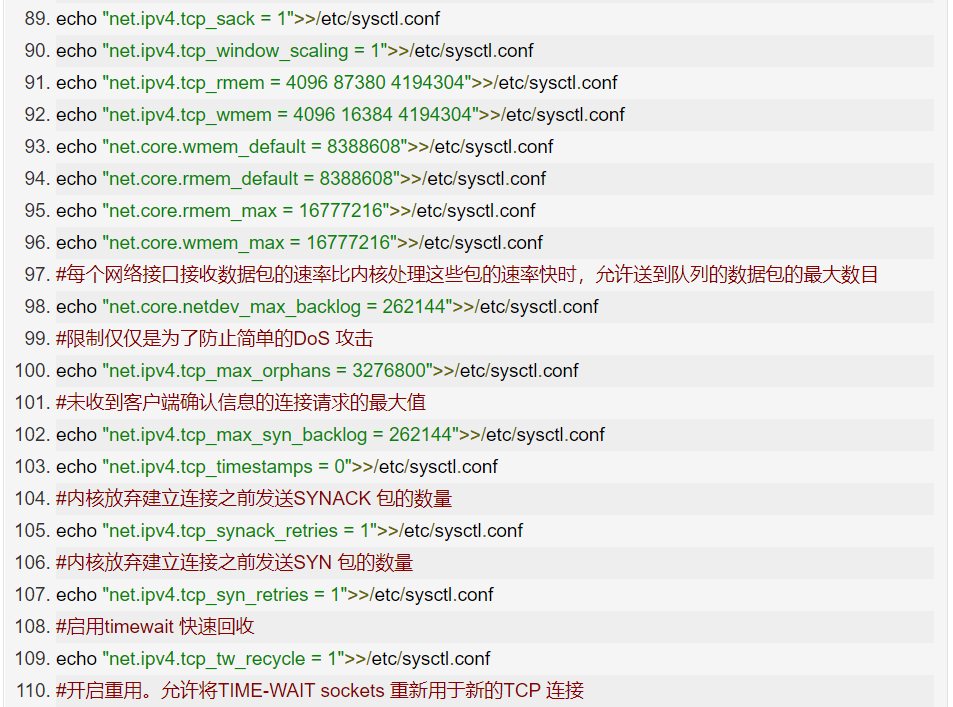
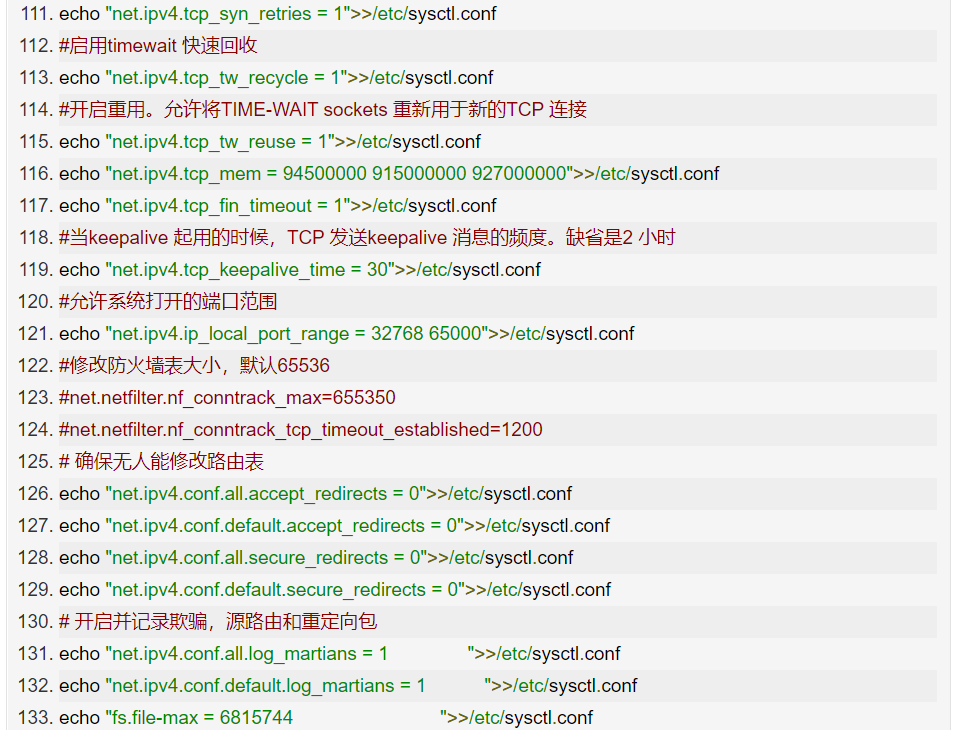
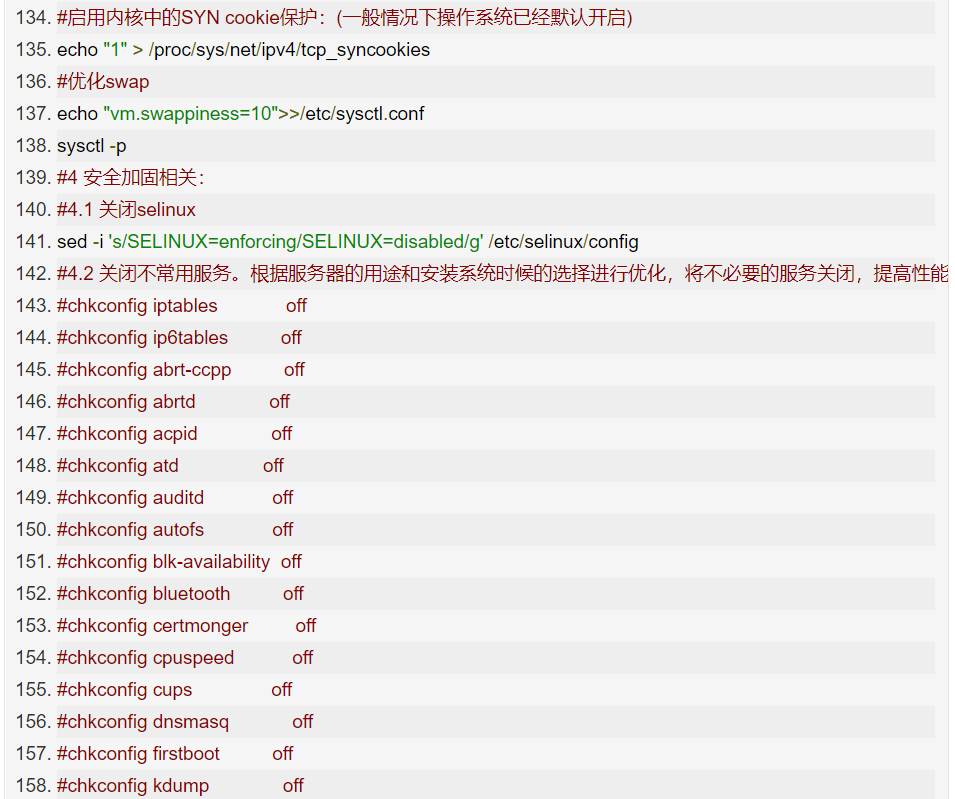
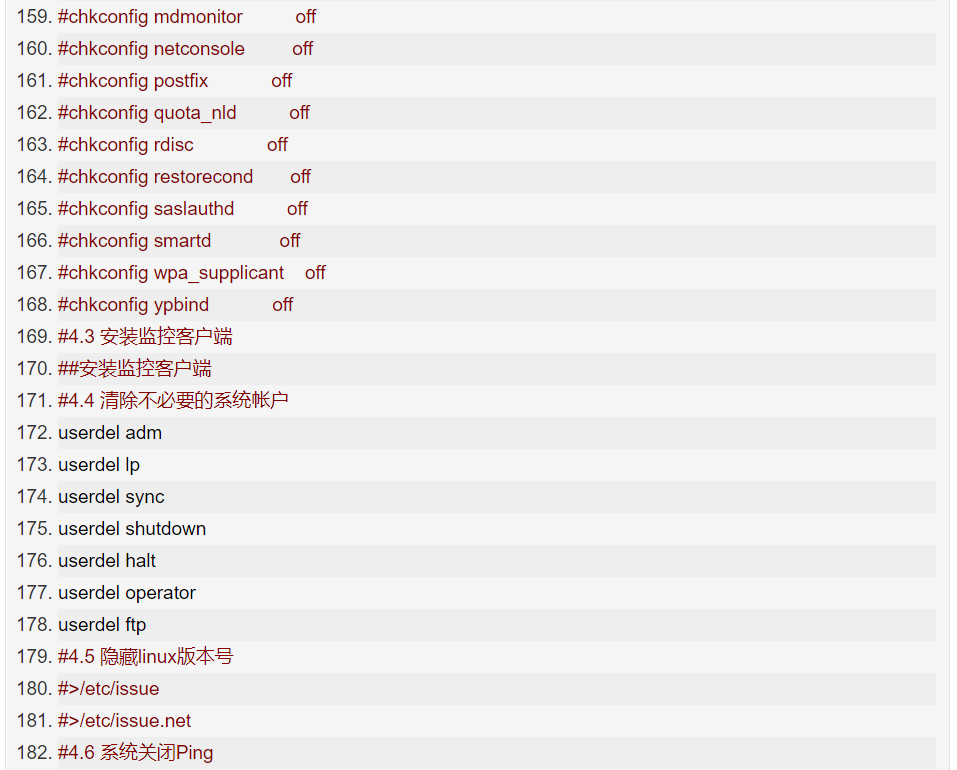
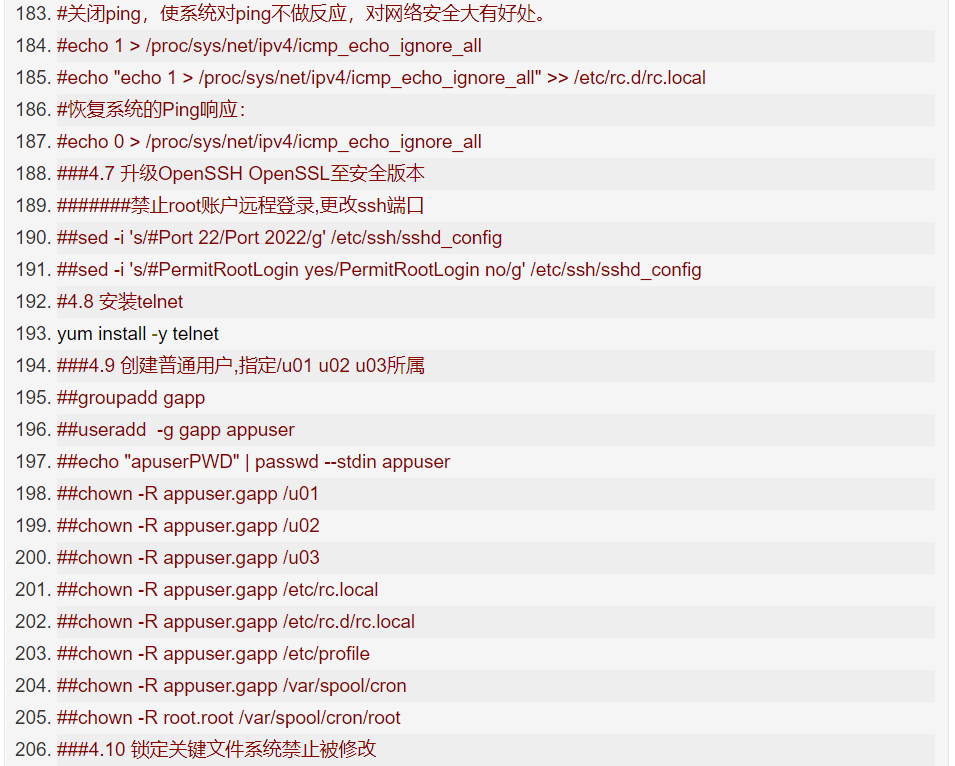
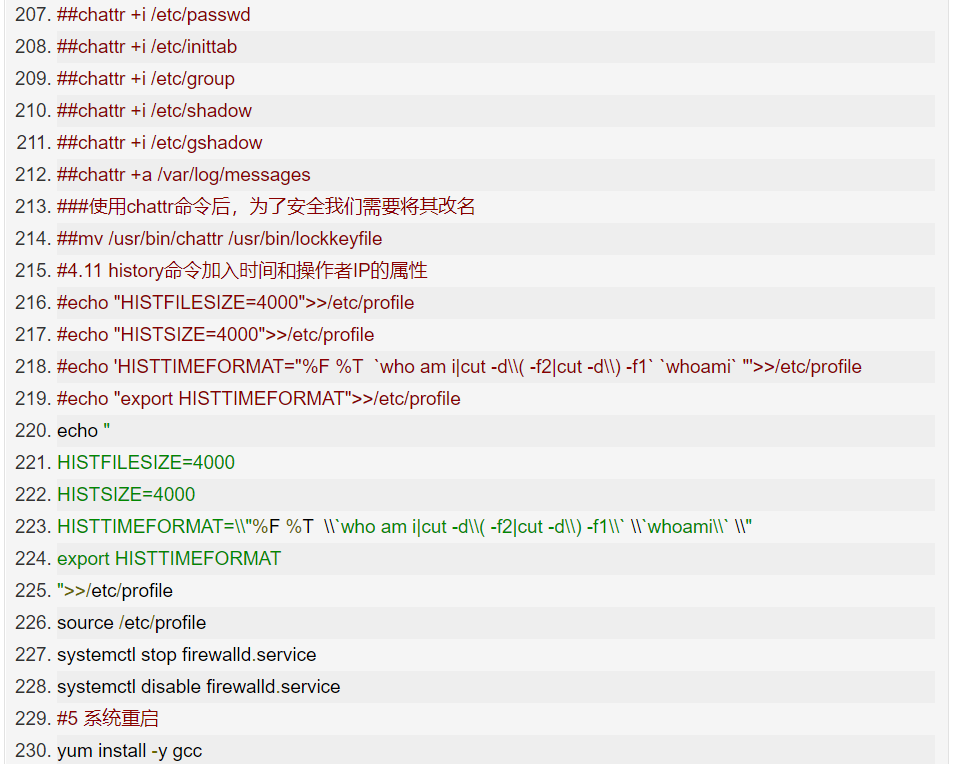
centos7-os-init.sh

@zhaoxiaoyong081 Ping An Technology Senior Engineer:
TCP optimization can be detailed in three categories:
First, in scenarios with a large number of requests, you may see many connections in the TIME_WAIT state, which occupy a lot of memory and port resources. In this case, we can optimize kernel options related to the TIME_WAIT state, such as:
Increase the number of connections in the TIME_WAIT state net.ipv4.tcp_max_tw_buckets, and increase the size of the connection tracking table net.netfilter.nf_conntrack_max.
Reduce net.ipv4.tcp_fin_timeout and net.netfilter.nf_conntrack_tcp_timeout_time_wait to allow the system to release the resources they occupy as quickly as possible.
Enable port reuse net.ipv4.tcp_tw_reuse. This way, ports occupied by TIME_WAIT state can still be used for new connections.
Increase the range of local ports net.ipv4.ip_local_port_range. This allows for more connections and improves overall concurrency.
Increase the maximum number of file descriptors. You can use fs.nr_open and fs.file-max to increase the maximum number of file descriptors for processes and the system, respectively; or configure LimitNOFILE in the application’s systemd configuration file to set the maximum number of file descriptors for the application.
Second, to mitigate performance issues caused by SYN FLOOD attacks that exploit TCP protocol characteristics, you can consider optimizing kernel options related to SYN state, such as:
Increase the maximum number of half-open connections net.ipv4.tcp_max_syn_backlog, or enable TCP SYN Cookies net.ipv4.tcp_syncookies to bypass the half-open connection limit (note that these two options cannot be used simultaneously).
Reduce the number of retransmissions of SYN+ACK packets in SYN_RECV state net.ipv4.tcp_synack_retries.
Third, in long connection scenarios, Keepalive is usually used to detect the status of TCP connections so that the system can automatically reclaim connections after the peer disconnects. However, the default Keepalive probe interval and retry counts generally do not meet application performance requirements. Therefore, you need to optimize kernel options related to Keepalive, such as:
Shorten the interval from the last data packet to the Keepalive probe packet net.ipv4.tcp_keepalive_time;
Shorten the interval for sending Keepalive probe packets net.ipv4.tcp_keepalive_intvl;
Reduce the number of retries before notifying the application after a Keepalive probe failure net.ipv4.tcp_keepalive_probes.
Summary
Optimizing Linux performance in enterprises has never been an easy task. For operations engineers, it is an unavoidable challenge, and it is one of the most fundamental yet difficult parts of the operations knowledge system. To learn performance analysis and optimization well, one needs to establish a global view of overall system performance, understand the principles of CPU, memory, disk, and network, master which monitoring metrics to collect, and be proficient in using various tools to analyze, trace, and locate problems.
-End-

If you have read this far, it indicates that you enjoy the articles from this public account. Feel free to pin (star) this public account, Linux Tech Enthusiast, so you can receive notifications promptly!

In this public account, Linux Tech Enthusiast, reply: Linux to receive 2TB of learning materials!
Recommended Reading
1. ChatGPT Chinese Version 4.0, available for everyone, fast and stable!
2. Common Linux commands, a comprehensive summary of 20,000 words.
3. Linux Learning Guide (Collection Edition)
4. Access official ChatGPT, Claude, and Midjourney without translation, stable with after-sales support.