1. Background
1. Storytelling
Previously, I shared an article about <span>unmanaged memory leaks caused by C# calling C code</span>. This was a deliberately induced positive leak. In this article, we will explore the root cause of the leak from a reverse perspective. This issue is relatively easy to handle on Windows, as many people know to enable a User-Mode Stack Trace (UST) to let the operating system intervene. However, it is more complex on Linux, as the Linux system is a place where everything thrives, and there is no single authority overseeing the entire system, which is a significant drawback in the debugging field.
2. Case Analysis
1. A Small Example
Here, I will use the previous example, with the corresponding C code and C# code as follows:
- C Code
#include <stdlib.h>
#include <stdio.h>
#include <stdint.h>
#include <string.h>

#define BLOCK_SIZE (10 * 1024)              // Each block is 10K
#define TOTAL_SIZE (1 * 1024 * 1024 * 1024) // Total 1GB
#define BLOCKS (TOTAL_SIZE / BLOCK_SIZE)    // Calculate the number of blocks needed

void heapmalloc()
{
    uint8_t *blocks[BLOCKS]; // Store pointers to each block

    // Allocate 1GB of memory, divided into multiple small blocks
    for (size_t i = 0; i < BLOCKS; i++)
    {
        blocks[i] = (uint8_t *)malloc(BLOCK_SIZE);
        if (blocks[i] == NULL)
        {
            printf("Memory allocation failed!\n");
            return;
        }

        // Ensure each block is actually occupied
        memset(blocks[i], 20, BLOCK_SIZE);
    }

    printf("1GB of memory has been allocated on the heap!\n");
}
- C# Code
using System.Runtime.InteropServices;

namespace CSharpApplication;

class Program
{
    [DllImport("libmyleak.so", CallingConvention = CallingConvention.Cdecl)]
    public static extern void heapmalloc();

    static void Main(string[] args)
    {
        heapmalloc();
        Console.ReadLine();
    }
}
2. Heaptrack Tracing
Heaptrack is a tool for tracking C/C++ heap allocations. It intercepts all calls to malloc, calloc, realloc, and free functions, recording the call stack information for allocations. Overall, this tool has nothing to do with C#, but it is mainly valued for the following three points:
- It can record the call stack information for allocations, although only for the unmanaged part.
- It has a relatively small impact on the program.
- It provides a visual tool to observe the trace files.
Install <span>heaptrack</span> and <span>heaptrack-gui</span> as follows:
root@ubuntu2404:/data# sudo apt install heaptrack
Reading package lists... Done
Building dependency tree... Done
Reading state information... Done
heaptrack is already the newest version (1.5.0+dfsg1-2ubuntu3).
0 upgraded, 0 newly installed, 0 to remove and 217 not upgraded.

root@ubuntu2404:/data/CSharpApplication/bin/Debug/net8.0# sudo apt install heaptrack-gui
Reading package lists... Done
Building dependency tree... Done
Reading state information... Done
heaptrack-gui is already the newest version (1.5.0+dfsg1-2ubuntu3).
0 upgraded, 0 newly installed, 0 to remove and 217 not upgraded.
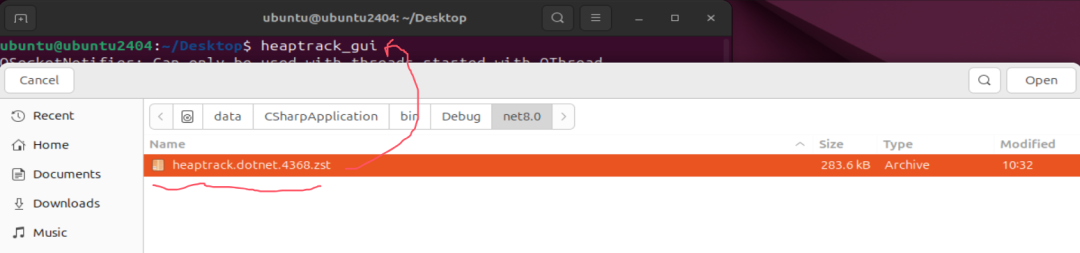
After installation, you can use <span>heaptrack dotnet CSharpApplication.dll</span> to trace the dotnet program. Once a leak occurs to a certain extent, you can use dotnet-dump to generate a dump file, then interrupt with Ctrl+C.
root@ubuntu2404:/data/CSharpApplication/bin/Debug/net8.0# heaptrack dotnet CSharpApplication.dll
heaptrack output will be written to "/data/CSharpApplication/bin/Debug/net8.0/heaptrack.dotnet.4368.zst"
starting application, this might take some time...
NOTE: heaptrack detected DEBUGINFOD_URLS but will disable it to prevent unintended network delays during recording
If you really want to use DEBUGINFOD, export HEAPTRACK_ENABLE_DEBUGINFOD=1
1GB of memory has been allocated on the heap!
[createdump] Gathering state for process 4383 dotnet
[createdump] Writing full dump to file /data/CSharpApplication/bin/Debug/net8.0/core_20250307_102814
[createdump] Written 1252216832 bytes (305717 pages) to core file
[createdump] Target process is alive
[createdump] Dump successfully written in 23681ms

root@ubuntu2404:/data/CSharpApplication/bin/Debug/net8.0# heaptrack stats:
 allocations:           122151
 leaked allocations:    108551
 temporary allocations: 4118

root@ubuntu2404:/data/CSharpApplication/bin/Debug/net8.0# ls -lh
total 1.2G
-rwxr-xr-x 1 root root  74K Mar  5 22:38 CSharpApplication
-rw-r--r-- 1 root root  421 Mar  5 21:52 CSharpApplication.deps.json
-rw-r--r-- 1 root root 4.5K Mar  5 22:38 CSharpApplication.dll
-rw-r--r-- 1 root root  11K Mar  5 22:38 CSharpApplication.pdb
-rw-r--r-- 1 root root  257 Mar  5 21:52 CSharpApplication.runtimeconfig.json
-rw------- 1 root root 1.2G Mar  7 10:28 core_20250307_102814
-rw-r--r-- 1 root root 277K Mar  7 10:32 heaptrack.dotnet.4368.zst
-rwxr-xr-x 1 root root  16K Mar  5 21:52 libmyleak.so
A file named <span>heaptrack.dotnet.4368.zst</span> has been generated, which is a proprietary compressed format. It can be converted to a txt file using <span>heaptrack_print</span> for easier analysis.
root@ubuntu2404:/data/CSharpApplication/bin/Debug/net8.0# heaptrack_print heaptrack.dotnet.4368.zst > heaptrack.txt
In real scenarios, visually observing <span>heaptrack.txt</span> is not very practical, so we need to use a visualization tool to observe the <span>Bottom-Up</span> option, with the following information:
- Left Panel
It can be observed that the most leaked memory is from the heapmalloc function in libmyleak.so.
- Right Panel
It can be observed that the upper-level functions executing the heapmalloc method are shown in the screenshots below.
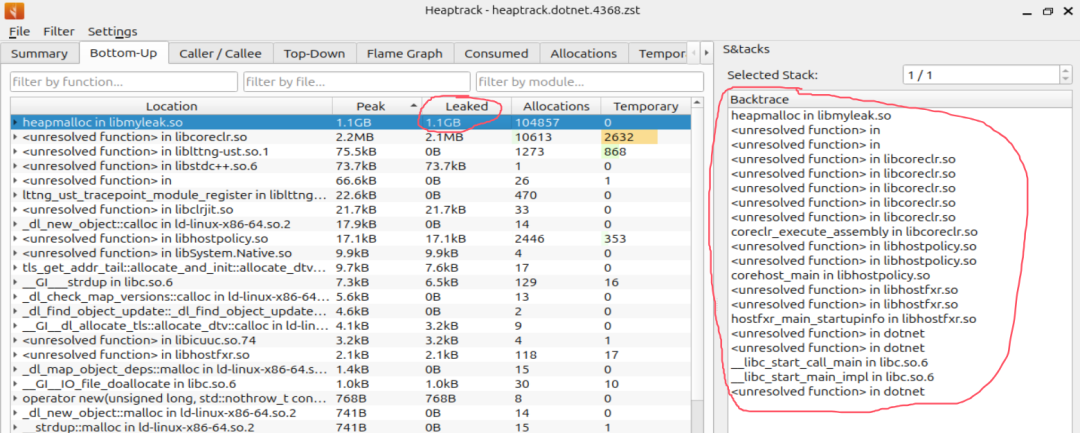
Upon closer inspection, many unresolved symbols can be found in the Backtrace. This is unavoidable, as it is a C/C++ tracker and has nothing to do with C#. So what functions do these unresolved symbols correspond to?
3. Where Are the Unresolved Symbol Addresses?
Since this is a C# program, it is likely that these are C# methods. How can we find the method names? Friends familiar with advanced .NET debugging should find this straightforward. The approach is as follows:
- Find the instruction address.
Generally, if it cannot be resolved, it will generate the corresponding <span>instruction address</span>. This can be found in <span>heaptrack.txt</span>, as shown in the screenshot below:
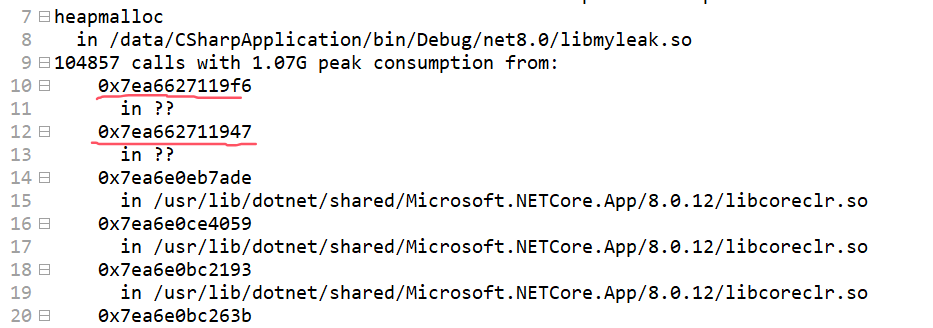
- Capture the core file
To capture the .NET core file, use dotnet-dump, which will not be introduced here. Refer to the following:
root@ubuntu2404:/data/CSharpApplication/bin/Debug/net8.0# ps -ef | grep CSharp
root        4368    2914  0 10:25 pts/0    00:00:00 /bin/sh /usr/bin/heaptrack dotnet CSharpApplication.dll
root        4383    4368  2 10:25 pts/0    00:00:03 dotnet CSharpApplication.dll
root        4421    4336  0 10:28 pts/3    00:00:00 grep --color=auto CSharp
root@ubuntu2404:/data/CSharpApplication/bin/Debug/net8.0# dotnet-dump collect -p 4383
Writing full to /data/CSharpApplication/bin/Debug/net8.0/core_20250307_102814
Complete
root@ubuntu2404:/data/CSharpApplication/bin/Debug/net8.0# ls -lh
total 1.2G
-rwxr-xr-x 1 root root  74K Mar  5 22:38 CSharpApplication
-rw-r--r-- 1 root root  421 Mar  5 21:52 CSharpApplication.deps.json
-rw-r--r-- 1 root root 4.5K Mar  5 22:38 CSharpApplication.dll
-rw-r--r-- 1 root root  11K Mar  5 22:38 CSharpApplication.pdb
-rw-r--r-- 1 root root  257 Mar  5 21:52 CSharpApplication.runtimeconfig.json
-rw------- 1 root root 1.2G Mar  7 10:28 core_20250307_102814
-rw-r--r-- 1 root root    0 Mar  7 10:25 heaptrack.dotnet.4368.zst
-rwxr-xr-x 1 root root  16K Mar  5 21:52 libmyleak.so
Once the core_20250307_102814 file is generated, you can use the sos command’s ip2md to find the C# method name corresponding to this instruction address.
root@ubuntu2404:/data/CSharpApplication/bin/Debug/net8.0# dotnet-dump analyze core_20250307_102814
Loading core dump: core_20250307_102814 ...
Ready to process analysis commands. Type 'help' to list available commands or 'help [command]' to get detailed help on a command.
Type 'quit' or 'exit' to exit the session.
> ip2md 0x7ea6627119f6
MethodDesc:   00007ea6627cd3d8
Method Name:          ILStubClass.IL_STUB_PInvoke()
Class:                00007ea6627cd300
MethodTable:          00007ea6627cd368
mdToken:              0000000006000000
Module:               00007ea66279cec8
IsJitted:             yes
Current CodeAddr:     00007ea662711970
Version History:
  ILCodeVersion:      0000000000000000
  ReJIT ID:           0
  IL Addr:            0000000000000000
     CodeAddr:           00007ea662711970  (MinOptJitted)
     NativeCodeVersion:  0000000000000000
> ip2md 0x7ea662711947
MethodDesc:   00007ea66279f328
Method Name:          CSharpApplication.Program.Main(System.String[])
Class:                00007ea6627bb640
MethodTable:          00007ea66279f358
mdToken:              0000000006000002
Module:               00007ea66279cec8
IsJitted:             yes
Current CodeAddr:     00007ea662711920
Version History:
  ILCodeVersion:      0000000000000000
  ReJIT ID:           0
  IL Addr:            0000000000000000
     CodeAddr:           00007ea662711920  (MinOptJitted)
Source file:  /data/CSharpApplication/Program.cs @ 12
At this point, it becomes clear that the call path is: <span>CSharpApplication.Program.Main -> PInvoke -> heapmalloc</span>. Thus, the truth is revealed.
3. Conclusion
Debugging on Linux always feels like there is a lack of a central overseer. Tools that can analyze <span>unmanaged memory</span> do not care about .NET, and similarly, tools that can analyze <span>managed memory in .NET</span> do not care about unmanaged memory. Each operates independently… This is quite astonishing for users accustomed to using a universal tool like WinDbg.