Follow+Star Public Number, don’t miss wonderful content
WeChat Public Account | Embedded Column
Although Keil is often criticized, especially for its interface that feels like it’s from the last century (actually, IAR is similar), but its debugging features should be above reproach, especially for debugging Cortex-M core microcontrollers.
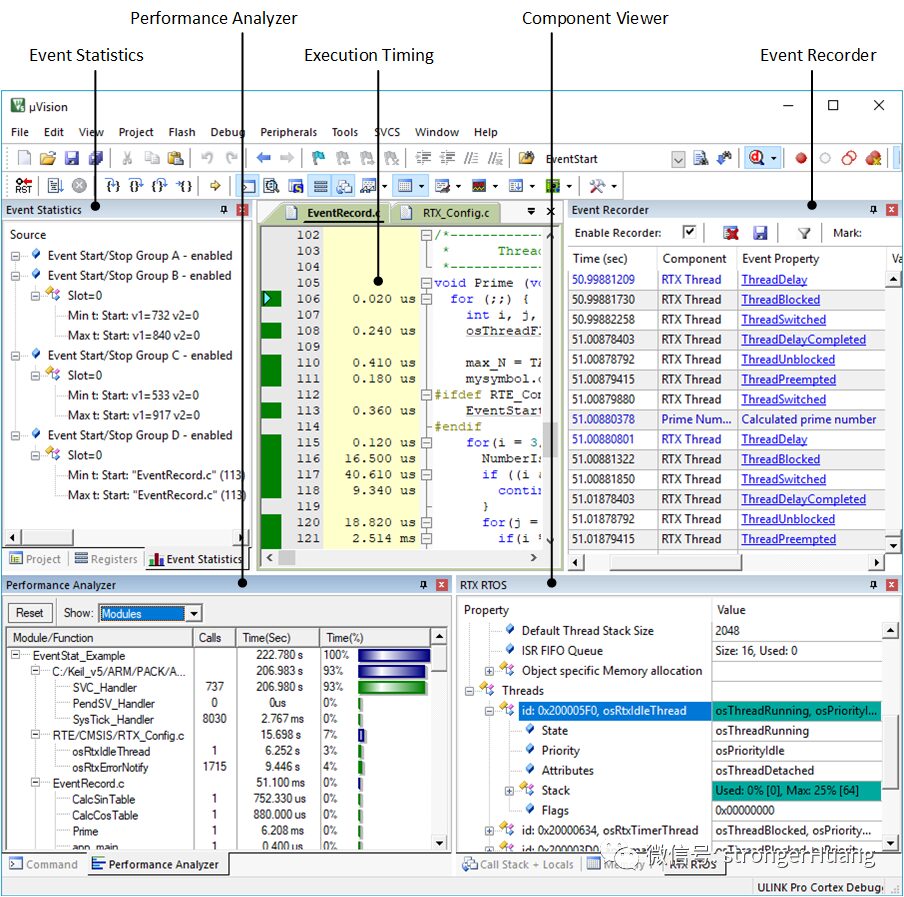
Keil MDK supports a wide range of debugging features: component viewer, event recorder, event statistics, data and event tracing, instruction tracing, etc.
Many users report encountering various issues while debugging with Keil MDK, so let’s briefly discuss some software and hardware requirements during Keil MDK debugging.
It requires the target hardware to support SWO or ETM tracing.
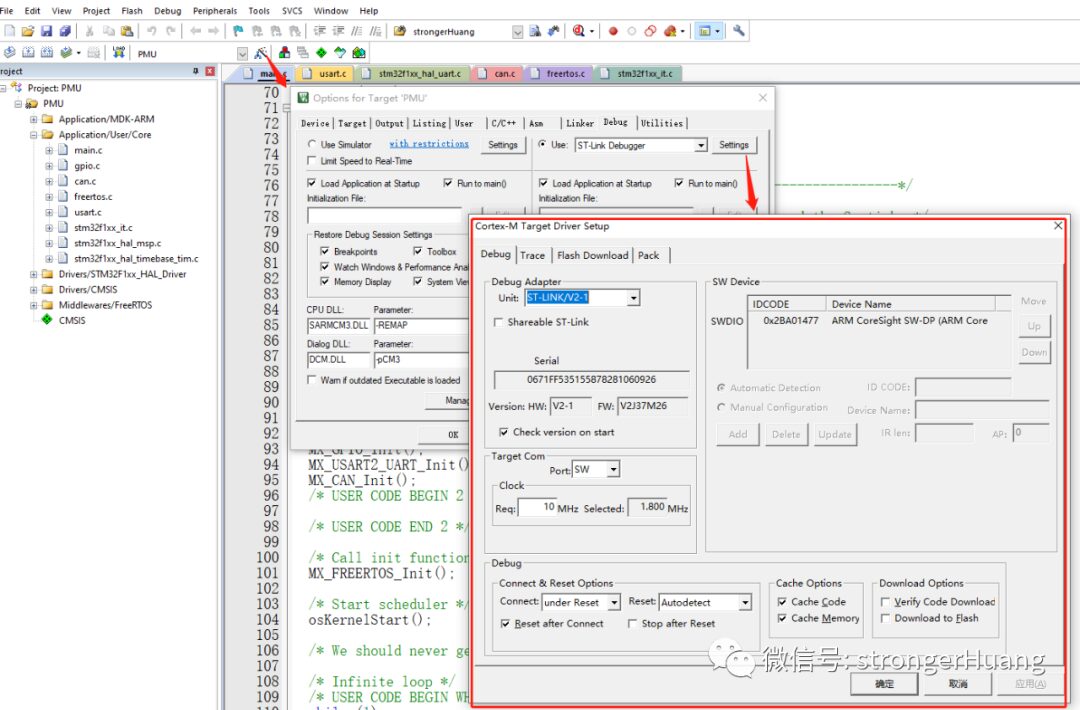
SWO tracing or ETM tracing needs to be correctly configured in the µVision debugging settings:
It requires the target hardware to support ETM tracing. ETM tracing needs to be correctly configured in the Keil debugging settings.
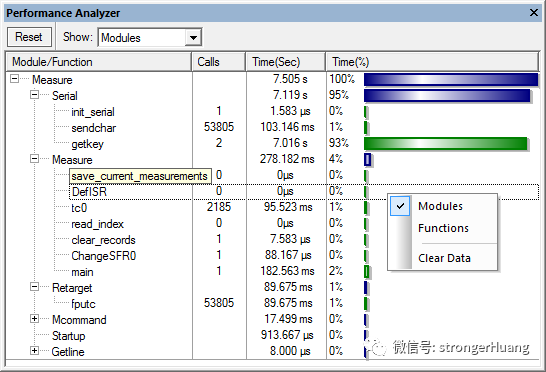
Requirements: The debugging hardware used with Keil needs to support streaming ETM tracing, such as ULINKpro.
(Some third-party debugging adapter hardware, such as the previous J-Trace Pro, does not support ETM streaming tracing in Keil, meaning it cannot be used with the performance analyzer)
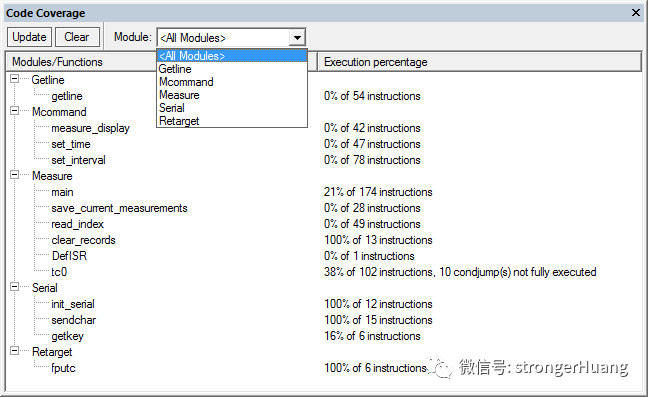
It requires streaming ETM tracing, similar to the “Performance Analyzer”. The “Code Coverage” dialog provides statistics on executed code. This information can be used alongside the disassembly window.
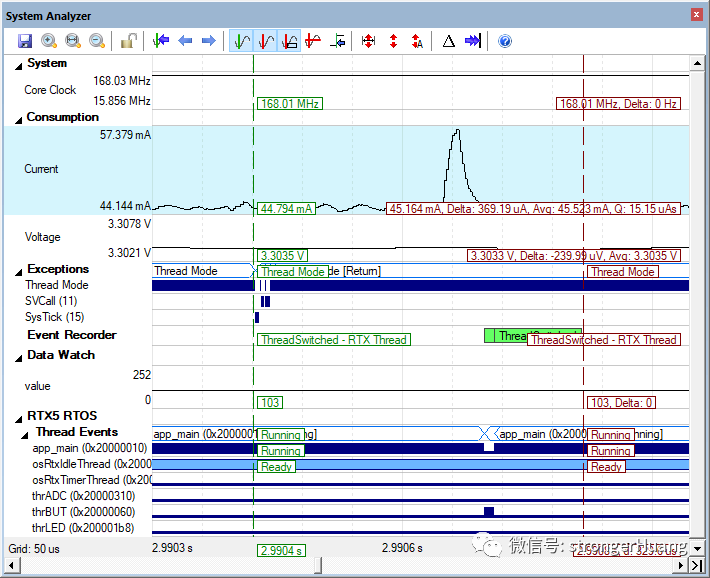
The system analyzer primarily displays certain debugging information, such as power consumption, measured core clock frequency, etc.
If you want to view other debugging information, such as RTX5 events, threads, etc., you need to correctly enable and set up the event recorder. Additionally, to view debugging information (like exceptions), SWO or ETM tracing needs to be enabled and configured.
5. System and Thread Viewer
The system and thread viewer only supports the old Keil RTXv4.x based on CMSIS RTOS v1 (only supports Keil RTX 4.82 or earlier versions).
If you are using a project compiled with the ARM V6.x compiler toolchain for Keil RTXv4.x, you must follow the guidelines for the system and thread viewer to be empty.
Similar information for Keil RTX 5 can be viewed using the “Component Viewer”.
Corresponding to point 5 above, the component viewer only supports CMSIS RTOS v2. The component viewer window displays static information to help analyze the operation of software components. The required infrastructure can be easily added to user applications and has been implemented in MDK-Middleware and Keil RTX5.
This article will stop here; there will be more related content about Keil debugging shared later.
● Column “Embedded Tools”
● Column “Embedded Development”
● Column “Keil Tutorials”
● Selected Tutorials from Embedded Column
Follow the public account reply “Add Group” to join the technical exchange group as per the rules, reply “1024” to view more content.
Click “Read Original” to see more shares.