Follow+Star Public Account, don’t miss out on exciting content

Compilation | strongerHuang
WeChat Public Account | Embedded Column
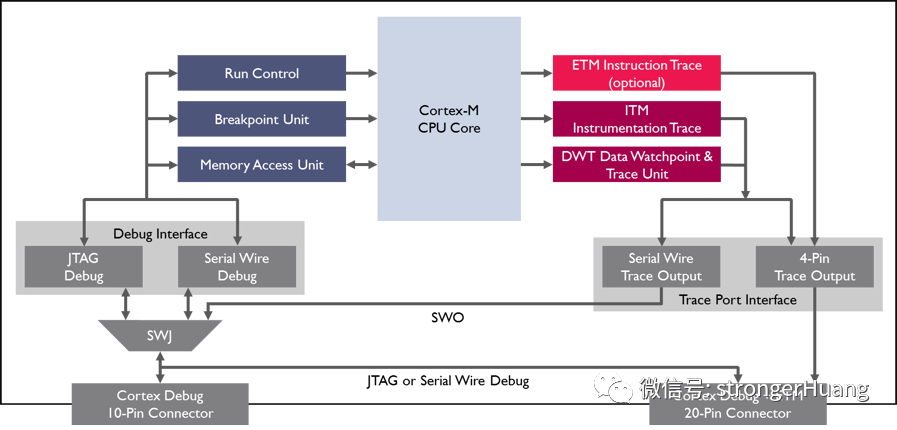
Today, many Cortex-M processors can be debugged so conveniently thanks to the CoreSight technology based on Arm Cortex-M processor devices, which introduces powerful new debugging and tracing features.
Let’s focus on the debugging and tracing aspects of CoreSight.
Embedded Column
1
1. Debugging Function
-
Control the running processor, allowing to start and stop programs -
Step through debugging source code and assembly code -
Set breakpoints while the processor is running -
Instantly read/write memory contents and peripheral registers -
Program internal and external FLASH memory
2. Tracing Function
-
The Serial Wire Viewer (SWV) provides program counter (PC) sampling, data tracing, event tracing, and instrumentation tracing information
-
Instruction (ETM) tracing streams directly to your PC, enabling historical sequence debugging, software performance analysis, and code coverage analysis

Embedded Column
2
JTAG is the industry-standard interface for downloading and debugging programs on target processors and many other functions. It provides a convenient way to connect devices and is available on all Arm-based devices. The JTAG interface can be used with Cortex-M based devices to access CoreSight debugging features.
1. JTAG History
JTAG stands for Joint Test Action Group, a common name for the IEEE standard 1149.1, known as the standard test access port and boundary scan architecture. This standard is used to verify the design and functionality of printed circuit boards produced in testing.
JTAG was officially standardized by IEEE in the document 1149.1-1990, and in 1994, a supplementary document was added to describe the Boundary Scan Description Language (BSDL). Since then, this standard has been widely adopted by electronics companies worldwide, and boundary scan has almost become synonymous with JTAG.
—Quoted from Wikipedia
2. JTAG Interface
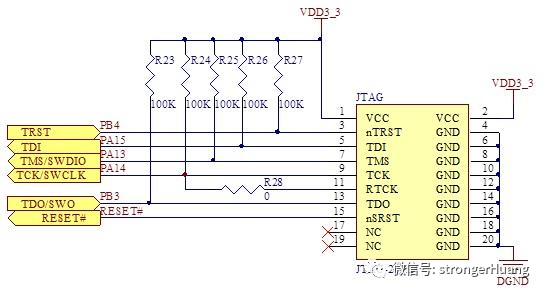
The JTAG interface typically consists of 4/5 pins connected to the chip:
-
TDI (Test Data Input)
-
TDO (Test Data Output)
-
TCK (Test Clock)
-
TMS (Test Mode Select)
-
TRST (Test Reset) optional

Embedded Column
3
SWD, Serial Wire Debug mode is an alternative method to the standard JTAG interface, providing the same debugging features with only two pins without compromising performance, and introducing data tracing functionality through the Serial Wire Viewer (SWV).
The SWD interface pins are included in the JTAG pins, allowing their use in standard target connectors. The pins include:
-
TCLK-SWCLK (Serial Clock)
-
TMS-SWDIO (Serial Data Input/Output)
-
TDO-SWO (Serial Wire Output – used by SWV)
About SWV
SWV: Serial Wire Viewer
-
PC (Program Counter) sampling
-
Event counters displaying CPU cycle statistics
-
Execution of exceptions and interrupts with timing statistics
-
Trace data – data read and write for timing analysis
-
ITM trace information for simple printf-style debugging
Embedded Column
4
I previously shared “Differences Between SWD and JTAG Download Debug Interfaces“, you can compare the differences when choosing a download debugger.
Many download debuggers support both JTAG and SWD modes, popular tools like J-Link, ST-LINK, and ULINK support them, along with many lesser-known download debuggers (such as e-Link, GD-Link, etc.) that also support SWD mode.
So, which one should we choose? Which one is better?
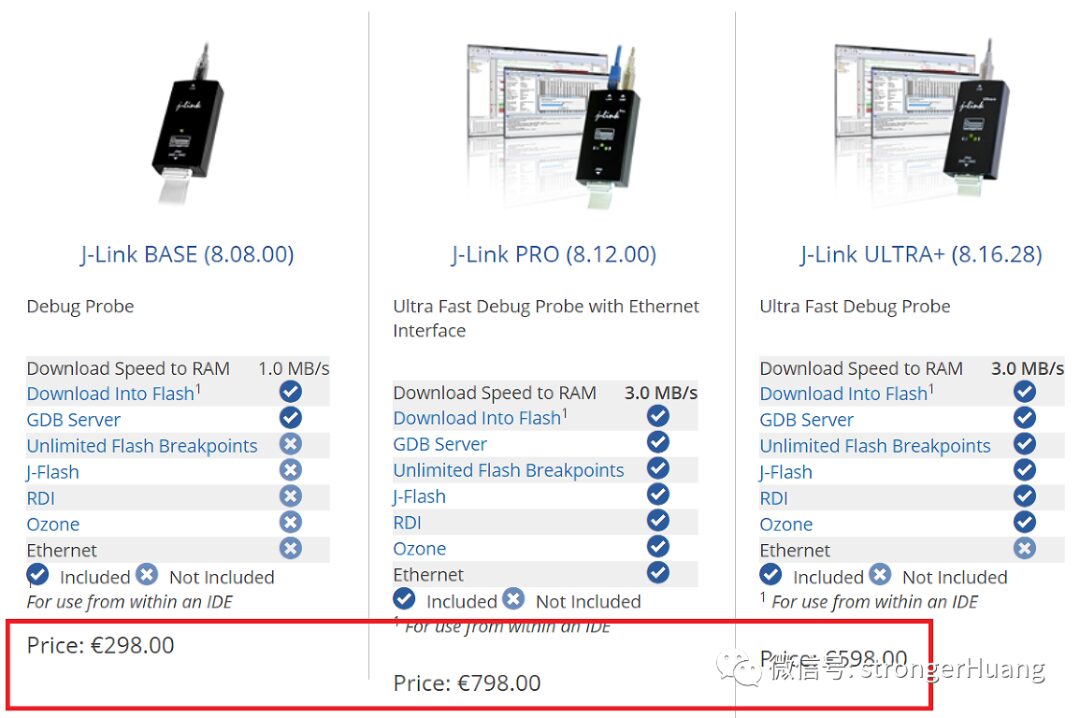
J-Link is considered comprehensive, but the price of the genuine version can be a burden for ordinary individuals..
There are various versions, costing several thousand each.

Similarly, the genuine ULINK is also priced in the thousands, just like J-Link. Of course, many people end up buying counterfeit versions of ULINK and J-Link.
In comparison to ULINK and J-Link, the genuine ST-Link is quite cost-effective; a genuine ST-Link V2 is only a couple of hundred, but the downside is that it can only be used for STM8/32.
Of course, ST-Link also has a trick: transforming into J-Link, refer to my article “How to Turn ST-Link into J-Link“.
Reply with ‘【Cortex-M】【Download Programming Tools】’ to read more related articles.

Click “Read Original” for more shares, and feel free to share, bookmark, like, and view.