With the increasing demands for signal transmission rates or resolution in fields such as wireless communication, radar, satellite communication, and optical communication, the modulation schemes used have become increasingly complex, and the signal bandwidth has widened. Modern real-time oscilloscopes, due to advancements in chip and material technology, can now provide real-time measurement bandwidths of up to several tens of GHz. Their intuitive time-domain measurements and multi-channel capabilities have led to their widespread application in ultra-wideband and RF signal measurements. This article introduces the typical applications of high-bandwidth real-time oscilloscopes in the field of RF signal measurement, as well as key indicators such as noise floor, spurious-free dynamic range, harmonic distortion, absolute amplitude measurement accuracy, and phase noise when using oscilloscopes for RF measurements.
Every engineer involved in RF or high-speed digital design faces challenges in both frequency domain and time domain testing. For instance, engineers engaged in high-speed digital circuit design typically analyze signal waveforms and eye diagrams in the time domain, while also utilizing frequency domain S-parameters to analyze insertion loss in transmission channels or phase noise metrics to assess clock jitter. Traditionally, the analysis of wireless communication, radar, and navigation signals required frequency domain tests such as spectrum, spurious, and adjacent channel suppression. However, with the increasing signal bandwidth and the application of techniques such as pulse modulation and frequency hopping, time-domain measurement methods can sometimes be more effective. The performance of modern real-time oscilloscopes has significantly improved compared to over a decade ago, meeting the testing requirements for high-bandwidth and high-precision RF microwave signals. Additionally, the triggering and analysis functions of modern real-time oscilloscopes have become richer, the user interface more user-friendly, the data transfer rates higher, and the multi-channel support capabilities better, allowing high-bandwidth real-time oscilloscopes to play a crucial role in broadband signal testing.
1. Why Use an Oscilloscope for RF Signal Testing?
Intuitiveness of Time-Domain Measurements
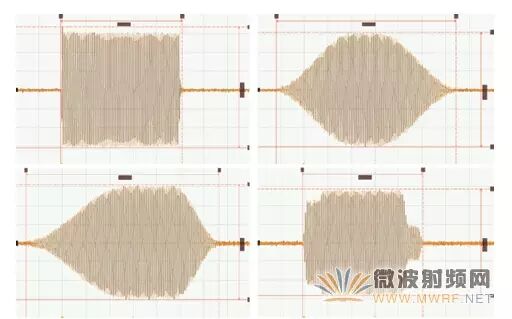
One significant reason for conducting time-domain measurements of RF signals is their intuitiveness. For example, the right figure shows four different shapes of radar pulse signals, where the carrier frequency and pulse width are similar. If only frequency domain analysis is performed, it is challenging to infer the time-domain shape of the signals. The different shapes of these four time-domain pulses are crucial for the final convolution processing algorithms and system performance, necessitating precise measurements of the pulse parameters in the time domain to ensure they meet system design requirements.
Higher Analysis Bandwidth Requirements
In traditional RF microwave testing, oscilloscopes with lower bandwidths (<1 GHz) are often used for time-domain parameter testing, such as using detectors to extract the envelope of RF signals for parameter testing or down-converting signals for collection. At this point, the RF signal has already been filtered out or converted to an intermediate frequency, so the bandwidth requirements for the oscilloscope used for measurement are not high.
However, with the development of communication technology, the modulation bandwidth of signals has increased. For example, to balance power and distance resolution, modern radars employ frequency or phase modulation within the pulse, with typical SAR imaging radar modulation bandwidths potentially exceeding 2 GHz. In satellite communications, to miniaturize and increase transmission rates, the crowded C-band and Ku-band are often avoided in favor of the Ka-band, which offers higher spectral efficiency and available bandwidth, with actual usable modulation bandwidths reaching over 3 GHz or even higher. Furthermore, the amplitude-frequency characteristic curve of oscilloscopes is not flat from DC to rated bandwidth; it begins to decline significantly after reaching a certain frequency point. Therefore, when selecting a real-time oscilloscope, its bandwidth should exceed the required analysis bandwidth, and the extent to which it exceeds should be determined based on the oscilloscope’s actual frequency response curve and the requirements of the signal being measured.
At such high transmission bandwidths, traditional measurement methods using detectors or down-conversion face significant challenges. It is difficult to find a detector or down-converter on the market that can achieve bandwidths exceeding 2 GHz while also having ideal amplitude-frequency/phase-frequency characteristics, leading to severe distortion in test results.
Moreover, if demodulation of the internal modulation information of radar pulses or satellite communication signals is required, very high real-time bandwidth is also necessary. Traditional spectrum analyzers have high measurement accuracy and frequency range, but their real-time analysis bandwidth currently does not reach above GHz. Therefore, for the analysis and demodulation of broadband signals above GHz, the most commonly used method is to utilize broadband oscilloscopes or high-speed data acquisition systems.
2. Development of Modern Real-Time Oscilloscope Technology
Traditional oscilloscopes, due to their lower bandwidth, cannot directly capture high-frequency RF signals, limiting their application in the RF microwave field to intermediate frequency or control signal testing. However, with advancements in chip, material, and packaging technologies, the bandwidth, sampling rate, storage depth, and performance indicators such as noise floor and jitter of modern real-time oscilloscopes have significantly improved.
Material Technology Innovations Enhancing Oscilloscope Bandwidth
For example, indium phosphide (InP) has become a popular material in recent years both internationally and domestically. Compared to traditional SiGe or GaAs materials, InP offers better electrical performance, providing higher saturation electron velocity, lower surface recombination velocity, and higher electrical insulation strength. The adoption of new materials also requires addressing a series of process issues. For instance, while InP has excellent high-frequency characteristics, using traditional aluminum substrates can lead to issues with inconsistent thermal expansion coefficients and heat dissipation efficiency. Aluminum nitride (AlN) is a new ceramic substrate material that has thermal properties closer to InP and better heat dissipation characteristics, but AlN is costly and hard, necessitating laser etching for processing.
Thanks to the application of new materials and technologies, the hardware bandwidth of modern real-time oscilloscopes can now exceed 60 GHz. Additionally, the excellent characteristics of InP materials result in flatter frequency response and lower noise floor, while their lower power consumption enhances product reliability.
In addition to providing excellent high-bandwidth performance, InP materials also have higher reverse breakdown voltage, allowing oscilloscopes designed with InP materials to have input ranges of up to 8V, equivalent to over 20dBm, greatly enhancing practicality and reliability.
ADC Sampling Technology Enhancing Oscilloscope Sampling Rates
To ensure high real-time bandwidth, according to Nyquist’s theorem, the sampling rate of the ADC behind the amplifier must be at least twice the bandwidth (engineering practice typically ensures over 2.5 times). Currently, there are no single-chip ADCs on the market that can achieve such high sampling rates, so high-bandwidth real-time oscilloscopes often employ ADC stitching technology.
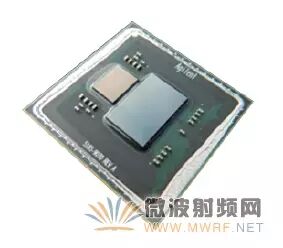
There are two typical methods for ADC stitching: on-chip stitching and off-chip stitching. On-chip stitching integrates multiple ADC cores within a single chip, as exemplified by the 40G/s sampling rate 10-bit ADC chip used in Keysight’s S-series oscilloscopes, which first achieved 10-bit resolution within an 8 GHz bandwidth range in the industry. The advantage of on-chip stitching is that consistency and delay control between channels can be managed very well, but it poses significant challenges in terms of integration and process.
Off-chip stitching refers to the use of multiple ADC chips on a PCB. A typical example of off-chip stitching is Keysight’s Z-series oscilloscopes, which utilize eight 20G/s sampling rate ADCs to achieve a sampling rate of 160G/s, ensuring hardware bandwidths of up to 63 GHz. Off-chip stitching requires excellent consistency in bias and gain between chips, as well as precise control of signal and sampling clock delays on the PCB. Therefore, the front-end chips of the Z-series oscilloscopes employ a sample-and-hold technique before signal distribution and analog-to-digital conversion, significantly improving tolerance for PCB trace errors and jitter.
3. Typical Applications of Broadband Oscilloscopes in RF Signal Testing
Thanks to the rapid improvements in bandwidth and sampling rates brought about by chip, material, and process technologies, broadband real-time oscilloscopes have begun to play a key role in RF signal testing. Here are some typical applications.
Comprehensive Time-Frequency Domain Analysis of RF Signals
The performance enhancement of real-time oscilloscopes allows their bandwidth to directly cover RF, microwave, and even millimeter-wave frequency bands, enabling direct capture and analysis of the time-domain waveforms of signal carriers. This allows for clear observation of the pulse envelope of the signal and the time-domain waveform of the carrier signal within the pulse, making time-domain parameter testing more straightforward and intuitive. Since there is no need to down-convert the signal for sampling, the testing system is also simplified, avoiding additional signal distortion caused by suboptimal down-converter performance.
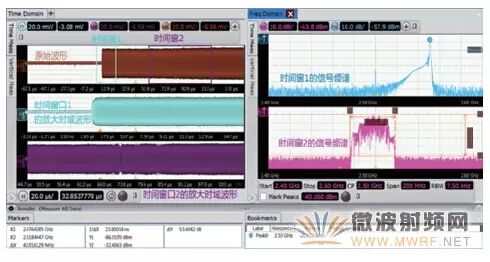
Furthermore, the time-gate function of the oscilloscope can be utilized to amplify or perform FFT transformations on a specific region of an RF signal. The following figure shows the results of FFT transformations performed on two different time windows selected from a segment of an RF pulse, clearly illustrating the changes in signal spectrum within different time window ranges.
Radar Pulse Parameter Testing
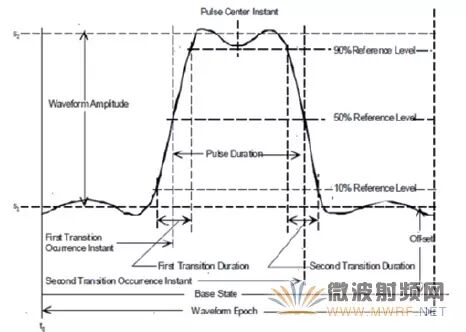
For radar and other pulse-modulated signals, key time-domain parameters such as pulse width, rise time, duty cycle, and repetition frequency are critical. According to IEEE Std 181 specifications, the definitions of some major pulse parameters are illustrated in the following figure.
Once the RF pulse has been captured using a broadband oscilloscope, a mathematical detector can be created using the built-in mathematical functions of the oscilloscope. The black curve in the following figure represents the envelope signal extracted from the original signal using the mathematical detector. After obtaining the envelope waveform, basic pulse parameter testing can be performed using the oscilloscope’s parameter measurement functions.
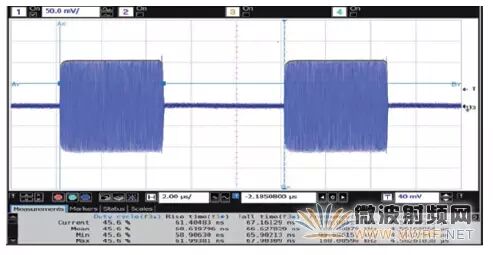
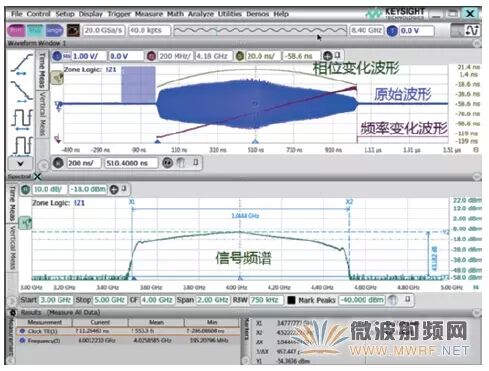
Furthermore, we can utilize the oscilloscope’s FFT function to obtain the frequency spectrum distribution of the signal, and use the oscilloscope’s jitter analysis software to observe the frequency or phase variations of the internal signal over time, displaying these results together. The following figure shows the time-domain waveform, frequency/phase variation waveform, and frequency spectrum of a Chirp radar pulse. Through the comprehensive display and analysis of these waveforms, the changing characteristics of the radar signal can be intuitively observed, allowing for simple parameter measurements.
In the testing of radar and other pulse signals, the ability to capture a sufficient number of consecutive pulses for statistical analysis is also crucial. For instance, if a search radar has a pulse repetition period of 5 ms and we want to capture 1000 consecutive pulses, we would need to record data for 5 seconds. If the oscilloscope used has a sampling rate of 80G/s, the required memory depth for 5 seconds of recording would be 80G/s * 5s = 400G samples, which is nearly impossible to achieve.
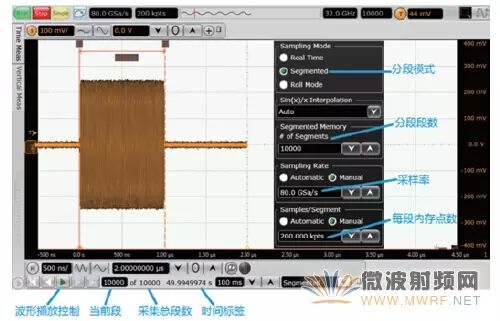
To address this issue, modern high-bandwidth oscilloscopes support segmented memory modes. The so-called segmented memory mode refers to dividing the continuous memory space of the oscilloscope into many segments, where only a short time of acquisition is performed each time a trigger occurs until enough segments are recorded. Many radar pulses are narrow, and when testing the performance of radar transmitters, if the interest is only in the signal during the very short time of pulse transmission, using segmented storage can more effectively utilize the oscilloscope’s memory.
In the example shown below, the width of the pulse being measured is 1us, and the repetition period is 5ms. We use the segmented memory mode on the oscilloscope, setting the sampling rate to 80G/s, allocating 200k points of memory per segment, and setting it to record 10,000 segments continuously. Thus, the time length that can be recorded per segment = 200k/80G = 2.5us, and the total memory depth used by the oscilloscope = 200k points * 10,000 segments = 2G points, achieving a recording time of 5ms * 10,000 = 50s. This means that through the segmented memory mode, we can achieve continuous recording of 10,000 radar pulses over a total of 50 seconds.
Comprehensive Analysis of Radar Parameters
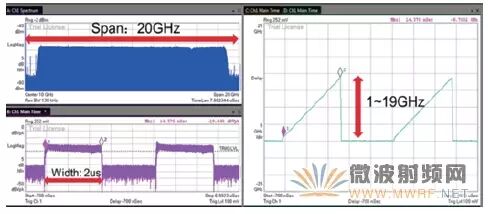
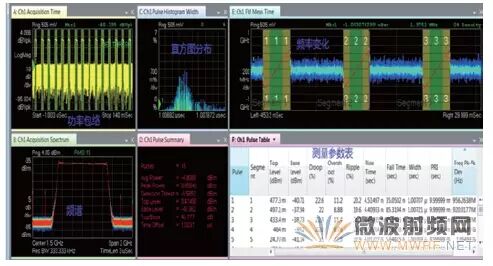
In addition to directly measuring the basic parameters of radar pulses on the oscilloscope, more powerful vector signal analysis software can also be utilized. The following figure shows an example of demodulation analysis of ultra-wideband Chirp radar signals using Keysight’s 89601B vector signal analysis software in conjunction with the oscilloscope. The figure displays the frequency spectrum, time-domain power envelope, and frequency variation curve of the measured signal. The signal under test is generated by the M8195A ultra-wideband arbitrary waveform generator, with a Chirp signal pulse width of 2us and a frequency variation range from 1GHz to 19GHz, resulting in an overall signal bandwidth of up to 18GHz! This fully demonstrates the advantages of real-time oscilloscope bandwidth.
More stringent radar testing does not merely measure basic parameters such as pulse and modulation bandwidth. For instance, due to insufficient bandwidth of components or suboptimal frequency response characteristics, variations in power of various frequency components within the Chirp pulse may occur, leading to droop and ripple phenomena on the pulse power envelope. Therefore, strict radar performance testing also requires measuring parameters such as peak power, average power, peak-to-average ratio, droop, ripple, frequency variation range, linearity, and the frequency and phase variations between multiple pulses, or analyzing the time-varying curves and histogram distributions of these parameters. These more complex tests can be implemented using the BHQ radar pulse measurement option in the 89601B software. This testing software also supports the segmented memory mode of the oscilloscope, allowing for the capture of multiple consecutive pulses for statistical analysis. The following figure shows an example of an actual test.
Frequency Hopping Signal Testing
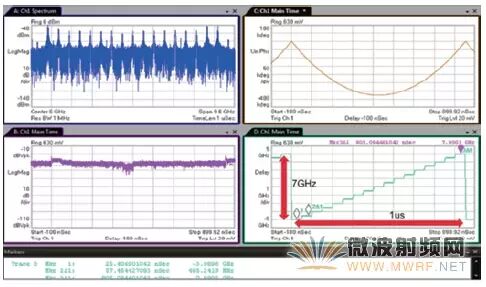
In addition to radar pulse analysis, the oscilloscope’s jitter analysis software or vector signal analysis software can also be used to analyze ultra-wideband frequency-modulated signals. The following figure shows the frequency spectrum, time domain, and frequency modulation pattern analysis results of a signal modulated over a bandwidth of 7GHz.
Modulator Delay Testing
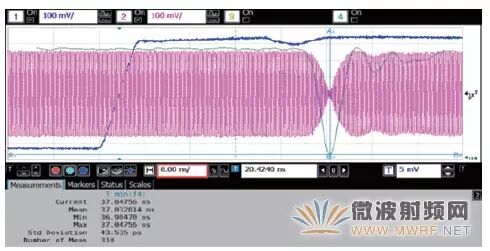
In satellite communication or navigation fields, it is necessary to test the absolute delay of RF output (which may be RF or Ku/Ka band signals) relative to internal timing signals (1pps or 100pps signals) and make corrections. This requires using at least a 2-channel broadband oscilloscope to simultaneously capture the timing signal and RF output, allowing for precise and repeatable measurements.
The following figure shows the 1pps timing signal (blue waveform) and the QPSK-modulated RF output signal (purple waveform) captured by the oscilloscope. The timing signal used for triggering arrives, and the moment of the first zero crossing of the RF signal power relative to the timing signal is the system delay to be measured. If only manual cursor measurements are used, it is challenging to accurately pinpoint the appropriate power zero crossing position. By utilizing the digital detection function introduced earlier, we can extract the power envelope of the RF signal and amplify it (as shown by the gray waveform), and use the oscilloscope’s measurement functions to measure the moment of the minimum point of the power envelope (Tmin), achieving precise testing of the delay of satellite transponders or modulators. Through multiple automatic tests of the zero crossing moments, long-term statistics can also be performed to analyze the variation range and jitter of the delay.
Demodulation Analysis of Broadband Communication Signals
In WLAN, satellite communication, and optical communication fields, performance testing and demodulation analysis of very high bandwidth signals (>500 MHz) may be required, which places high demands on the bandwidth and channel count of measuring instruments. For example, in optical fiber backbone transmission networks, single-wavelength 100Gbps signal transmission has been achieved, utilizing technology that modulates two 25Gbps signals onto a single polarization state of a laser, and then combines two other 25Gbps signals in the same manner to achieve 100Gbps signal transmission. In the development of next-generation 200Gbps or 400Gbps technologies, higher baud rates and higher-order modulations such as 16QAM, 64QAM, or even OFDM may be employed, all of which impose very high requirements on the bandwidth and performance of measuring instruments.
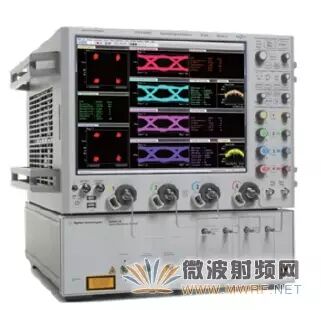
The following figure shows Keysight’s 100G/400G optical coherent communication analyzer N4391A: the lower half of the instrument is a coherent optical communication demodulator used to decompose the input signal’s two polarization states into four I/Q signals and convert them into electrical signals, with each channel supporting a maximum signal baud rate of up to 126 Gbaud; the upper half is a high-bandwidth Z-series oscilloscope, which can achieve 4 channels of 33GHz measurement bandwidth or 2 channels of 63GHz measurement bandwidth; the oscilloscope runs the 89601B vector signal analysis software, enabling polarization alignment, dispersion compensation, and simultaneous demodulation and display of four I/Q signals.
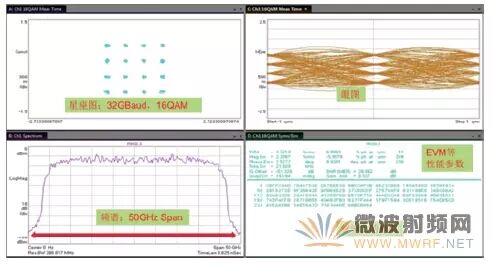
The following figure also displays the results of demodulation analysis of ultra-wideband signals performed using the oscilloscope. The signal under test is a 32Gbaud 16QAM modulated signal generated by the M8195A. Since each symbol in the 16QAM modulation format can transmit 4 bits of effective data, the actual data transmission rate reaches 128 Gbps. Through broadband frequency response correction and pre-distortion compensation, a signal-to-noise ratio of over 20dB and an EVM (Error Vector Magnitude) of <4% were achieved.
Multi-Channel Measurement
In MIMO (Multiple-input and Multiple-output), phased array, and scientific research scenarios, simultaneous measurement of more than four high-speed signals is often required. To meet this application, modern high-bandwidth oscilloscopes provide support for multi-channel measurements in both hardware and software. Keysight’s N8834A multi-channel oscilloscope software supports multi-channel oscilloscope solutions from the Infiniium 9000, 90000, S, V, and Z series.
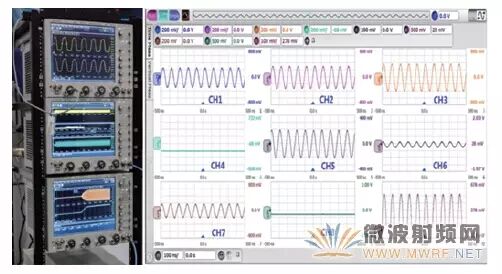
The following figure illustrates a multi-channel cascading solution based on the Z-series oscilloscope and the multi-channel measurement software within the oscilloscope, currently supporting cascading of up to 10 oscilloscopes, providing 20 synchronized measurement channels with bandwidths of up to 63 GHz, or 40 measurement channels with a bandwidth of 33GHz. Through precise delay and jitter calibration, inter-channel jitter can be controlled within 150fs (rms).
EMI/EMC Pre-Testing Functionality
Many RF products must comply with EMC regulations, and EMI phenomena can also affect product performance, especially in terms of noise and jitter. If not handled carefully, it may compromise the functionality of the entire circuit. Therefore, many circuit design guidelines include protective frequency bands, reference ground planes, loops, power control feedback, and spread spectrum clocks, all aimed at minimizing EMI effects.
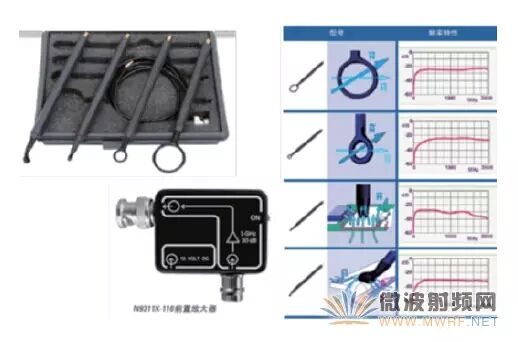
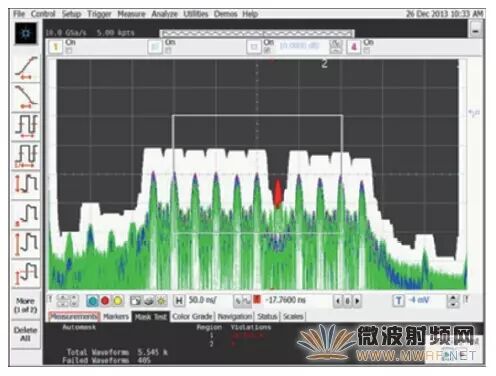
Common causes of EMI issues include switching power supplies, power filtering, ground impedance, LCD screens, metal shielding static, poor cable shielding, internal coupling of routing paths, parasitic parameters of components, and incomplete signal loops. The common analysis method for EMI issues is to use a spectrum analyzer receiver. However, many engineers may not be aware that oscilloscopes can also be used in EMI pre-testing. Previously, a concern was that oscilloscopes mostly use 8-bit ADCs, which do not have good amplitude and phase frequency response. However, with the Infiniium S-series oscilloscopes using 10-bit ADCs in the 500 MHz to 8 GHz bandwidth range and the V-series reducing the noise floor to very low levels in the 8 GHz to 33 GHz bandwidth range, oscilloscopes have gained many functionalities in EMI pre-testing, including frequency domain templates, near-field probes, simultaneous analysis of up to 8 FFTs, arbitrary position triggering, and simultaneous analysis of analog, digital, and serial signals.
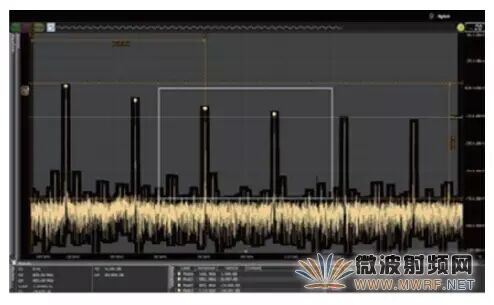
The following figures show examples of near-field probes and frequency domain template triggering that can be used for EMI pre-testing.
4. RF Performance Indicators of Oscilloscopes
From the typical applications of oscilloscopes in RF testing introduced earlier, it is evident that due to technological advancements, the high bandwidth and multi-channel advantages of oscilloscopes are very suitable for various complex ultra-wideband applications, while their comprehensive analysis capabilities in both time and frequency domains have also improved measurement intuitiveness.
However, when using oscilloscopes for RF signal testing, we must have certain concerns regarding their accuracy and performance. Although real-time oscilloscopes have high sampling rates, they generally use 8-bit ADCs, resulting in larger quantization errors and noise floors. Moreover, traditional oscilloscopes only provide bandwidth, sampling rate, and storage depth as reference indicators, with relatively few performance indicators available for frequency domain analysis. Therefore, we will recognize the RF performance indicators of oscilloscopes through some practical tests and analyses.
Noise Floor
The noise floor is a very important indicator for measuring instruments, as it affects the signal-to-noise ratio of measurement results and the ability to measure small signals. Traditionally, oscilloscopes are considered to have high noise floors, making them unsuitable for small signal measurements; however, this is not entirely accurate, as the main reason lies in the different definitions of noise floor by different instruments. The primary sources of noise floor are thermal noise and noise added by the front-end amplifier, both of which are typically proportional to bandwidth. For example, the calculation formula for thermal noise shows that noise power is linearly related to bandwidth.
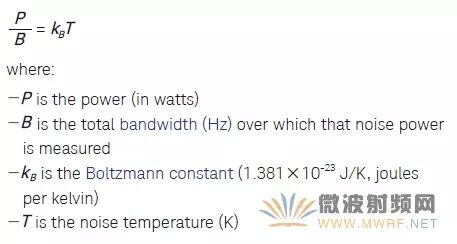
As a broadband measuring instrument, the noise floor indicator of an oscilloscope represents the total noise across the entire bandwidth range and is approximately proportional to bandwidth.
For instance, the left side of the following figure shows the noise floor indicators provided in the manual of Keysight’s S-series oscilloscopes. At a 50mV/div range, the noise floor of the 4 GHz bandwidth oscilloscope S-404 is 768uVrms, which is approximately double that of the 1GHz bandwidth oscilloscope S-104 at the same range, which has a noise floor of 456uVrms. Since power is the square of voltage, the noise power of the 4GHz oscilloscope is four times that of the 1GHz oscilloscope under the same conditions, corresponding to the bandwidth ratio.
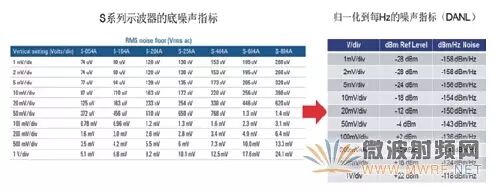
Because the noise floor is approximately proportional to bandwidth, the noise floor of broadband oscilloscopes will be larger than that of narrowband ones. To ensure fairness, we can normalize the noise floor of oscilloscopes at different ranges to per unit Hz for comparison, which is also the method used to describe the noise floor (DANL: Displayed Average Noise Level) in RF instruments such as spectrum analyzers.
For example, at a 50mV range, the full-scale of the oscilloscope is 8 divisions, equivalent to 400 mV, corresponding to -4dBm full-scale. For the 8GHz S-804A oscilloscope, the total noise floor within the 8 GHz bandwidth range is 1.4 mVrms, equivalent to -44 dBm, and normalizing the noise floor to per unit Hz gives -143dBm/Hz. In smaller ranges, the S-series oscilloscopes can achieve noise floors of -158dBm/Hz, which is better than most spectrum analyzers when the preamplifier is not turned on. Even when the preamplifier is on, many spectrum analyzers’ DANL indicators are only a few dB better than those of the S-series oscilloscopes.
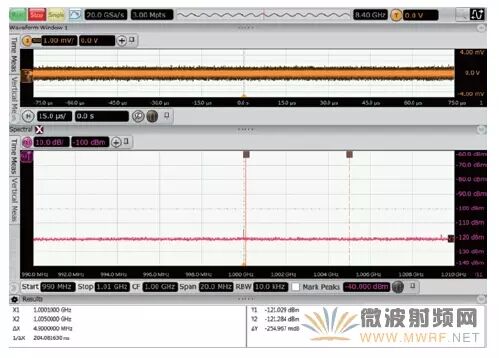
The following figure shows the measured results of the noise floor of an S-series 8GHz bandwidth oscilloscope at the minimum range. The center frequency is 1GHz, Span=20MHz, and except for a small spurious at the 1GHz frequency point, the noise floor at RBW=10KHz is approximately -120dBm, equivalent to about -160dBm/Hz.
Therefore, after normalizing to per unit Hz, the noise floor of the oscilloscope has already surpassed that of most spectrum analyzers when the preamplifier is not turned on, which is quite a good indicator. Since noise is proportional to bandwidth, if the signal bandwidth is concentrated within a specific frequency range, unnecessary out-of-band noise can be filtered out using corresponding digital filtering techniques to improve the signal-to-noise ratio. For instance, many oscilloscopes have digital bandwidth adjustment functions that serve as a method to reduce the oscilloscope’s own noise floor.
Spurious-Free Dynamic Range (SFDR)
In RF testing, in addition to the noise floor, the spurious-free dynamic range (SFDR) is also very important, as it determines the minimum signal energy that can be distinguished in the presence of large signals. For oscilloscopes, the main source of spurious is due to the imperfections caused by ADC stitching. For example, in the case of two ADCs stitched together, if the phase of the sampling clock is not controlled precisely at 180 degrees, it may cause signal distortion, resulting in spurious signals appearing in the spectrum at the stitching frequency. If the distortion is severe, even the highest sampling rates cannot guarantee the authenticity of the captured signal.
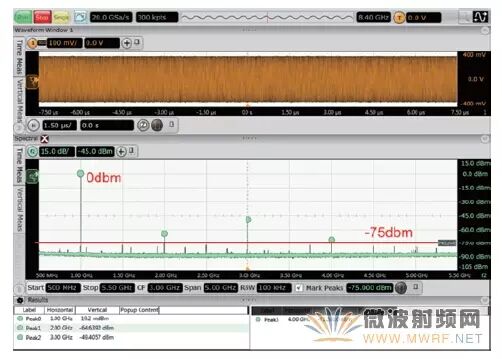
For high-bandwidth oscilloscopes, whether using on-chip or off-chip stitching, the existence of spurious due to imperfect stitching is objective, and the key is the magnitude of the spurious energy. Taking Keysight’s S-series oscilloscopes as an example, they use a single 40 G/s ADC chip, with specialized processes optimizing clock distribution and sample-and-hold circuits to ensure excellent consistency. The following figure shows the spectrum observed when a 1GHz signal generated by Keysight’s E8267D signal source is filtered to remove harmonics, revealing that aside from second and third harmonic distortions, the spurious indicators can reach -75dBc, equivalent to the level of a mid-range spectrum analyzer.
Harmonic Distortion
Harmonic distortion is also an important indicator for measuring the fidelity of the measured signal. For oscilloscopes, to ensure high sampling rates, the bit depth of the ADC (8-bit or 10-bit) differs significantly from the 14-bit ADCs used in spectrum analyzers. Harmonic distortion primarily arises from quantization noise of the ADC, typically involving second and third harmonic distortions, with the third harmonic often having greater energy, which differs from the second harmonic distortion caused by mixers in spectrum analyzers.
In the previous test results, the second harmonic distortion was approximately -65 dBc, which is somewhat worse than that of typical spectrum analyzers. The third harmonic distortion was approximately -49dBc, which is significantly worse than that of typical spectrum analyzers. Therefore, if users are concerned about harmonic distortion metrics, such as in nonlinear testing of amplifiers, using oscilloscopes may not be the best choice.
Fortunately, harmonic-induced distortions typically occur out of band, and can be easily filtered out through simple mathematical filtering processes. Thus, in some broadband signal demodulation applications, the impact of harmonic distortion on the final demodulation results is not significant due to the measurement algorithms incorporating mathematical filters during the demodulation process.
Absolute Amplitude Accuracy
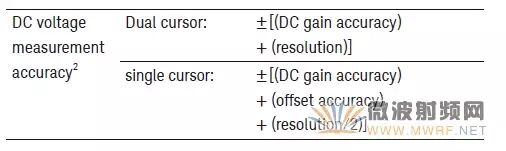
Absolute amplitude accuracy affects the accuracy of the oscilloscope when measuring the power of a carrier at a specific frequency. For oscilloscopes, the absolute amplitude accuracy indicator = DC amplitude measurement accuracy + amplitude-frequency response. Therefore, both parts need to be analyzed separately. The DC amplitude measurement accuracy is the nominal dual-cursor measurement accuracy of the oscilloscope, which consists of DC gain error and vertical resolution (as shown in the following figure, which presents the DC measurement accuracy indicators of Keysight’s S-series oscilloscopes). For real-time oscilloscopes, the DC gain accuracy is generally 2% of full scale, and the resolution is related to the bit depth of the ADC used; for a 10-bit ADC, it is equivalent to 1/1024 of full scale. Thus, the DC amplitude accuracy of real-time oscilloscopes is approximately ±0.2dB.
As for amplitude-frequency response, traditionally, the amplitude-frequency response of broadband devices is not particularly good, but modern high-performance oscilloscopes are calibrated and compensated for frequency response at the factory, resulting in very flat amplitude-frequency response curves. The following figure shows the amplitude-frequency response curve of Keysight’s 8 GHz bandwidth S-series oscilloscope, demonstrating that its in-band flatness is excellent, with fluctuations not exceeding ±0.5dB within 7.5GHz.
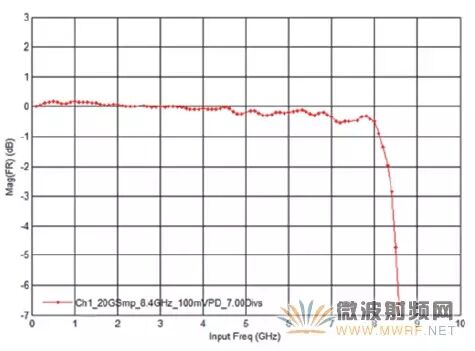
Therefore, overall, the absolute amplitude measurement accuracy of the S-series oscilloscopes can be controlled within ±1dB in the range of 7.5 GHz, which is comparable to the indicators of most mid-range to high-end spectrum analyzers. Keysight’s V-series oscilloscopes can even guarantee an absolute amplitude accuracy of ±0.5dB within the 30GHz range, surpassing the indicators of most high-end spectrum analyzers.
Phase Noise
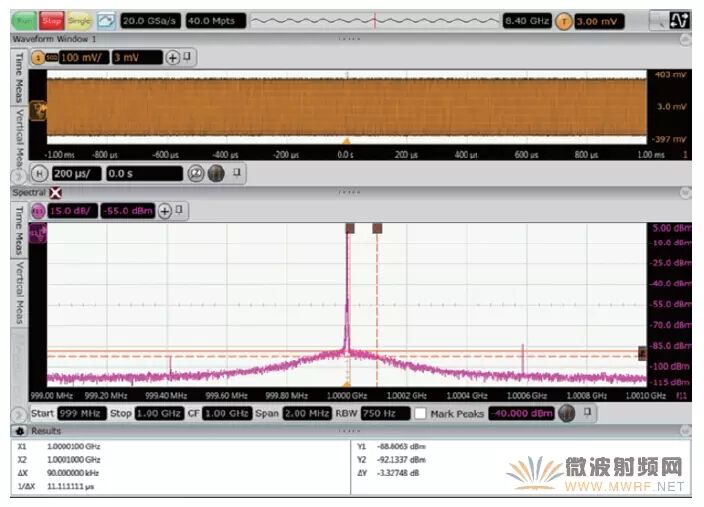
The phase noise of measuring instruments reflects the low-frequency noise level when testing a pure sine wave, which affects the ability to identify Doppler frequency shifts for slow target recognition in radar applications. The frequency domain integral of phase noise corresponds to jitter in the time domain. For oscilloscopes, poor phase noise or excessive jitter can introduce additional noise during RF signal sampling, degrading effective bits.
5. Conclusion
From the previous introduction, it can be seen that modern high-performance real-time oscilloscopes, aside from the significant harmonic distortion indicators caused by the limitations of ADC bit depth, have spurious-free dynamic ranges comparable to mid-range spectrum analyzers, while their noise floor, in-band flatness, absolute amplitude accuracy, and phase noise indicators can achieve levels similar to those of mid to high-end spectrum analyzers.
Moreover, to meet the requirements of RF testing, modern high-performance oscilloscopes not only provide traditional time-domain indicators but also begin to specify RF indicators to adapt to the usage habits of RF users. The following table presents typical RF indicators provided in Keysight’s V-series oscilloscopes.
Of course, due to the differences in working principles, real-time oscilloscopes still have some limitations when performing frequency domain analysis, such as under particularly small RBW settings (<1KHz), where the need to collect large amounts of data for FFT calculations can severely slow down waveform update speeds, making them unsuitable for narrowband signal measurements.
It is precisely because of the significant high bandwidth, multi-channel advantages, and powerful time-domain measurement capabilities of real-time oscilloscopes, combined with improved RF performance indicators, that they are beginning to play an increasingly important role in the measurement of ultra-wideband RF signals, comprehensive time-frequency domain analysis, and multi-channel measurements.
Author BiographyLi Kai, graduated from the Department of Optoelectronic Engineering at Beijing Institute of Technology with a master’s degree, has 15 years of experience in the communication and measurement industry. He joined Agilent Technologies in 2006, responsible for applications and research in high-speed digital testing products such as signal integrity analysis. He is the author of the book “Principles and Testing Guide for High-Speed Digital Interfaces” and has published numerous articles on measurement principles and methods for high-speed buses on his personal technical blog.
 Click the bottom「Read the original text」to view the schedule for the 2016 KMF Keysight Technologies Testing and Measurement Conference