Click the blue words to follow us
Abstract
Obsessive-Compulsive Disorder (OCD) is associated with dysfunction in the frontal-striatal, prefrontal, limbic system, and visual cortex. Studies using proton magnetic resonance spectroscopy (1H-MRS) suggest that changes in neurotransmitter levels (such as glutamate) may lead to this dysfunction. However, the neurotransmitter levels in OCD patients show inconsistent results, possibly due to previous studies’ limited focus on neurotransmitter dynamics. This study employs functional MRS (fMRS) and functional magnetic resonance imaging (fMRI) to explore these dynamic changes and brain activation during the provocation of OCD symptoms. The study includes 30 OCD patients and 34 matched healthy controls. It investigates the changes in BOLD signals and glutamate levels in the lateral occipital cortex (LOC) during OCD symptom provocation tasks.
Both the OCD group and the control group exhibited higher glutamate levels and stronger BOLD signal activation in the LOC region when viewing symptom-provoking images compared to neutral images, but no significant differences were found between the groups, nor was any correlation observed between the two responses. However, this study emphasizes the potential of fMRS in investigating the neurochemical basis related to psychiatric disorders. Future research may also use pre- and post-intervention fMRS-fMRI to explore the effects of known medications and neuromodulation techniques that can modulate glutamate pathways on OCD.
Introduction
In the visual cortex, the lateral occipital cortex (LOC) processes emotional stimuli. Meta-analyses show that OCD patients exhibit stronger LOC activation under OCD-related visual stimuli compared to controls. This response is believed to be a result of amygdala modulation of significant emotional stimuli. In addition to changes in brain activation, an increasing body of research suggests that glutamate is related to the pathophysiology of OCD, indicating that glutamate is a potential target for pharmacological or neurostimulation interventions. Proton magnetic resonance scanning (1H-MRS) can non-invasively measure the concentration of neurochemicals. Although results from 1H-MRS studies are inconsistent, they consistently show changes in glutamate concentrations in the frontal-striatal and frontal-limbic brain circuits of OCD patients. While there are fewer studies on the visual cortex, two 1.5T MRS studies found that lower Glx levels in the primary visual cortex were associated with higher OCD severity.
Previous resting-state MRS studies were limited in not considering stimulus-induced neurotransmitter dynamic changes. Functional magnetic resonance spectroscopy (fMRS) can provide insights into these changes and enhance understanding of brain activity. Research indicates that sensory stimuli and motor tasks increase glutamate levels, with recent evidence showing that cognitive tasks have a similar effect. To date, the most compelling evidence for clear neurotransmitter level changes from fMRS comes from studies in the visual cortex, where task-induced glutamate level changes have been continuously observed in this brain area. fMRS studies in healthy populations show that visual stimuli can increase glutamate levels in the primary visual cortex by 2-5.3%.
This study aims to investigate the role of glutamate in the LOC during symptom provocation activation processes in OCD patients. The LOC not only processes emotional stimuli but also participates in object recognition and perception. Therefore, we hypothesize that OCD-related stimuli will increase glutamate levels and BOLD signal responses in the LOC across both groups, but that the responses will be greater in the OCD patient group. Additionally, we hypothesize that the glutamate response will be positively correlated with the BOLD signal response.
1. Participants
Thirty adult OCD patients (7 males, 23 females) and 34 matched controls (14 males, 20 females) were recruited. Patients were required to meet DSM-5 criteria with a Y-BOCS score of ≥16. Individuals with evident hoarding, substance dependence, severe mental disorders, intellectual disability, suicidal tendencies, and brain injuries were excluded. The control group had no history of mental disorders. Participants were aged 18-70 years, fluent in Dutch, and signed consent forms. Medication doses had to be stable for ≥6 weeks, and caffeine was avoided for 2 hours prior to MRI. The study was approved by the ethics committee and complied with the Declaration of Helsinki.
2. Clinical Assessment
Severity of OCD was measured using the Y-BOCS and Dimensional Y-BOCS (DY-BOCS), and emotional and anxiety comorbidities were assessed through SCID-V. Participants completed the OCI-R to assess OCD symptoms and used HAM-D and HAM-A to measure depression and anxiety, with IQ estimated using the DART (Dutch Adult Reading Test).
3. Imaging Acquisition
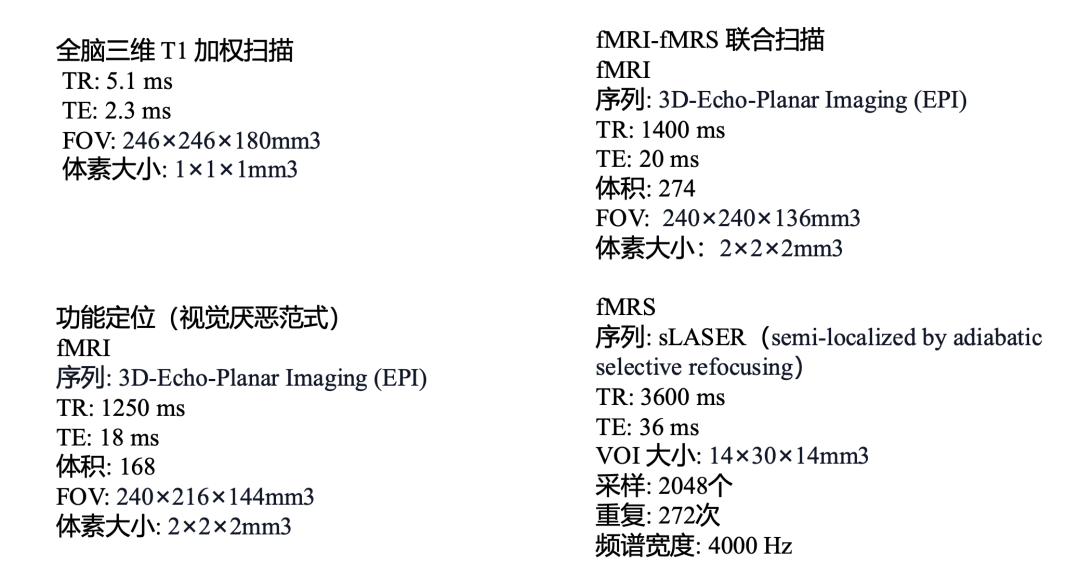
Data were acquired using a 7 T Achieva MR scanner equipped with a 32-channel head coil. The scanning protocol included whole-brain 3D T1-weighted scans and fMRI-fMRS combined scans (parameters shown in the figure below). To accurately locate the LOC region with the maximum BOLD signal response to visual stimuli, functional localization techniques were used to identify and analyze brain activity in specific areas through real-time processing of fMRI data during a brief visual aversion paradigm. Dynamic alternating linear field techniques and a set of shared static second-order terms were employed to optimize the B0 homogeneity for fMRS and fMRI. FSL was used to create a 3D gray matter voxel mask for each subject.
4. Task Design
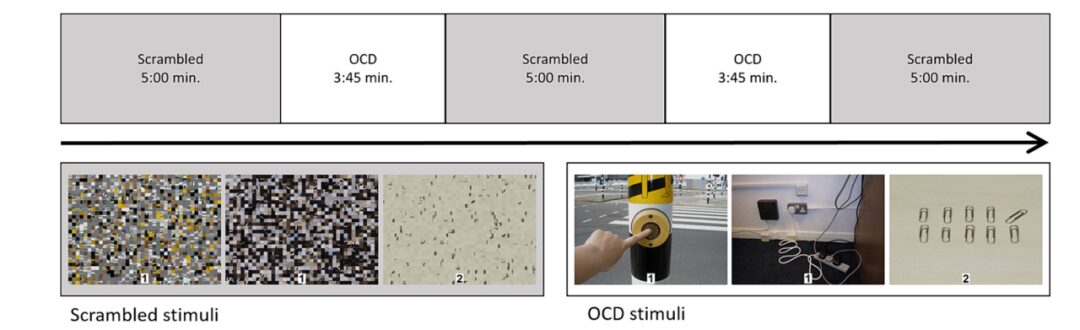
The functional localization task used visual stimuli that elicited disgust or fear in the general population to locate the voxel position for fMRS in the LOC. The task consisted of six 35-second blocks, alternating between provocative images and their scrambled versions.
The formal task included two blocks of OCD symptom-triggering images and three scrambled (neutral) image blocks. The OCD symptom images reflected three aspects: checking, contamination, and symmetry, with 15 images presented for each dimension per block, each shown for 4 seconds, with random stimulus intervals of 800 to 1200 milliseconds, for a total duration of approximately 22.5 minutes.
Participants were required to respond with button presses to random numbers (1 or 2) at the bottom of each image. The task was conducted using E-Prime 2.0 software. Subjective distress (SUDS) ratings were collected before and after the task, ranging from 0 (very relaxed) to 100 (extremely anxious), to assess distress caused by the task. After scanning, participants rated their attitudes towards all images on a computer, ranging from 1 (not anxious) to 9 (extremely anxious).
5. Magnetic Resonance Data Processing
MATLAB was used to preprocess fMRS data, including coil combination, eddy current correction, spectral registration, etc. Data were converted to NIfTI format and spectral fitting was performed to analyze glutamate and control metabolites. Data of poor quality were excluded according to spectral quality guidelines, and group differences were analyzed. Fitting was performed using the dynamic model fitting tool in FSL-MRS, employing a general linear model (GLM) to establish a transient response model. The design matrix included two OCD stimulus blocks, linear drift, quadratic drift, and baseline. In the dynamic model, phase, drift, and baseline were fixed, while concentration and linewidth were constrained by the temporal model.
For fMRS data, the following contrasts were assessed: a) OCD stimulus block activation 1 vs baseline, b) OCD stimulus block activation 2 vs baseline, c) average activation vs baseline.
The main effects of the task were assessed via one-sample t-tests, and differences between the OCD and control groups were evaluated through two-sample t-tests while controlling for age and gender, using FSL FLAMEO for analysis.
6. Statistics
Statistical analysis was performed using R-Studio, including demographic, clinical data, and subjective ratings. Normality was assessed using the Shapiro-Wilk test. Subjective ratings were analyzed using the Wilcoxon signed-rank test, with FDR correction for multiple comparisons. The relationship between glutamate changes and BOLD signal responses was studied, extracting fMRS and fMRI data for correlation analysis. Differences in correlation between the OCD and control groups were assessed using Fisher’s z transformation. Sensitivity analyses examined whether changes in neurotransmitters and functional activation were influenced by other factors. Group differences in baseline metabolite/tCr ratios were assessed, and the relationship between metabolite outcomes and data quality (linewidth) was analyzed.
“
RESULT
Results – Baseline
1. Demographic Characteristics
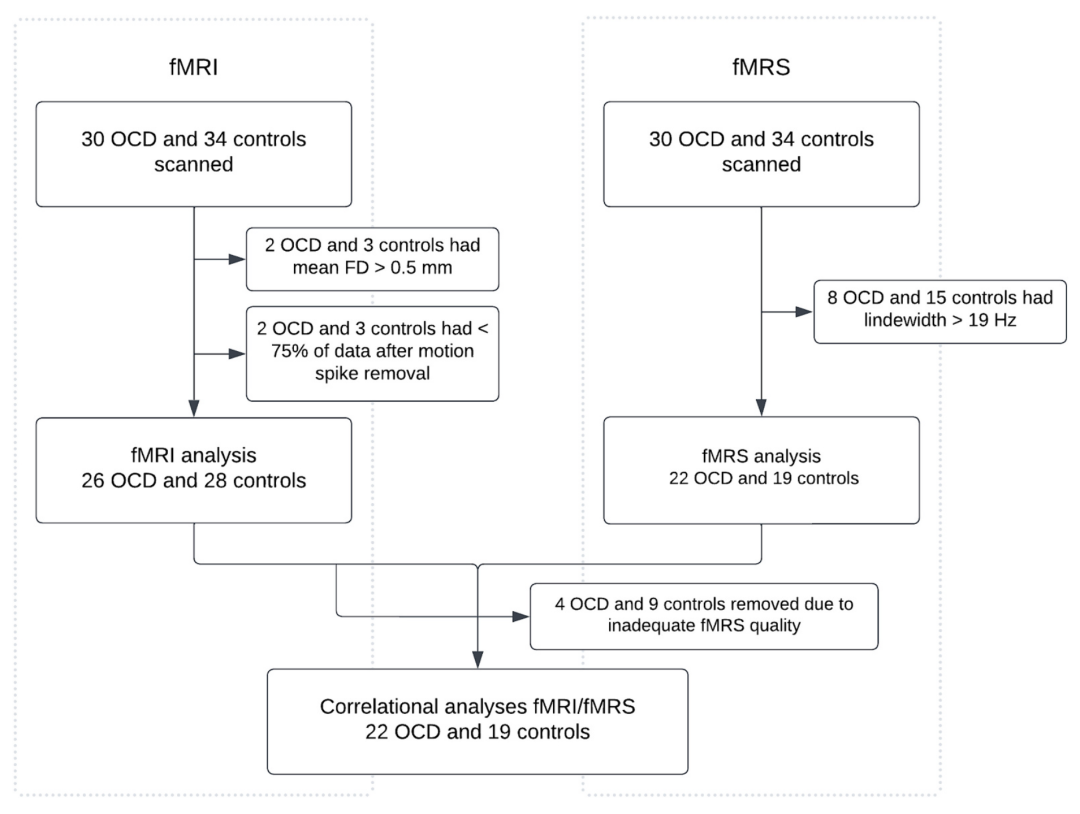
Due to movement and data quality issues during acquisition, some participants were excluded. Ultimately, fMRI analysis used data from 26 OCD patients and 28 controls, while fMRS analysis used data from 22 OCD patients and 19 controls. In the combined analysis, the data quality was good for 22 OCD patients and 19 controls. No significant differences were observed between the two groups in age, gender, or IQ, but the OCD group had significantly higher scores for depression and anxiety.
2. Imaging Quality
No significant differences were found between the OCD group and the control group in imaging quality comparisons (average frame displacement for fMRI and FWHM of the NAA peak for fMRS). There were also no differences in voxel fractions of CSF, WM, or GM between the two groups.
3. Task Activation
No group differences were observed in SUDS scores before and after the functional localization task, nor were there group differences in SUDS scores before and after the formal task with OCD symptom-triggering images.
Compared to the control group, the OCD group had significantly higher overall anxiety ratings and anxiety ratings reflecting each subdimension (checking, symmetry, cleaning) during the OCD symptom image blocks.
“
RESULT
Task Effects on Neurotransmitters
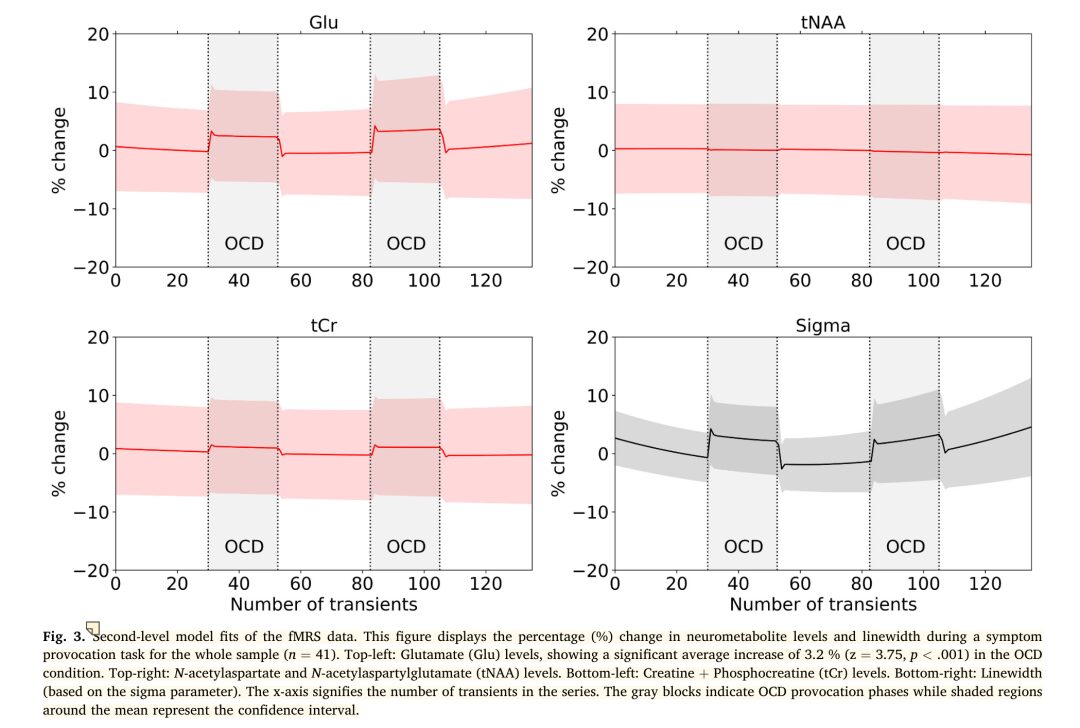
For all participants, the study found a significant increase in glutamate levels when viewing OCD symptom images compared to viewing scrambled images (n = 41, mean change: 3.2%, z = 3.75, p < 0.001). tNAA showed no change (z = 0.84, p = 0.80), while tCr significantly increased (z = 2.89, p = 0.001). (See figure below)
The OCD group (n = 22, increase of 2.0%, z = 1.88, p = .030) and the control group (n = 19, increase of 4.8%, z = 3.40, p < .001) both exhibited increases in glutamate levels when viewing OCD symptom images. In the OCD group, tCr and tNAA showed no task-induced changes. In the control group, tCr increased during the OCD symptom provocation phase (z = 2.70, p = .003), while tNAA remained stable.
No significant differences in task-induced glutamate levels were observed between groups (OCD-control group, z = 1.33, p = .09). tNAA and tCr also showed no group differences. Including medication status in the model did not affect the intergroup results for glutamate (OCD-control group, z = 0.48, p = .31). In the OCD sample, duration of illness (z = 1.02, p = 0.15) or age of onset (z = 0.51, p = 0.70) did not significantly impact glutamate levels.
“
RESULT
Task Effects on BOLD Signal Responses
In both the OCD and control groups, the LOC region exhibited higher average BOLD signal responses when viewing OCD symptom images compared to viewing scrambled images (t(25) = 8.17, p < 0.001); for the control group: (t(27) = 10.21, p < 0.001). Intergroup comparisons showed no significant differences (W = 300, p =0.27). (See figure below)
At the whole-brain level, uncorrected results indicated that when comparing the activation of OCD symptom images to scrambled images, the control group showed higher activation in the following regions compared to the OCD group:
– Left supplementary motor area (t=4.46, p<0.001)
– Right cerebellum area 6 (t=4.28, p<0.001)
– Right caudate nucleus (t = 4.16, p< 0.001)
– Left superior parietal lobule (t = 4.15, p< 0.001)
– Left medial orbitofrontal cortex (t = 4.11, p< 0.001)
– Left precentral gyrus (t = 4.08, p< 0.001)
– Left inferior parietal lobule (t = 3.82, p< 0.001)
– Left cerebellum area 6 (t = 3.76, p< 0.001)
In contrast, the OCD group showed higher activation in the right precentral gyrus compared to the control group (t = 3.64, p < 0.001)
“
RESULT
Clinical Characteristics and BOLD Signal and Glutamate
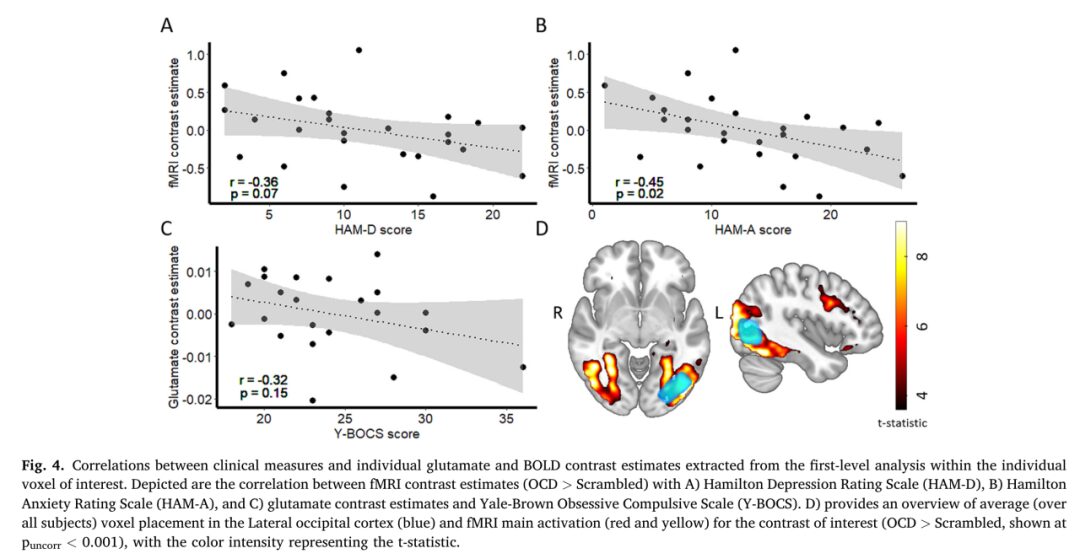
The contrast estimates of BOLD signal in OCD patients were significantly negatively correlated with HAM-A scores (r(24) = -0.45, p = 0.020) (See figure B), SUDS scores after symptom provocation (r(18) = -0.52, p = 0.020), and anxiety ratings when viewing symmetry category OCD images (r(23) = -0.42, p = 0.037). No significant correlation was found with HAM-D scores (r(24) = -0.36, p = 0.068).
Y-BOCS and OCI-R scores and other SUDS ratings showed no significant correlation with glutamate contrast estimates.
“
RESULT
Association Between Glutamate Changes and BOLD Changes
No significant correlation was found between task-induced glutamate dynamic changes and LOC BOLD dynamic changes among all participants (r(35) = -0.03, p = 0.87), nor within groups (OCD group: r(19) = 0.01, p = 0.97; control group: r(14) = -0.02, p = 0.94). There was no significant difference in correlation coefficients between the OCD and control groups (z=0.08, p=0.94).
“
RESULT
Sensitivity Analysis
To study the relationship between metabolite detection and spectral data quality, the sample was divided into high-quality (narrow linewidth) and low-quality (wide linewidth) groups based on the NAA peak linewidth.
– Low-quality group (n = 21): Significant increases in glutamate (z = 2.4, p = 0.009) and tCr (z = 3.2, p < 0.001) during OCD symptom block stimulation, with an increase in linewidth (z = 4.2, p < 0.001).
– High-quality group (n = 20): Glutamate changes remained significant (z = 2.9, p = 0.002), but tCr levels and linewidth showed no significant changes.
Baseline metabolite/tCr ratios were assessed to determine potential intergroup differences in static metabolite levels. The analysis indicated a significant baseline difference in the Glu/tCr ratio, with the OCD group showing lower Glu/tCr levels than the HC group (t(38.1) = 2.17, p = .036). No intergroup differences were observed for other metabolites.
Across the entire sample, there was no association between baseline glutamate levels and task-induced glutamate changes, regardless of whether participants were in the OCD or control group.
Discussion
This study aimed to explore the dynamic changes of glutamate in the LOC during symptom provocation tasks in OCD patients and the association of these changes with BOLD signal responses. A 7T fMRS-fMRI combined approach was used. The results showed that both OCD and control participants exhibited higher glutamate levels and BOLD activation when viewing OCD symptom blocks compared to neutral blocks, consistent with hypotheses and previous findings. However, neither glutamate levels nor BOLD responses showed significant differences between the two groups, nor was any correlation found between the two.
The reasons for the fluctuations in glutamate levels during task states remain controversial, but computational models suggest that they are related to sustained increases in synaptic transmission and neuro-metabolism. Given the longer duration of stimulus blocks, the increase in glutamate may primarily be attributed to slow and sustained changes in neuro-metabolic processes rather than rapid synaptic transmission responses.
The LOC is primarily responsible for object recognition and perception and is also part of the facial processing system, involved in processing negative visual stimuli. Activation of the LOC is altered in OCD and other psychiatric disorders (such as ADHD, autism spectrum disorders, and major depression). It remains uncertain whether the changes observed in the LOC (neurotransmitter or BOLD signal) are due to emotional processing, object recognition, or a combination of both, as neutral conditions were defined using scrambled images (OCD symptom blocks contained concrete objects). While neutral scenes or objects could be used, defining what constitutes true neutrality is challenging, as even seemingly neutral images may trigger OCD symptoms in some individuals.
The lack of expected intergroup differences may be due to the selection of LOC as the study area rather than the traditionally OCD-associated prefrontal cortex and limbic system. The choice of LOC was based on neuroimaging evidence and methodological feasibility, and the application of fMRS, especially when integrating fMRI in the same sequence, presents significant technical challenges.
Regarding glutamate dynamic changes, the control group exhibited greater glutamate and BOLD responses than the OCD patients, but these differences did not reach statistical significance (glutamate: p = 0.09, BOLD: p = 0.27). This is contrary to expectations that OCD patients would have higher glutamate responses. Previous research by Thorsen using emotional paradigms indicated that OCD patients had higher BOLD activation in the LOC compared to controls. However, Yu’s study focused on symptom provocation tasks (similar to those used in this study) and found lower LOC activation in OCD patients compared to controls. Possible reasons include variations in task types, sample sizes, and patient characteristics. Previous studies have indicated that the direction and strength of LOC responses are influenced by the type of emotional stimuli (such as specific symptoms, threatening or aversive images), age of onset, and level of insight into the disorder. Unfortunately, the relatively small sample size in this study limits the ability to conduct subgroup analyses on these different OCD-related clinical variables.
Thorsen’s research indicated that LOC activation was related to medication status. In this study, although including medication status in the model did not significantly alter the intergroup results for glutamate, it did seem to slightly narrow the differences between the OCD and control groups. This suggests that medication may have a potential modulatory effect on glutamate levels, even though not statistically significant. Interestingly, this medication-driven slight modulation was not reflected in fMRI activation within the LOC.
The study failed to observe significant correlations between fMRI and glutamate changes at the individual level, which is inconsistent with findings from some studies. This may be due to fMRI and fMRS reflecting different aspects of neuronal activation or considerable individual estimation differences. The longer task block time during fMRI may have reduced sensitivity to detect BOLD differences. Additionally, habituation effects from task stimuli may influence the results. Finally, atypical variations in linewidth within the sample emphasize the importance of data quality. Future studies should consider task design, block duration, and data quality.
Original article: de Joode NT, van den Heuvel OA, Koster M, et al. Glutamate dynamics and BOLD response during OCD symptom provocation in the lateral occipital cortex: A 7 Tesla fMRI-fMRS study. J Affect Disord. 2024;367:416-425. doi:10.1016/j.jad.2024.08.216
Previous Recommendations
Research Frontiers | The Molecular Basis of Vitamin D in Treating Depression and Anxiety
Research Frontiers | A Systematic Review of Control Beliefs in Obsessive-Compulsive Disorder
Stepping Out of the Obsessive World to See the Bigger Picture
Dr. Zheng Huirong’s Science Popularization ㉒ Treatment of Obsessive-Compulsive Disorder, Anxiety, and Depression, How to Prevent Relapse and What is the Efficacy After Relapse?