 Hue-Recognizable Lateral Flow Immunoassay Based on High Color Purity Semiconductor Nanoplatelets
The lateral flow immunoassay (LFIA) has been widely used for the rapid screening of infectious diseases during the COVID-19 pandemic. However, due to the physiological limitations of the human eye in distinguishing monochromatic brightness variations, commercial colloidal gold and traditional fluorescent LFIA can only provide poorly readable results based on brightness gradients. Furthermore, single-signal quantitative results are easily affected by fluctuations in ambient and excitation light sources. Therefore, developing a hue-recognizable LFIA (HLFIA) based on dual-signal ratios is an effective method for achieving precise and visually distinguishable point-of-care testing (POCT). Visual and image analysis is a method that utilizes portable terminals for visual inspection and quantitative visual information analysis of digital images, without the need for specialized instruments, facilities, or trained personnel. This model consists of two parts: naked-eye semi-quantitative analysis of interval variables and fine quantitative analysis conducted via portable terminals such as smartphones. Both detection scenarios require high color purity labeling materials (composed colors) to generate composite color gradients as diagnostic results, which can be recognized by human vision and accurately decoded and reconstructed through machine vision and imaging processing.
Semiconductor nanocrystals, also known as quantum dots (QDs), have broad applications in biomedical and in vitro diagnostics. Compared to traditional organic dyes, quantum dots have wide excitation and symmetric tunable emission spectra. However, due to three-dimensional quantum confinement effects and size polydispersity, the color purity of quantum dots is greatly influenced by the uniformity of their crystal sizes. In recent years, plate-like semiconductor nanocrystals (nanoplatelets, NPLs) have emerged as promising high color purity luminescent alternatives to quantum dots. The excitons in NPLs with atomic-level surface flatness are precisely confined in the thickness direction to atomic layers, resulting in minimal impact from polydispersity in the cross-sectional direction on emission purity. Therefore, NPLs are particularly suitable for accurate color presentation, naked-eye readable imaging processes, and quantitative sensing systems for color recognition patterns.
However, NPLs wrapped with hydrophobic ligands are difficult to disperse in aqueous phases, hindering their application in the field of biosensing. Two prerequisites to solve this problem are: ensuring the hydrophilicity of the material surface and precisely controlling the colloidal size and size distribution. So far, strategies to obtain water-dispersible NPLs include two categories: ligand exchange with hydrophilic thiols or encapsulation using amphiphilic polymers. Compared to the above methods, integrating hydrophobic units into hydrophilic carriers is an effective strategy that not only facilitates the phase transfer of NPLs but also enhances the fluorescence brightness of single-particle colloids through the collective effect of a large number of merged units. Classical evaporation-induced self-assembly can induce compact encapsulation of hydrophobic luminescent units, which may cause self-Förster resonance energy transfer (FRET) leading to fluorescence quenching of NPLs due to face-to-face stacking. Template-based assembly provides another avenue for the integration of NPLs, allowing products to have controllable sizes and good size uniformity. However, common non-porous templates such as polystyrene latex or silica microspheres have the drawback that the assembly units are limited to surface or superficial loading, resulting in low brightness or optical instability issues. Therefore, to construct high-performance NPLs colloidal assembly structures, it is necessary to uniformly disperse the flat/elongated NPLs in the three-dimensional space inside the template and achieve a large filling depth.
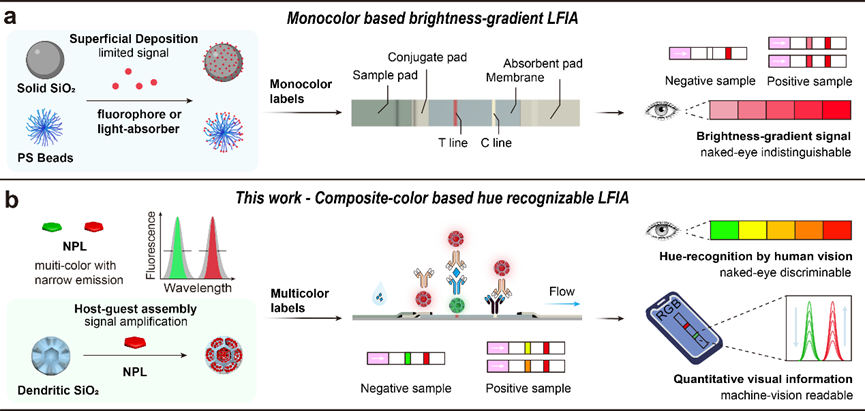
Figure 1. a) Traditional monochrome LFIA optical label structure and detection mode based on brightness gradients. Here, fluorophores refer to fluorescent dyes and quantum dots. Light-absorbing materials refer to colloidal gold and colored dyes. b) Design of narrow-emission NPL labels and detection mode of color recognition LFIA based on composite colors.
In this work, we utilized the fluorescence color purity of NPL-based water-soluble labels to propose a new hue-recognizable lateral flow immunoassay method. Compared to traditional fluorophores, NPLs have narrower emission peak half-widths, which is expected to improve the human and machine vision distinguishable diagnostic results in quantitative detection of analyte concentrations, thus achieving home-use instrument-free self-testing and fine quantification via smartphones (Figure 1). We designed a host-guest assembly structure based on NPLs, which has size uniformity, water dispersibility/stability, narrow emission, and color tunability. Thiolated dendritic silica scaffolds have highly open central radial channels and ultra-large pore openings, particularly suitable for deep embedding assembly of elongated NPLs (pore depth > 100 nm). The thiol-metal coordination-driven assembly, the trade-off between polar affinity templates and non-polar units in different polarity solvents, and the gradual/low-damage silanization of hydrophobic assembly are crucial for the final silica-NPLs-silica assembly. Based on this assembly, we established a green to red hue gradient LFIA for naked-eye reading and smartphone-based quantitative analysis of SARS-CoV-2 nucleocapsid protein in clinical respiratory samples, as well as classification of SARS-CoV-2 positivity levels.
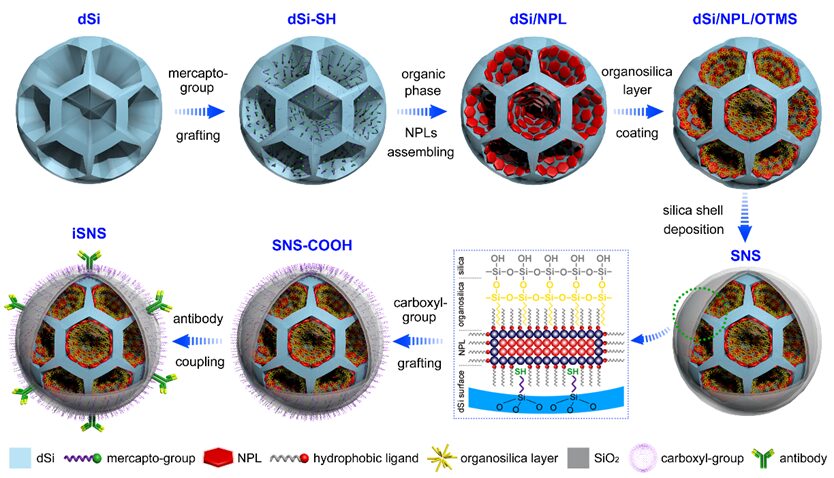
Figure 2. Synthesis route and internal structure schematic of NPLs-based water-dispersible colloidal assemblies.
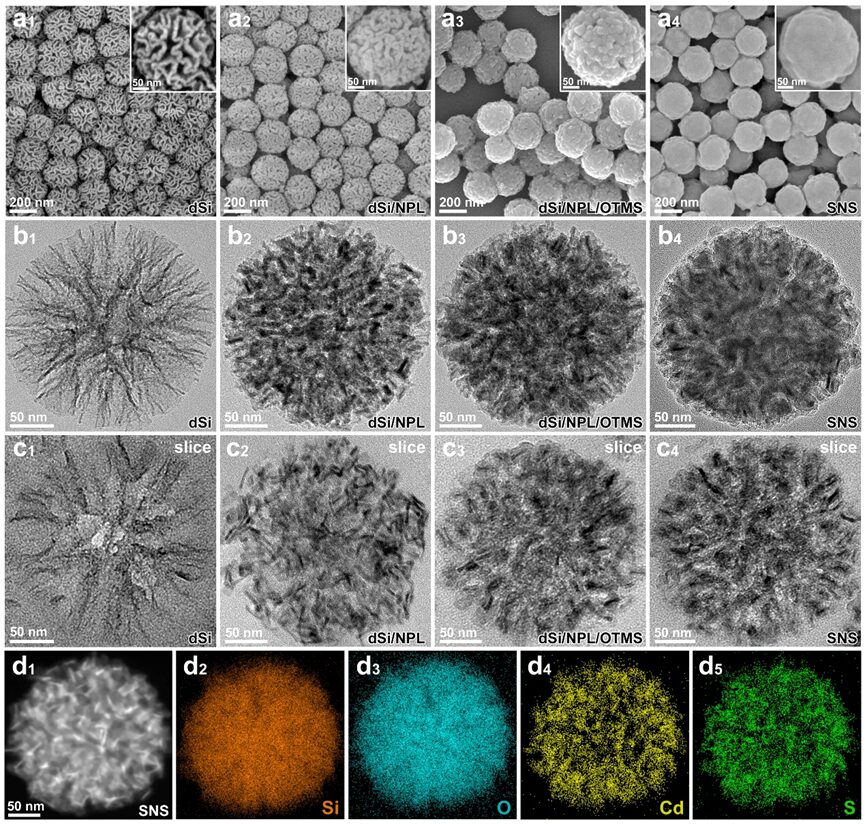
Figure 3. a) SEM images of dSi (a1), dSi/NPL (a2), dSi/NPL/OTMS (a3), and SNS (a4). Inset shows scanning electron microscope image of a single particle. b-c) TEM images of individual dSi (b1), dSi/NPL (b2), dSi/NPL/OTMS (b3), SNS (b4) and their corresponding sliced cross-sections with a thickness of 70 nm (c1-c4). d) Scanning transmission electron microscope (STEM) image (d1) and EDS spectrum of a single SNS (d2-d5).
Figure 2 shows the synthesis scheme of NPLs-based water-dispersible colloidal assemblies. As shown in scanning electron microscope (SEM) images (Figure 3a1), dendritic silica spheres (dSi) were synthesized via anionic-assisted methods, with an average size of 240 nm and an average pore size of 42.6 nm. We synthesized core/shell CdSe/CdS/CdZnS (or CdSeS/CdS/CdZnS) NPLs using a hot injection method. NPLs exhibit flat and elongated shapes, with a lateral area of 264 nm² (length × width = 24 nm × 11 nm) and a thickness of 4.4 nm (Figure S2). To minimize optical damage to NPLs, we employed thiolated silica (dSi-SH) matrices and coordination-driven assembly between the metal-containing guests. When guest nanoparticles are fixed on the porous walls of silica, the channel width of the hydrophobic assembly (dSi/NPL) significantly decreases (Figure 3a2, b2). To ensure that dSi/NPL maintains good structural integrity and fluorescence retention, we introduced a mild phase transfer process driven by hydrophobic interactions between the long-chain alkyl portion of NPL ligands and organosilanes. The encapsulation of the surface organic silicon layer was achieved through the hydrolysis and condensation of octyltrimethoxysilane (OTMS). A dense silica shell was grown on the dSi/NPL/OTMS surface via the Stöber method (Figure 3a4, b4). The dual-layer encapsulation of organosilicon and silica is beneficial for the luminescent performance of NPLs. Sliced transmission electron microscope (TEM) images (Figure 3c1-c4) confirm the uniform and deep channel embedding of NPLs within the silica scaffold, validating the good adaptability of the large-pore template for hydrophobic nanosheets with elongated shapes (20 nm length). Energy dispersive spectroscopy (EDS) images show the symmetrical distribution of NPLs in the silica-NPLs-silica (SNS) colloid (Figure 3d1-d5).
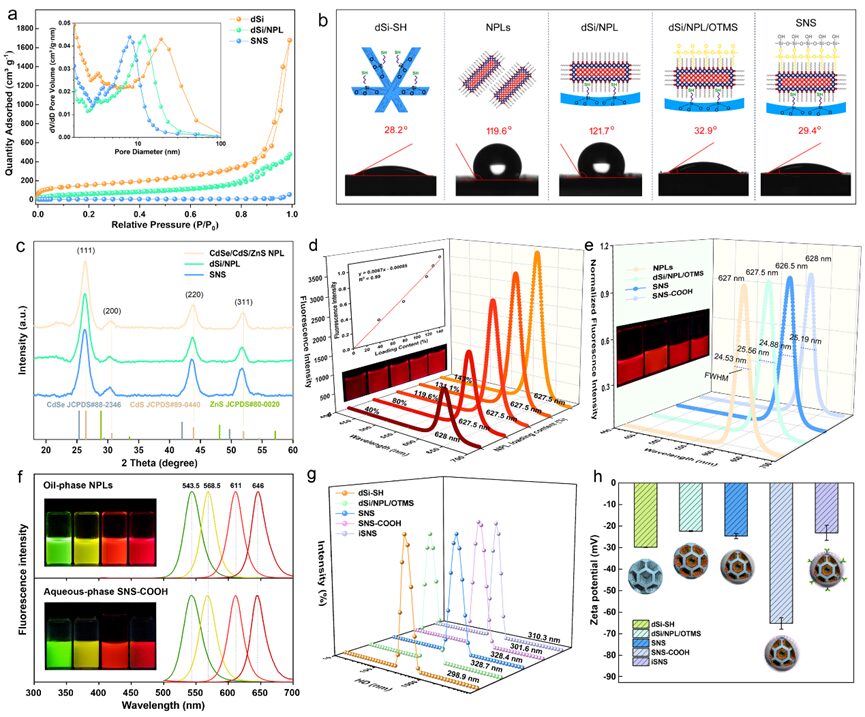
Figure 4. a) N2 adsorption/desorption isotherms and pore size distribution of dSi, dSi/NPL, and SNS (insert). b) Water contact angle measurements of dSi-SH, NPLs, dSi/NPL, dSi/NPL/OTMS, and SNS. Inset: Schematic of corresponding nanostructures. c) XRD patterns of CdSe/CdS/CdZnS NPL, dSi/NPL, and SNS. d) Relationship between fluorescence intensity of dSi/NPL assembly and NPL assembly rate. Inset shows the linear relationship between fluorescence intensity of dSi/NPL and NPL loading amount, along with corresponding fluorescence images. e) Fluorescence spectra of NPLs, dSi/NPL, SNS, and SNS-COOH. Inset shows corresponding fluorescence images. f) Emission spectra of oil-phase green, yellow, orange, and red NPLs and their water-dispersible derivatives SNS-COOH. Inset shows corresponding fluorescence images. g, h) Hydrated particle size (g) and surface potential (h) of dSi-SH and its derivative nanostructures in water.
Key Points:
Structural and optical characterization of the assembly process demonstrated the successful loading of NPLs guests within dendritic silica sphere matrices. Structural characterization includes changes in pore morphology with NPL assembly, changes in contact angle, and XRD characterization; as shown in the N2 adsorption-desorption isotherm in Figure 4a, the typical IV-type hysteresis loop indicates the mesoporous nature of dSi templates and dSi/NPL assemblies. With the fixation of NPLs on the porous walls of silica, its water contact angle (WCA) significantly increased from an initial 28.2° to 121.7°, approaching the contact angle (119.6°) of NPLs with oleic acid ligands. The organic silicon encapsulation and silicate deposition gradually imparted a polar surface to the assembly, with WCA values of 32.9° and 29.4°, respectively. X-ray diffraction (XRD) patterns (Figure 4c) show that the characteristic peaks of dSi/NPL and SNS colloids remain unchanged, indicating that the assembly and phase transfer have minimal impact on the nanosheet crystalline structure. From Figure 4d, it can be seen that as the LC (LC, assembly rate) increases from 40% to 143%, the brightness of dSi/NPL increases almost linearly, likely due to the uniform assembly of NPLs in the 3D scaffold space, rather than the cross-sectional stacking method that usually leads to fluorescence quenching. Following the dual-layer silica encapsulation and surface carboxylation synthesis process, the relative photoluminescence quantum yield (PLQY) of NPLs slightly decreased, but the full width at half maximum (FWHM) and emission peak remained nearly unchanged (Figure 4e). The water-dispersible carboxylated SNS colloid (SNS-COOH) with different color emissions maintained the inherent spectral characteristics of oil-dispersed SNS, illustrating the universality of this synthesis strategy (Figure 4f). The hydrated particle size (HD) distribution of the nanostructures all exhibited similar colloidal sizes and a single size distribution peak, with polydispersity indices (PDI) all below 0.2, validating the assembly within the template and good water dispersibility (Figure 4g). The zeta potentials of dSi/NPL/OTMS, SNS, and SNS-COOH colloids were -22, -25, and -65 mV, respectively, indicating that surface silanization and carboxyl modification occurred in the nanocomposites compared to the silica template (Figure 4h).
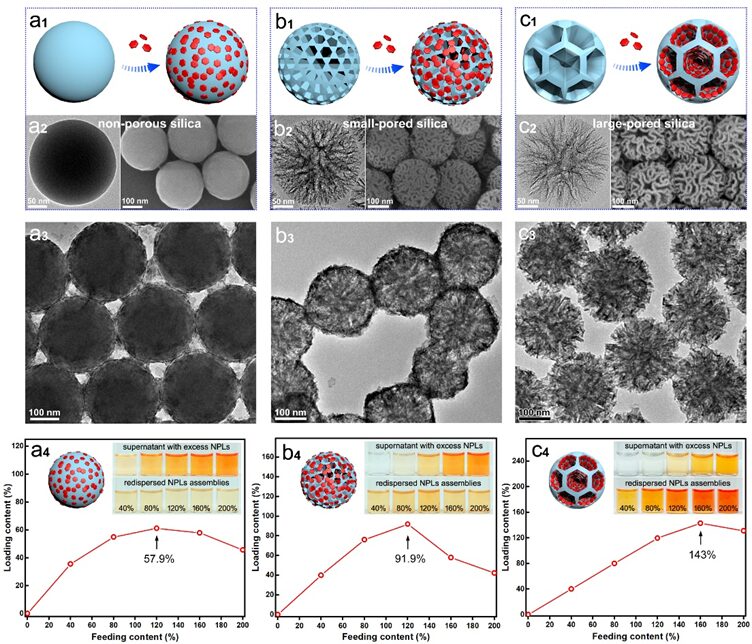 Figure5. a1-c1) Schematic of NPLs assembly with non-porous silica (a1), small-pore silica (b1), and large-pore silica (c1) templates. a1-c1 correspond to the TEM (left) and SEM (right) images of the templates. a2-c2 correspond to the TEM images of silica-NPL assemblies. a4-c4) Assembly rate images of templates corresponding to a2-c2. Inset: Photos of the supernatant containing excess NPLs (top) and re-dispersed dSi/NPL assemblies (bottom) after assembly and centrifugation, with the added content (defined as the weight ratio of added total NPLs to dSi-SH) being 40%, 80%, 120%, 160%, and 200%.
To verify the morphological regulation of the host and guest in template assembly, we studied the effect of template porosity on NPLs assembly efficiency. We selected non-porous solid silica spheres, small-pore silica spheres, and large-pore silica spheres with sizes ranging from 230 to 240 nm as candidate host scaffolds (Figure 5a1-c2). Since solid silica has no accessible internal space apart from the surface to support NPLs, the plate-like guests accumulate around the spherical surface, and the assembled aggregate was observed to have a low assembly rate of 57.9% (Figure 5a3, a4). Despite the second template having a dendritic morphology, the small pore size (approximately 28.6 nm) easily blocks the pore entrances for NPLs from the cross-section (24 nm × 11 nm), leading to guest nanoparticles accumulating near the surface, with an assembly rate of 91.9% (Figure 5b3, b4). Notably, when the pore size exceeds 40 nm (Figure 5c2, S1b), the highly accessible internal space of the dendritic template allows the thiolated silica walls to uniformly capture NPLs (Figure 5c3). Compared to the first two candidate templates, the dSi/NPL obtained from the third template exhibited significantly enhanced color darkness, achieving an assembly rate of up to 143% (Figure 5c4), validating the importance of geometric matching for host-guest assembly.
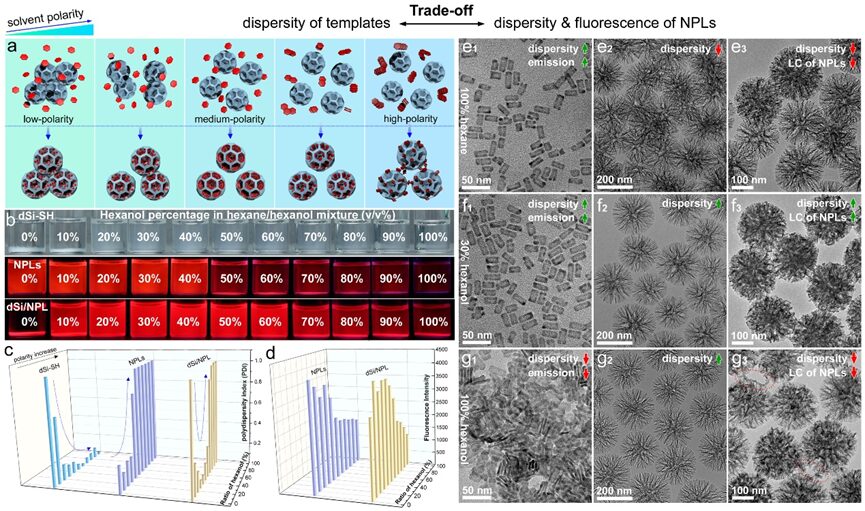 Figure6. Trade-off strategy of colloidal dispersibility of dSi-SH and dispersibility/fluorescence of NPLs. a) Schematic of dispersibility and fluorescence states of dSi-SH, NPLs, and dSi/NPL in solvents of different polarities. b) Photos of dSi-SH (top, sunlight), NPL, and dSi/NPL (middle, bottom, UV light) dispersed in a hexane-alcohol mixed solvent. c) Polydispersity index of dSi-SH, NPLs, and dSi/NPL in hexane-alcohol mixed ratios from 0% to 100% of hexanol. d) Corresponding TEM images of NPLs (e1, f1, g1), dSi-SH (e2, f2, g2), and dSi/NPL (e3, f3, g3) in 100% hexane, 30% hexanol-70% hexane, and 100% hexanol.
To achieve satisfactory colloidal dispersibility, NPL loading efficiency, and fluorescence intensity of dSi/NPL assemblies, we adopted a “trade-off” strategy to reconcile the conflicting surface polarities between the silica host and NPL guests (Figure 6a). Generally, high polarity solvents favor the dispersion state of silica colloids, while low polarity solvents favor the dispersibility and fluorescence retention of NPLs. We studied the compatibility of the hexane/alcohol mixed binary solvent for simultaneously assembling the host and guest. The oleic acid-capped NPLs required the fraction of the weak solvent (hexanol) to be less than 50% to maintain satisfactory dispersibility and brightness (Figure 6b-c). However, the dSi-SH template required the fraction of the favorable solvent (hexanol) to be greater than 20% to exhibit a smaller polydispersity index (PDI = 0.02-0.15). By optimizing the ratio of polar solvents, we ultimately adopted a 30% hexanol-70% hexane assembly mixed solvent to form colloidal dispersible and highly emitting NPL assemblies (Figure 6d). TEM images further confirmed the morphology of the assemblies and products, as shown in Figure 6e-g.
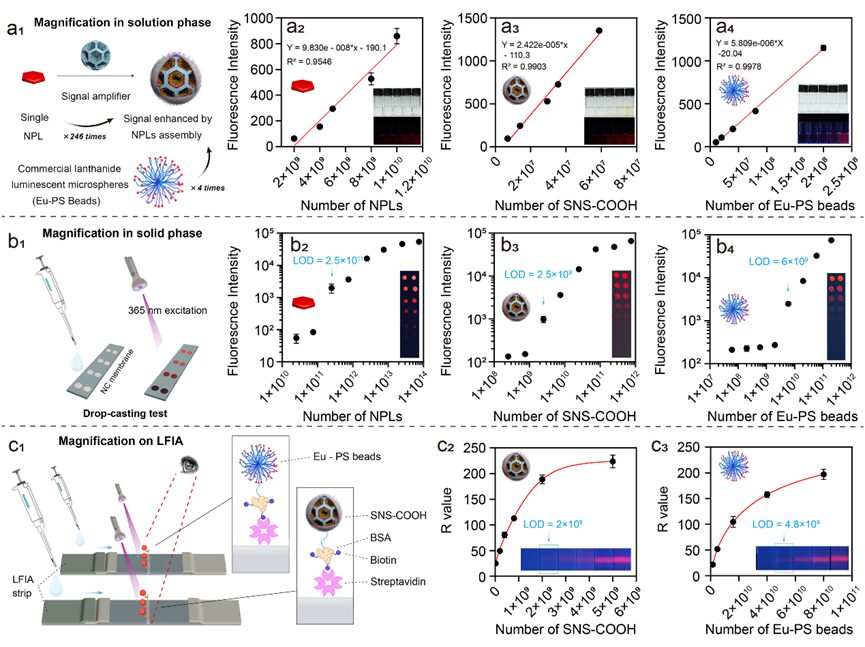 Figure 7. Signal amplification verification of SNS as a light label. a1) Schematic of signal enhancement of single SNS-COOH particles relative to single NPL and commercial Eu-PS beads in solution phase. (a2 -a4) Relationship between FL intensity and particle number of NPLs (a2), SNS-COOH (a3), and Eu-PS beads (a4). Inset: Corresponding photos under sunlight and UV light. b1) Schematic of drop-casting test operation mode. Different particle numbers of NPLs (b2), SNS-COOH (b3), and Eu-PS beads (b4) influence FL intensity on NC membranes.
The first advantage of SNS colloidal particles lies in the integrated fluorescence brightness of single particles. We verified the signal amplification effect of single SNS-COOH relative to known particle numbers of original oil-phase NPLs and commercially available europium-complex-doped polystyrene latex (Eu-PS) microspheres in solution phase. The comparative results in the solution phase (Figure 7a) and the linear slope of fluorescence intensity versus particle numbers show that SNS-COOH enhanced the fluorescence intensity of NPLs and Eu-PS by 246 times and 4 times, respectively. We demonstrated the brightness enhancement of SNS-COOH in solid phase through drop-casting tests on nitrocellulose (NC) membranes (Figure 7b). With the increase in the number of fluorophore particles, the brightness of the spots increased monotonically, with the first naked-eye discernible spot appearing at 2.5 × 10¹¹ (NPL), 2.5 × 10⁹ (SNS-COOH), and 6 × 10⁹ (Eu-PS) particle numbers, indicating that SNS-COOH has a lower detection concentration threshold and higher sensitivity on NC membranes. The signal amplification of labels on LFIA was achieved using a streptavidin-biotin recognition system. As shown in Figure 7c, fluorophores conjugated with BSA and biotin were captured by fixed SA lines, showing that brightness (R value) is proportional to particle concentration.
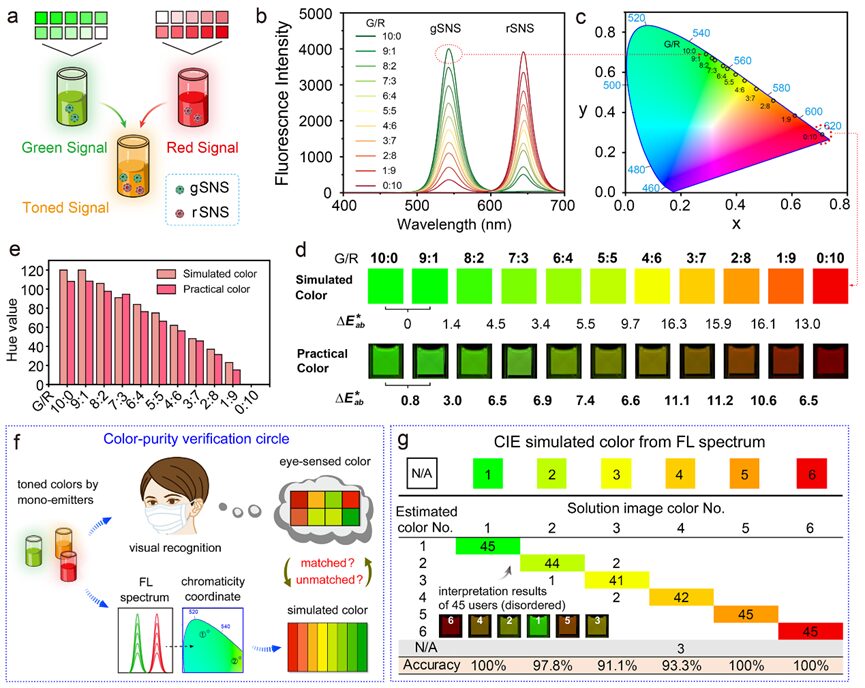 Figure 8. Verification of color purity of gSNS and rSNS single luminescent units. a) Schematic illustrating the composite colors obtained from continuously mixed gSNS and rSNS solutions. b, c) Fluorescence spectra (b) and spectral corresponding coordinates in the CIE 1931 chromaticity diagram (c) of a series of mixed solutions with green/red (G/R) fluorescence intensity ratios from 10:0 to 0:10. d) Simulated color blocks extracted from coordinates corresponding to the chromaticity diagram (top) and actual mixed solution images under UV light (bottom) showing G/R gradients. Color difference (∆E*ab) calculated using the CIE 94 algorithm. e) Consistency of hue values of simulated colors and actual colors in (d). f) Schematic of verification of color purity of single luminescent units in synthetic colors. g) Visual reading results of 45 independent testers referring to the corresponding simulated color blocks in six solution color gradients.
The second advantage of SNS colloids lies in their inherent color purity (narrow emission), which makes them promising for use in HLFIA. To clarify that different green-red ratios (G/R) of binary composite tonal gradients can produce accurate color images for visual analysis, we compared the theoretical and actual colors of green/red mixed SNS (g/rSNS) solutions (Figure 8a). The fluorescence spectra of mixed g/rSNS solutions with intensity ratios from 10:0 to 0:10 (Figure 8b) correspond to a series of coordinates that distribute along the edges of the CIE chromaticity diagram, indicating that single luminescent units exhibit high color purity (Figure 8c). The simulated color blocks provided by the CIE chromaticity coordinates serve as references for the actual solution’s composite color accuracy (Figure 8d). The colors of the solution images closely match the simulated colors from the chromaticity diagram and demonstrate high discernibility between adjacent hues (∆E*ab > 5 indicates visually perceivable colors). The quantitative results of hue information extracted from simulated colors and actual solution images correlate well (Figure 8e). The visual reading results of mixed g/rSNS solution images by individual users referencing the simulated color blocks show an average accuracy of up to 97% across six color gradients (Figure 8f,g). For comparison, representative red (FITC) and red (Eu complex) fluorophore-emitting colloidal beads were adjusted to a series of color gradients for analysis (Figure S5). The FL spectra corresponding to the CIE chromaticity coordinates are close to the center white point of the CIE chromaticity diagram, exhibiting significantly lower saturation (saturation indicates the color degree of a region) in solution images (e.g., G/R = 5:5). The hue values extracted from the simulated color blocks and actual solution images show considerable differences (Figure S5d), while the average human interpretation accuracy is 39% (Figure S5e). In contrast, the narrow-emission SNS tags are more suitable for hue-recognition-based diagnostic applications.
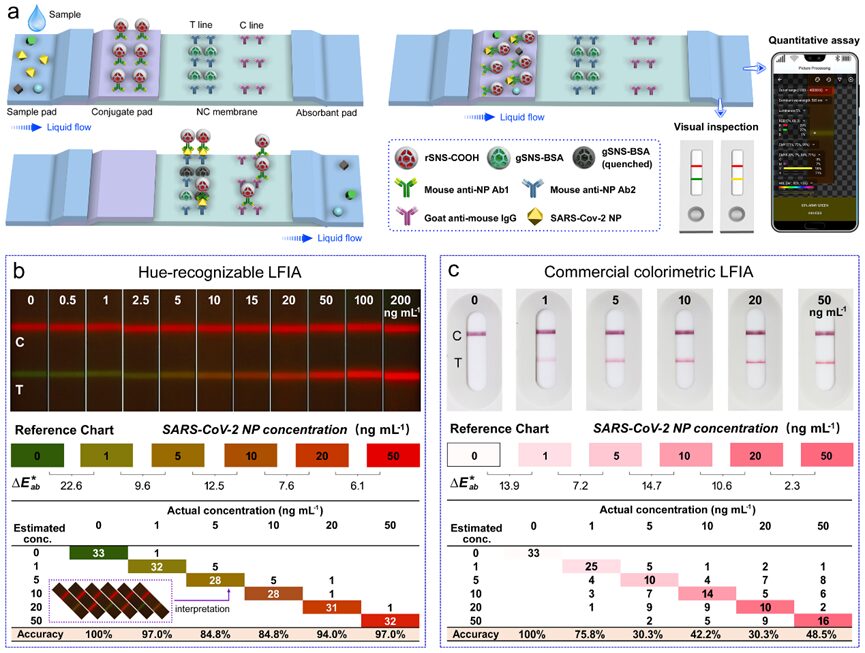
Figure 9. a) Schematic of SARS-CoV-2 NP immunochromatography process using HLFIA test strips and reading method. b) Images of UV-excited test strips with added concentrations of SARS-CoV-2 ranging from 0 to 200 ng/mL (top). The eye-based interval quantification results (bottom) were completed by 33 independent subjects across six colored T lines. c) Images of commercial colorimetric LFIA (dye-doped PS beads as labels) with different added concentrations of SARS-CoV-2 NP (top). Eye-based interval quantification results (bottom) were completed by 33 independent subjects. The color difference (∆E*ab) between adjacent blocks in the reference chart was calculated using the CIE 94 algorithm.
Considering that monochrome LFIA models can only produce brightness gradient changes, which are unfavorable for human eye detection (semi-quantitative), we constructed a color-recognizable LFIA (HLFIA) to represent antigen concentration intervals with high visual discernibility. As shown in Figure 9a, under positive sample addition, the color of the test (T) line evolves from green to red through sandwich immunoreaction and signal/contrast dual-color models. The absorption of rSNS overlaps with the excitation and emission spectra of gSNS (Figure S6a), resulting in an inner filter effect (IFE) of the two luminescent units. This generates a G-R reversible composite color band. Figure 9b shows the color gradient of the T line related to the concentration of SARS-CoV-2 NP ranging from 0-200 ng/mL. The colorimetric LFIA detection results of commercial colorimetric (dye-absorbing PS beads) SARS-CoV-2 NP-LFIA are evaluated for comparison. The colorimetric LFIA detection results show changes in the brightness of the T line as shown in Figure 9c. The color blocks in the reference chart are selected based on the principle of human visual discernibility between adjacent blocks (∆E*ab > 5, the last block in Figure 9c is excluded due to signal saturation). The accuracy of naked-eye readings was tested by independent users attributing T line colors to a given reference color chart. Compared to the average accuracy of 54.5% of the commercial colorimetric LFIA model, the HLFIA model with tonal gradients achieved an average reading accuracy of 92.9% across six concentration intervals. These results confirm that narrow-emission tags are beneficial for tonal gradient diagnostics and accurate naked-eye readings of concentration/risk levels.
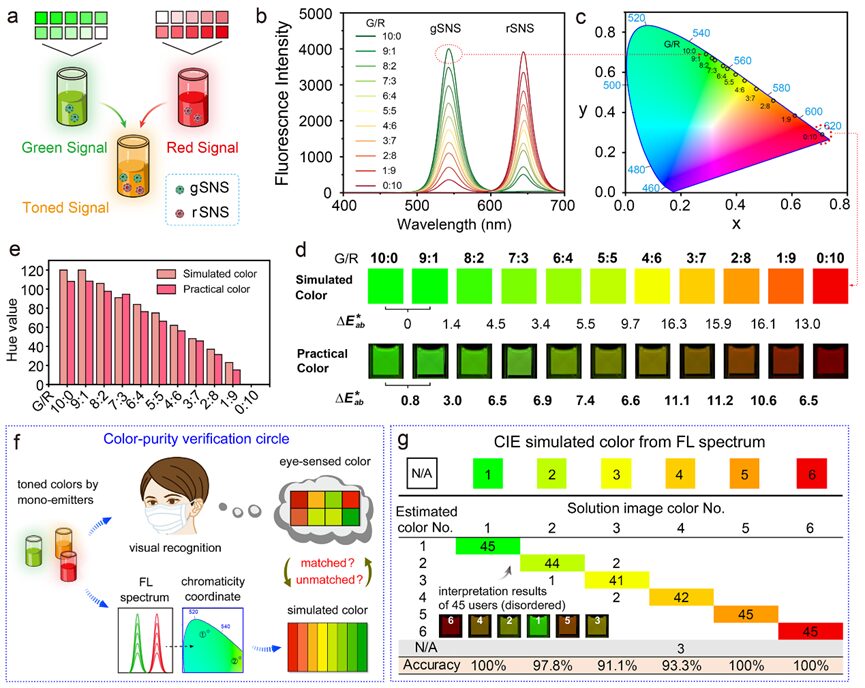 Figure 10. a) Linear fitting curve of T line R/G values with SARS-CoV-2 NP concentrations from 0 to 200 ng/mL. b) Recovery test of SARS-CoV-2 NP in PCR-negative throat swabs (lysed running buffer extraction) using HLFIA test strips. The coefficient of variation (CV) is defined as the standard deviation divided by the mean. Inset: Band images corresponding to repeated tests. c) Images (top) and quantitative results (bottom) of HLFIA test strips for blank, H1N1 influenza virus (Flu A), influenza B virus (Flu B), respiratory syncytial virus (RSV), Mycoplasma pneumoniae (MP), human IgG, α-amylase, and SARS-CoV-2 NP. d) Images of HLFIA test strips for PCR-negative (N1-N10) and PCR-positive (P1-P12) throat swab samples, extracted T line color blocks, and corresponding visual reading results of SARS-CoV-2 infection.
We evaluated the sensitivity, accuracy, and specificity of HLFIA. The limit of detection (LOD) was 0.13 ng/mL (Figure 10a). The concentration of SARS-CoV-2 NP exhibited a plate-linear change between 0.13 to 200 ng/mL. Recovery tests were conducted by adding concentrations of SARS-CoV-2 NP of 1.25, 5, 10, 20, and 50 ng/mL to PCR-negative throat swab samples (Figure 10b). The average recovery rates at each level ranged from 90% to 105%, with coefficients of variation (CV) between 2.18% and 8.72%, indicating good accuracy and acceptable precision of the method. HLFIA demonstrated good specificity for specific detection of SARS-CoV-2 NP against common respiratory pathogen antigens and proteins (Figure 10c), confirming the good specificity of the test strips.
To conduct clinical diagnosis, we utilized HLFIA to detect PCR-negative and PCR-positive throat swab samples. As shown in Figure 10d, the T line exhibited evident color changes to distinguish between negative and positive groups. Specifically, the color regions and their corresponding R/G ratios were categorized into pure green (R/G = 0.8-1.1), yellow-green (R/G = 1.1-1.5), yellow to orange (R/G = 1.5-3.5), and orange-red to red (R/G = 3.5-10.0) regions. The color evolution from green to red provides satisfactory predictions for SARS-CoV-2 undetected, weakly positive, moderately positive, and strongly positive results based on the corresponding laboratory report cycle threshold (Ct) values. The hue-recognizable visual and portable terminal-readable HLFIA platform can assist in home testing for pathogen infection levels in family settings.
In this work, we successfully achieved the integration and phase transfer of narrow-emission semiconductor nanoplatelets through a host-guest assembly and protective dual-layer encapsulation strategy. The geometric matching of plate-like units with dendritic porous templates and the coordinated-driven host-guest assembly under optimized solvent conditions highly retained the color purity and fluorescence brightness of NPLs tags. We demonstrated the application potential of color-tunable narrow-emission water-soluble labels in signal amplification and constructing composite color systems for visual and imaging analysis based on naked-eye/smartphone. By integrating the NPLs-based color tonal recognition mechanism into the immunochromatography platform, we achieved a SARS-CoV-2 NP concentration-dependent color gradient in HLFIA, with higher naked-eye reading accuracy compared to commercial colorimetric LFIA kits. In clinical respiratory sample detection, the green to red color gradient, readable by naked-eye and smartphones, can classify the positivity levels of SARS-CoV-2 infection, showing promising prospects for easy detection of pathogen infection risk levels in home settings.
Semiconductor Nanoplatelets Based Host-Guest Assembly Structure with High Color Purity for Hue-Recognizable Lateral Flow Immunoassay
https://doi.org/10.1002/adfm.202316147

Hu Jun
Ph.D., Professor, Doctoral Supervisor. Engaged in the design and development of new intelligent sensing materials and devices. Selected for the New Century National Talents Project, National Outstanding Young and Middle-aged Experts, enjoys special allowances from the State Council, recognized as a young scientific and technological contributor in the petroleum and chemical industry, Zhejiang Provincial Outstanding Young Scientist Fund, and Zhejiang Provincial Young and Middle-aged Discipline Leaders. Awarded the second prize of the National Science and Technology Progress Award, the second prize of the Zhejiang Provincial Science and Technology Award, and the second prize of the Science and Technology Progress Award of the China Petroleum and Chemical Industry Federation, among others. Related achievements have been published in over 40 academic papers in journals such as Angew. Chem. Int. Ed., Adv. Funct. Mater., J. Mater. Chem. A, Appl. Catal., B, Chem. Commun., Nanoscale, J. Alloys Compd., with over 40 authorized domestic and international invention patents. Scholar profile: https://www.zjut.edu.cn/hj/list.htm

Huang Liang
Ph.D., Associate Researcher, Doctoral Supervisor. Engaged in the controlled synthesis of functional nanoparticles, assembly optimization of metal/semiconductor/oxide nanostructures, achieving integration and synergy of magnetic and optical properties, and conducting research on early screening and rapid detection of disease biomarkers in vitro diagnostics. Undertakes research projects from the National Natural Science Foundation, Zhejiang Provincial Natural Science Foundation, etc. Published over 20 papers as the first or corresponding author in international journals such as Adv. Mater., Angew. Chem. Int. Ed., Adv. Funct. Mater., with over 10 authorized invention patents. Scholar profile: https://homepage.zjut.edu.cn/hl2_7932/

Wang Jing
Ph.D., Professor, Doctoral Supervisor, Leading Young Talent in Zhejiang Province. Engaged in research on biosensing of lateral flow immunochromatography, forming distinctive research features in the fields of life health and food safety rapid testing, systematically conducting basic research on “probe design – recognition principle – instrumentation-free quantification.” Undertakes research projects from the National Natural Science Foundation, Zhejiang Provincial Natural Science Foundation, etc. Published over 40 papers as the first or corresponding author in international journals such as Angew. Chem. Int. Ed., Adv. Mater., Anal. Chem., with 7 authorized invention patents. Scholar profile: https://homepage.zjut.edu.cn/wangjing/
Editor: Wang Yuxi
 Hue-Recognizable Lateral Flow Immunoassay Based on High Color Purity Semiconductor Nanoplatelets


 Figure5. a1-c1) Schematic of NPLs assembly with non-porous silica (a1), small-pore silica (b1), and large-pore silica (c1) templates. a1-c1 correspond to the TEM (left) and SEM (right) images of the templates. a2-c2 correspond to the TEM images of silica-NPL assemblies. a4-c4) Assembly rate images of templates corresponding to a2-c2. Inset: Photos of the supernatant containing excess NPLs (top) and re-dispersed dSi/NPL assemblies (bottom) after assembly and centrifugation, with the added content (defined as the weight ratio of added total NPLs to dSi-SH) being 40%, 80%, 120%, 160%, and 200%.
 Figure6. Trade-off strategy of colloidal dispersibility of dSi-SH and dispersibility/fluorescence of NPLs. a) Schematic of dispersibility and fluorescence states of dSi-SH, NPLs, and dSi/NPL in solvents of different polarities. b) Photos of dSi-SH (top, sunlight), NPL, and dSi/NPL (middle, bottom, UV light) dispersed in a hexane-alcohol mixed solvent. c) Polydispersity index of dSi-SH, NPLs, and dSi/NPL in hexane-alcohol mixed ratios from 0% to 100% of hexanol. d) Corresponding TEM images of NPLs (e1, f1, g1), dSi-SH (e2, f2, g2), and dSi/NPL (e3, f3, g3) in 100% hexane, 30% hexanol-70% hexane, and 100% hexanol.
 Figure 7. Signal amplification verification of SNS as a light label. a1) Schematic of signal enhancement of single SNS-COOH particles relative to single NPL and commercial Eu-PS beads in solution phase. (a2 -a4) Relationship between FL intensity and particle number of NPLs (a2), SNS-COOH (a3), and Eu-PS beads (a4). Inset: Corresponding photos under sunlight and UV light. b1) Schematic of drop-casting test operation mode. Different particle numbers of NPLs (b2), SNS-COOH (b3), and Eu-PS beads (b4) influence FL intensity on NC membranes.
 Figure 8. Verification of color purity of gSNS and rSNS single luminescent units. a) Schematic illustrating the composite colors obtained from continuously mixed gSNS and rSNS solutions. b, c) Fluorescence spectra (b) and spectral corresponding coordinates in the CIE 1931 chromaticity diagram (c) of a series of mixed solutions with green/red (G/R) fluorescence intensity ratios from 10:0 to 0:10. d) Simulated color blocks extracted from coordinates corresponding to the chromaticity diagram (top) and actual mixed solution images under UV light (bottom) showing G/R gradients. Color difference (∆E*ab) calculated using the CIE 94 algorithm. e) Consistency of hue values of simulated colors and actual colors in (d). f) Schematic of verification of color purity of single luminescent units in synthetic colors. g) Visual reading results of 45 independent testers referring to the corresponding simulated color blocks in six solution color gradients.
 Figure 10. a) Linear fitting curve of T line R/G values with SARS-CoV-2 NP concentrations from 0 to 200 ng/mL. b) Recovery test of SARS-CoV-2 NP in PCR-negative throat swabs (lysed running buffer extraction) using HLFIA test strips. The coefficient of variation (CV) is defined as the standard deviation divided by the mean. Inset: Band images corresponding to repeated tests. c) Images (top) and quantitative results (bottom) of HLFIA test strips for blank, H1N1 influenza virus (Flu A), influenza B virus (Flu B), respiratory syncytial virus (RSV), Mycoplasma pneumoniae (MP), human IgG, α-amylase, and SARS-CoV-2 NP. d) Images of HLFIA test strips for PCR-negative (N1-N10) and PCR-positive (P1-P12) throat swab samples, extracted T line color blocks, and corresponding visual reading results of SARS-CoV-2 infection.

