1. GDB Deployment
Establishing GDB Debugging Connection:
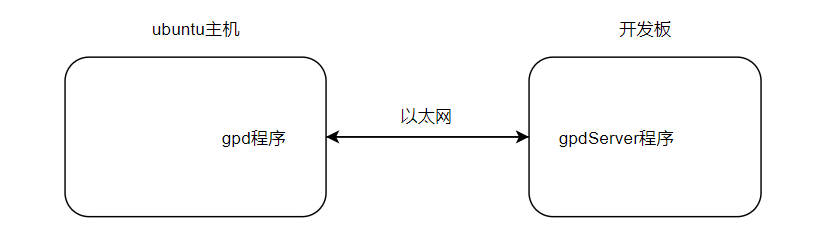
1. Start GDB on the host, and start the server gdbserver on the target board.
2. Ensure that the compiled options for the program being debugged include the -g option to add debugging information, and that the debugging programs on both the host and target board are consistent.
3. Run on the development board: “gdbserver
4. Run gdb on the Ubuntu host: “arm-none-linux-gdb
2. Common GDB Commands
-
gdb <program> starts GDB and loads the specified executable file. -
run (or r) starts the execution of the program. It can take parameters, e.g., run arg1 arg2. -
break <location> (or b <location>) sets a breakpoint at the specified location. The location can be a line number, function name, or filename+line number, e.g., break main or b 25. -
continue (or c) continues execution from the current breakpoint until the next breakpoint or program end. -
step (or s) executes the program step by step, entering functions. -
next (or n) executes the program step by step but does not enter functions, directly executing to the next line. -
finish continues executing the current function until it returns and displays the return value. -
print <expression> (or p <expression>) prints the value of the specified expression. For example, print x will display the current value of variable x. -
display <expression> automatically displays the value of the specified expression every time the program stops. It can be used to monitor variable changes. -
backtrace (or bt) displays information about the current call stack, helping analyze the program’s execution path. -
list (or l) displays the lines of code near the current execution source code location. -
watch <expression> sets a watchpoint that pauses the program when the value of the expression changes. -
info breakpoints displays information about all currently set breakpoints. -
delete <breakpoint_number> deletes the specified breakpoint. For example, delete 1 will delete the breakpoint numbered 1. -
quit (or q)
exits GDB.
3. Important Debugging Commands
1. aw (Access Watchpoint)
-
Command: aw <location>
-
Usage: Sets an access watchpoint that stops the program when it reads or writes to the specified memory location.
-
Parameters:
-
<location>: Can be a variable name, memory address, or expression, e.g., aw myVar or aw *0x12345678.
-
Example:
aw myVariableThis will stop the program when myVariable is read or modified.
2. rw (Read Watchpoint)
-
Command: rw <location>
-
Usage: Sets a read-only watchpoint that stops the program when it attempts to read the specified memory location. If the location is written to, it will not trigger a stop.
-
Parameters:
-
<location>: Can be a variable name, memory address, or expression, e.g., rw myVar or rw *0x12345678.
-
Example:
rw myVariableThis will stop the program when myVariable is read, but it will not stop when it is modified.
3. The until command is used to continue executing the program until the current stack frame returns or reaches a specific line of source code. This is often used in debugging to quickly skip over unrelated code blocks and run directly to the next important code location.
Usage of the until Command:
-
Command: until [location]
-
Syntax:
-
until: Without parameters, it will execute until the current function returns.
-
until <location>: A source code location (line number) or address can be specified, and the program will continue executing until it reaches that location.

END
Source: Embedded Intelligence Bureau
Copyright belongs to the original author. If there is any infringement, please contact for deletion..
▍Recommended Reading
KEIL MDK v6 Price Announced……
Chinese Can Also Invent Reliable Programming Languages!
C/C++ Deadline Approaches, USA Demands Complete Removal by 2026!