Total Phosphorus Monitoring Control: Siemens PLC Solution Design and Implementation
The total phosphorus monitoring control system has significant application value in the environmental protection field. It achieves precise monitoring, intelligent processing, and timely regulation through PLC, effectively ensuring that water quality meets discharge standards.
Hardware Configuration
PLC and Expansion Module Selection
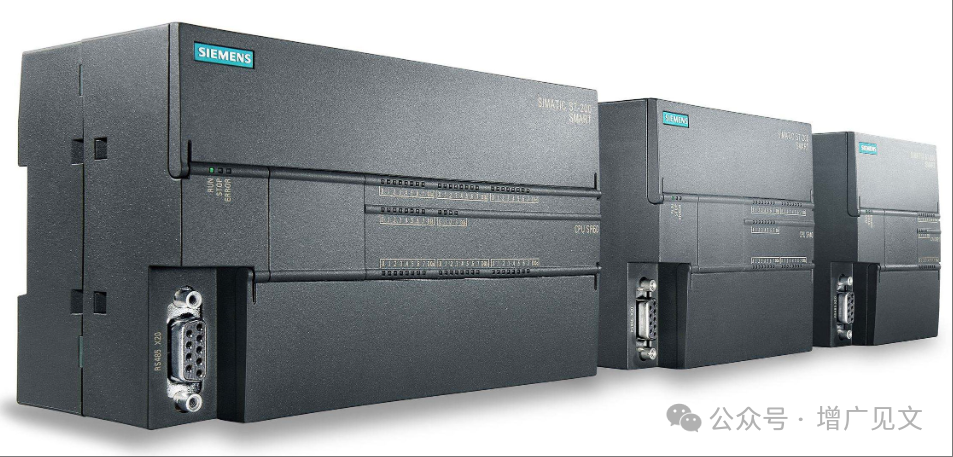
For the total phosphorus monitoring control application, it is recommended to use the SIMATIC S7-1200 series PLC as the core controller, specifically the CPU 1215C model. This model features 14 digital inputs, 10 digital outputs, and 2 analog inputs/outputs, meeting basic control requirements. Considering the need for multi-channel analog signal acquisition for total phosphorus monitoring, the following expansion modules are suggested:
SM 1231 AI 8×13bit Analog Input Module: Used to connect total phosphorus analyzers, flow meters, level gauges, and other sensing devices.
SM 1232 AQ 4×14bit Analog Output Module: Used to control dosing pumps, regulating valves, and other actuators.
CM 1241 RS485 Communication Module: Used for communication with total phosphorus analyzers, touch screens, and other devices.
I/O Point Allocation Table
Address Function Description Signal Type
I0.0 System Run Button Digital Input
I0.1 System Stop Button Digital Input
I0.2 Auto/Manual Switch Digital Input
I0.3 Total Phosphorus Analyzer Fault Signal Digital Input
I0.4 Dosing Pump Run Feedback Digital Input
I0.5 Upper Level Alarm Digital Input
I0.6 Lower Level Alarm Digital Input
I0.7 Emergency Stop Digital Input
Q0.0 Dosing Pump Start/Stop Digital Output
Q0.1 Stirrer Start/Stop Digital Output
Q0.2 Total Phosphorus Exceeding Alarm Digital Output
Q0.3 System Run Indicator Digital Output
IW64 Total Phosphorus Concentration Signal Analog Input
IW66 Influent Flow Rate Signal Analog Input
IW68 Reagent Tank Level Signal Analog Input
QW64 Dosing Pump Frequency Control Analog Output
Control Program Design
Variable Definition Specification
In the total phosphorus monitoring control system, variable naming should be clear and understandable for maintenance. The following naming conventions are adopted:
Digital Input: DI_[Function Description], e.g., DI_SysStart
Digital Output: DO_[Function Description], e.g., DO_DosePump
Analog Input: AI_[Function Description], e.g., AI_Phosphorus
Analog Output: AO_[Function Description], e.g., AO_PumpFreq
Timer: T_[Function Description], e.g., T_SampleDelay
Counter: C_[Function Description], e.g., C_AlarmCount
Data Block: DB_[Function Description], e.g., DB_PhosParam
Program Architecture Design
The program architecture of the total phosphorus monitoring control system is divided into the following levels:
OB1: Main program loop, responsible for calling various function blocks and processing overall logic.
FB1: Total phosphorus data acquisition and processing function block.
FB2: Dosing control function block.
FB3: Alarm management function block.
FB4: Human-machine interface interaction function block.
DB1: System parameter data block.
DB2: Operating status data block.
DB3: Historical data record data block.
The program execution flow is as follows:
System initialization, loading parameters.
Reading total phosphorus analyzer data.
Calculating the required dosing amount based on monitoring values.
Controlling the dosing pump operation.
Monitoring system status and handling exceptions.
Data recording and display.
Function Block Design
Below is a detailed design example of the total phosphorus data processing function block (FB1):
FUNCTION_BLOCK “TotalPhosphorus_Process”
{ S7_Optimized_Access := ‘TRUE’ }
VERSION : 0.1
VAR_INPUT
rawValue : Real; // Total phosphorus analyzer raw signal
flowRate : Real; // Water flow rate
sampleEnable : Bool; // Sampling enable
END_VAR
VAR_OUTPUT
phosphorusValue : Real; // Corrected total phosphorus value
alarmHigh : Bool; // High concentration alarm
alarmSensor : Bool; // Sensor fault alarm
END_VAR
VAR
lastValue : Real; // Last sampling value
sampleCount : Int; // Sampling count
sumValue : Real; // Sampling accumulation value
avgValue : Real; // Average value
END_VAR
VAR_TEMP
tempValue : Real; // Temporary calculation value
END_VAR
BEGIN
// Sensor fault detection
IF rawValue < 0.0 OR rawValue > 10.0 THEN
alarmSensor := TRUE;
phosphorusValue := lastValue; // Use last valid value
RETURN;
ELSE
alarmSensor := FALSE;
END_IF;
// Signal filtering processing
tempValue := rawValue * “DB_PhosParam”.scaleFactor;
// Sampling average value calculation
IF sampleEnable THEN
sumValue := sumValue + tempValue;
sampleCount := sampleCount + 1;
IF sampleCount >= “DB_PhosParam”.avgSampleCount THEN
avgValue := sumValue / INT_TO_REAL(sampleCount);
sumValue := 0.0;
sampleCount := 0;
phosphorusValue := avgValue;
lastValue := avgValue;
END_IF;
END_IF;
// High concentration alarm judgment
IF phosphorusValue > “DB_PhosParam”.highLimit THEN
alarmHigh := TRUE;
ELSIF phosphorusValue < “DB_PhosParam”.highLimit – “DB_PhosParam”.hysteresis THEN
alarmHigh := FALSE;
END_IF;
END_FUNCTION_BLOCK
Status Control Design
The status control of the total phosphorus monitoring control system adopts a state machine design pattern, defining the following states:
IDLE: System idle state
INIT: System initialization state
RUNNING: System normal operation state
MANUAL: Manual control state
ALARM: Alarm state
ERROR: Error state
The state transition logic is as follows:
After power-on, enter INIT state, and after initialization, transition to IDLE state.
In IDLE state, pressing the start button transitions to RUNNING state.
In RUNNING state, it can switch to MANUAL state for manual control.
In any state, if an alarm condition is detected, transition to ALARM state.
In case of a serious fault, transition to ERROR state, requiring manual reset.
Data Management and Storage
Parameter Configuration Table
The key parameters of the total phosphorus monitoring control system are stored in the DB1 data block, as follows:
DATA_BLOCK “DB_PhosParam”
{ S7_Optimized_Access := ‘TRUE’ }
VERSION : 0.1
NON_RETAIN
VAR
highLimit : Real := 0.5; // Total phosphorus high limit alarm value (mg/L)
hysteresis : Real := 0.05; // Hysteresis value (mg/L)
scaleFactor : Real := 1.0; // Scale factor
avgSampleCount : Int := 10; // Average sampling count
sampleInterval : Time := T#30S; // Sampling interval
controlMode : Int := 0; // Control mode (0: automatic, 1: manual)
doseRatio : Real := 2.5; // Dosing ratio coefficient
maxDoseRate : Real := 100.0; // Maximum dosing amount (L/h)
minDoseRate : Real := 0.0; // Minimum dosing amount (L/h)
END_VAR
BEGIN
highLimit := 0.5;
hysteresis := 0.05;
scaleFactor := 1.0;
avgSampleCount := 10;
sampleInterval := T#30S;
controlMode := 0;
doseRatio := 2.5;
maxDoseRate := 100.0;
minDoseRate := 0.0;
END_DATA_BLOCK
Operational Data Recording
The system operational data is recorded in the DB3 data block, using a circular buffer design to record the most recent 24 hours of total phosphorus monitoring data, with one record per hour. The data structure is as follows:
DATA_BLOCK “DB_HistoryData”
{ S7_Optimized_Access := ‘TRUE’ }
VERSION : 0.1
NON_RETAIN
STRUCT
header : Struct
recordCount : Int := 0; // Total number of records
currentIndex : Int := 0; // Current index
lastSaveTime : DTL; // Last save time
END_STRUCT;
records : Array[0..23] of Struct
timestamp : DTL; // Timestamp
phosphorusValue : Real; // Total phosphorus value
flowRate : Real; // Flow rate
doseRate : Real; // Dosing amount
alarmStatus : Word; // Alarm status
END_STRUCT;
END_STRUCT;
BEGIN
END_DATA_BLOCK
Interface Design
Interface Layout Description
The HMI interface of the total phosphorus monitoring control system is implemented using the KTP700 Basic touch screen. The interface layout includes the following screens:
Main Screen: Displays system operating status, total phosphorus concentration, flow rate, and other key parameters, providing operation buttons for system start/stop and mode switching.
Parameter Setting Screen: Provides a system parameter configuration interface, including alarm thresholds, control parameters, and other settings.
Trend Curve Screen: Displays historical trend curves of total phosphorus concentration, flow rate, dosing amount, and other parameters.
Alarm Screen: Displays a list of system alarm information, providing alarm confirmation functionality.
Maintenance Screen: Provides system maintenance functions, including manual control, calibration, and other operations.
Parameter Setting Instructions
The parameter setting screen includes the following main content:
Monitoring Parameter Settings: Total phosphorus high limit alarm value, sampling interval, average sampling count, etc.
Control Parameter Settings: Dosing ratio coefficient, maximum/minimum dosing amount, etc.
System Parameter Settings: Communication parameters, time settings, etc.
User Management: Operation permission settings, including operator and administrator levels.
Parameter settings adopt hierarchical permission control, where ordinary operators can only view parameters, while administrators can modify parameters. Modifying parameters requires password confirmation to ensure system security.
Conclusion
The Siemens PLC achieves precise monitoring, intelligent control, and data management functions in the total phosphorus monitoring control system. For any questions or experience sharing, feel free to discuss.