If you find it useful, please leave a comment Learned a lot.
If you’re already familiar, please leave a comment Is that all?
Possible Issues
Industrial IoT systems are generally divided into ERP, Mes, SCADA, WCS, edge gateways, devices, etc.
A production order sent from SAP to the device goes through several systems mentioned above. When an issue arises, it may require various teams to collaboratively troubleshoot. The traditional approach is to sift through log files from each system, which is undoubtedly inefficient.
APM systems can help you identify issues and locate bottlenecks across the entire system.
Application Performance Monitoring
APM (Application Performance Monitor) is used to monitor your software’s performance and behavior. It typically includes:
-
Metrics
Such as CPU, memory, disk I/O, network I/O, etc.
-
Logs
Different levels of logs output by the program, such as Debug, Info, Error, etc.
-
Traces
Includes the call chain of each sub-operation in a request, start and end times, parameters passed, database operations, etc.
OpenTelemetry
OpenTelemetry is a platform-agnostic and vendor-agnostic protocol standard launched by Google and Microsoft, enabling developers to easily add or switch the underlying APM implementations. We can use its data collection middleware:
Generate and collect data (Metrics, Logs, and Traces)
Push data to Jaeger (or Zipkin, SkyWalking, etc.)
Supports 11 languages (platforms) including .Net, C++, Go, Java, JS, Python, etc.
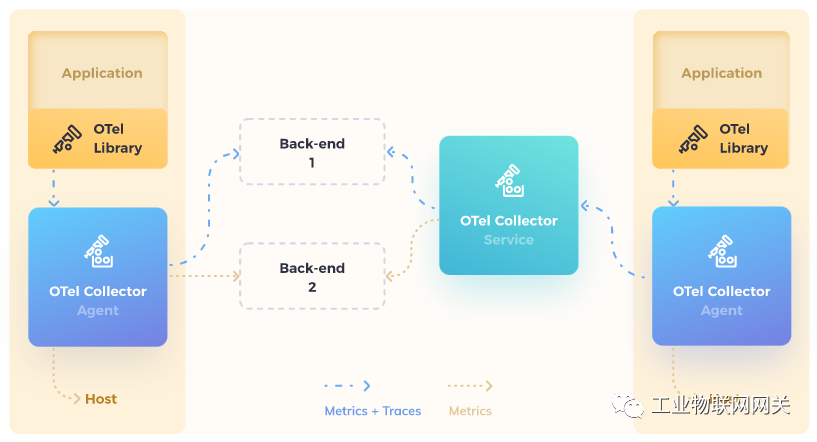
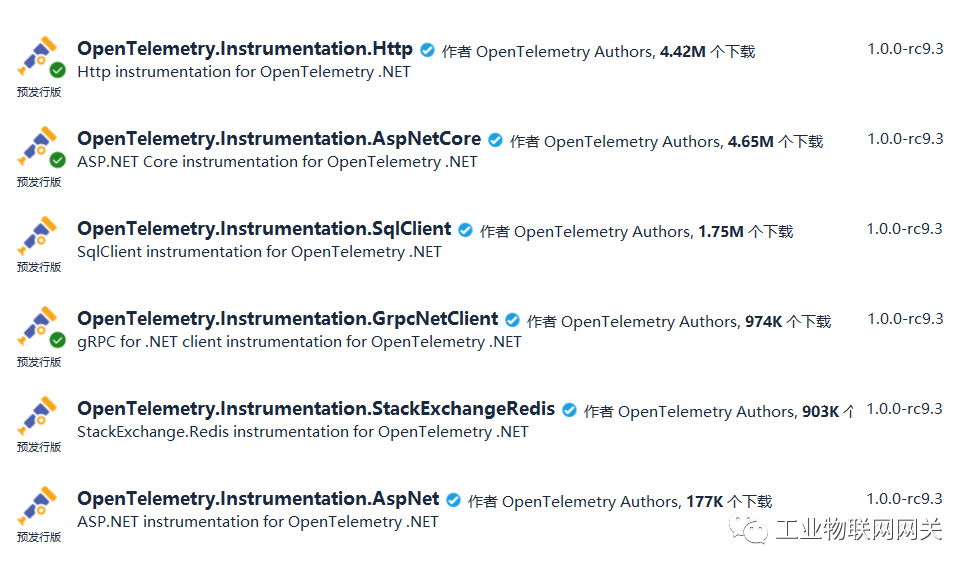
Can collect diagnostic data from .Net projects such as AspNetCore, Http, EFCore, HttpClient, Grpc, etc.
Official code snippet
// Define some important constants and the activity source
var serviceName = "MyCompany.MyProduct.MyService";
var serviceVersion = "1.0.0";
var builder = WebApplication.CreateBuilder(args);
// Configure important OpenTelemetry settings, the console exporter, and automatic instrumentation
builder.Services.AddOpenTelemetryTracing(b =>
{
    b
    .AddConsoleExporter()
    .AddSource(serviceName)
    .SetResourceBuilder(
        ResourceBuilder.CreateDefault()
            .AddService(serviceName: serviceName, serviceVersion: serviceVersion))
    .AddHttpClientInstrumentation()
    .AddAspNetCoreInstrumentation();
});
var app = builder.Build();
var httpClient = new HttpClient();
app.MapGet("/hello", async () =>
{
    var html = await httpClient.GetStringAsync("https://example.com/");
    if (string.IsNullOrWhiteSpace(html))
        return "Hello, World!";
    else
        return "Hello, World!";
});

app.Run();
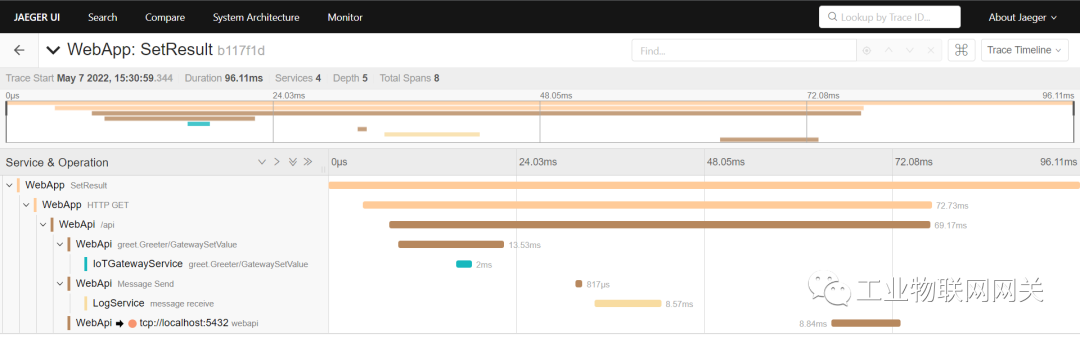
Jaeger
Jaeger is an open-source distributed tracing system, and OpenTelemetry can import the collected data into it for storage and querying.
Seq
The project uses Seq as the logging platform; it is lightweight and .Net-friendly, supports SQL queries and chart displays, and you can also use Nlog+Elasticsearch+Kibana.
Project Directory
.
├──WebApp //webapp
├──WebApi //webapi
├──IoTGatewayService //simulated gateway
├──Device //simulated device
└──LogService //log consumption service
Project Introduction
| Project | Project Type | Function | Description |
|---|---|---|---|
| Device | Console | Simulates Modbus-TCP devices | Logs output when the set temperature changes |
| IoTGatewayService | Grpc Service | Simulates a gateway for data collection | Exposes a Grpc interface to set temperature using Modbus protocol to send temperature to the device |
| WebApi | WebApi | Provides temperature setting API | Receives user-input temperature, uses Grpc to call the gateway service, logs the operation to the database, and sends the operation log to RabbitMq |
| WebApp | Web Application | User access | Receives user-input temperature, calls WebApi to display results |
| LogService | Worker Service | Background service | Consumes RabbitMq log messages |
Startup Method
-
Use docker-compose to run Jaeger, RabbitMQ, Postgres, and Seq
docker-compose up -d
-
Visual Studio starts multiple projects 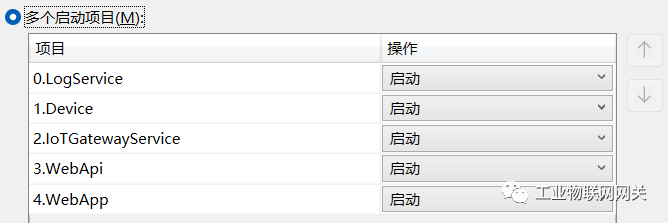
-
Access the web, input the set temperature, and press enter to confirm 
-
Access Jaeger, view link tracing 
-
Access Seq, view logs 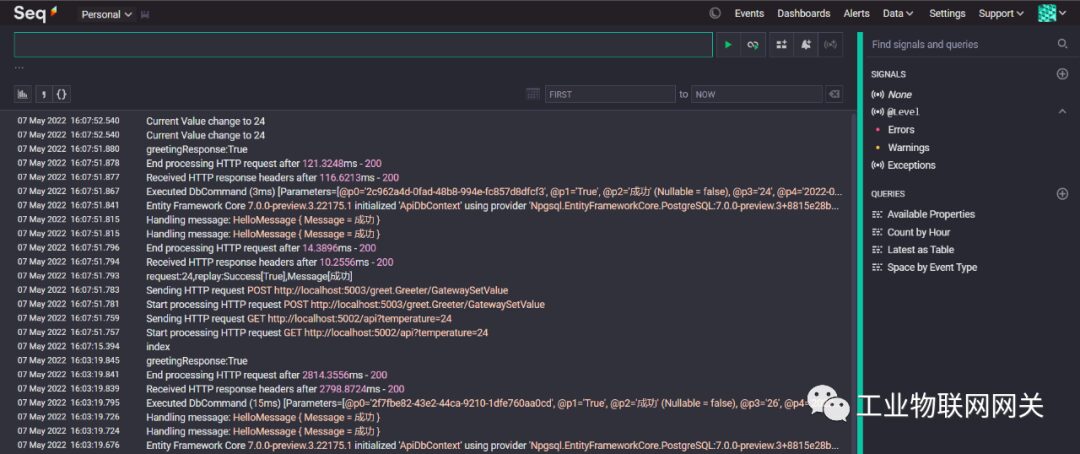
Sampling Rate
In the later stages of the project, you can use filters or reduce the sampling rate to minimize the impact of data collection on system performance
Related Links
[1] OpenTelemetry:https://opentelemetry.io/docs/instrumentation/net/
[2] Jaeger:https://www.jaegertracing.io/
[3] Seq:https://datalust.co/seq
[4] Source Code:https://github.com/iioter/ExploringIoTDistributedTracingNet6
[5] IoTGateway:https://github.com/iioter/iotgateway
[6] OpenTelemetry – A New Standard for Observability in Cloud Native
Please follow
Industrial IoT Gateway