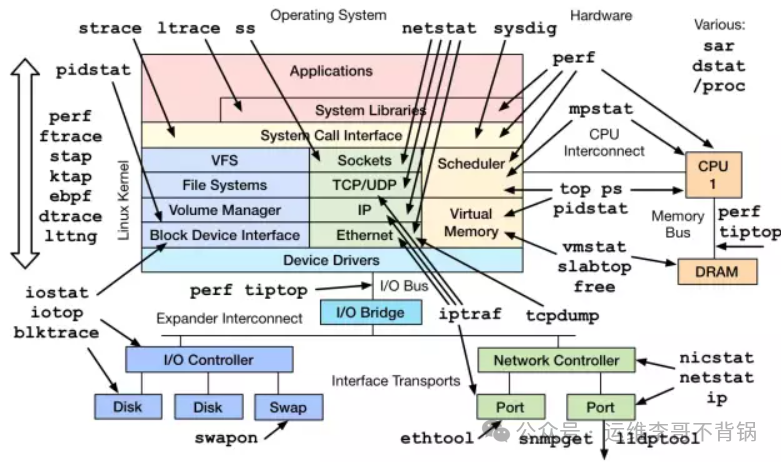
Image source: Internet
In Linux systems, there are many performance monitoring tools. Below, I will introduce several commonly used command-line tools.
1. top/htop
top:
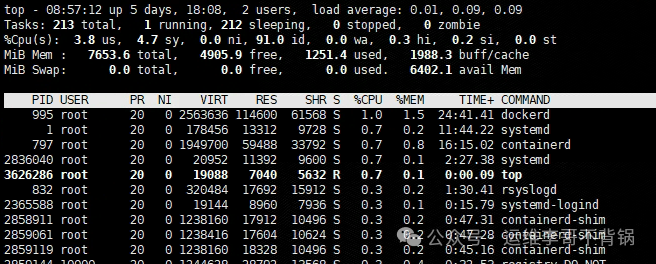
Function: Real-time monitoring of processes, displaying information about CPU, memory, load, swap space, etc.
Common Shortcuts:
| Shortcut | Description |
|---|---|
| M | Sort by memory usage |
| P | Sort by CPU usage |
| k | Kill a process, enter the process ID |
| q | Exit |
htop

Function: An enhanced version of top, providing a more user-friendly interface and interactivity.
Features: Supports selecting processes with arrow keys and allows direct killing and viewing of process trees. The display interface will have prompt keys.
Minimal installations require manual installation of htop.
yum install -y htop
2. vmstat
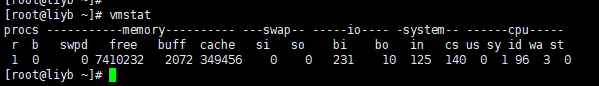
Function: Monitor system memory, processes, CPU, and I/O, etc.
Output Fields:
| Field | Description |
|---|---|
| r | Number of processes waiting for CPU in the run queue (Runnable) |
| b | Number of processes in a blocked state (Blocked) |
| swpd | Used virtual memory |
| free | Free memory |
| buff | Memory used as a buffer |
| cache | Memory used as page cache |
| si | Memory read from swap space |
| so | Amount of memory written to swap space |
| bi | Blocks read per second from block devices (e.g., disk) |
| bo | Blocks written per second to block devices |
| in | Number of interrupts per second |
| cs | Number of context switches per second |
| us | Percentage of CPU time spent in user space (User) |
| sy | Percentage of CPU time spent in kernel space (System) |
| id | Percentage of CPU time that is idle (Idle) |
| wa | Percentage of CPU time waiting for I/O (Wait) |
| st | Percentage of CPU time stolen by virtual machines (Stolen) |
Common Operations:
Update every 1 second, output 5 times.
vmstat 1 5
3. iostat
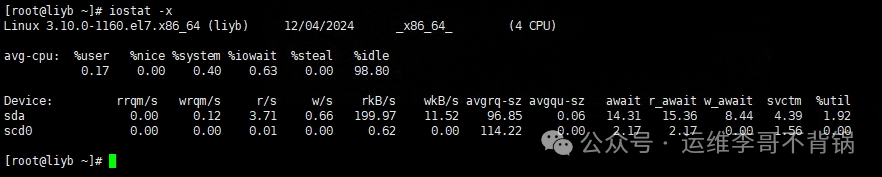
Function: Helps users analyze disk read/write performance, monitor device I/O activity, and understand the overall system load.
Syntax format:
iostat [options] [update interval count]
Common Options:
| Option | Description |
|---|---|
| -c | Show CPU usage |
| -d | Display statistics for disk devices |
| -x | Display extended disk statistics |
| -p | Display statistics for each partition |
| -h | Use more user-friendly units |
Main Output Fields:
| Output Field | Description |
|---|---|
| %user | Percentage of CPU consumed by user processes |
| %system | Percentage of CPU consumed by system processes |
| %iowait | Percentage of CPU time waiting for I/O |
| %idle | Percentage of CPU time that is idle (Idle) |
| tps | Number of I/O operations per second |
| kB_read/s | KB read per second |
| kB_wrtn/s | KB written per second |
| kB_read | Total KB read since system startup |
| kB_wrtn | Total KB written since system startup |
Extended output using -x option:
| Output Content | Description |
|---|---|
| r_await | Average wait time for each read operation (ms) |
| w_await | Average wait time for each write operation (ms) |
| await | Average wait time for all I/O operations (read/write) (ms) |
| svctm | Average service time for each I/O operation (ms) |
| %util | Disk utilization |
Common Operations:
Update every 1 second, output 5 statistics.
iostat -x 1 5
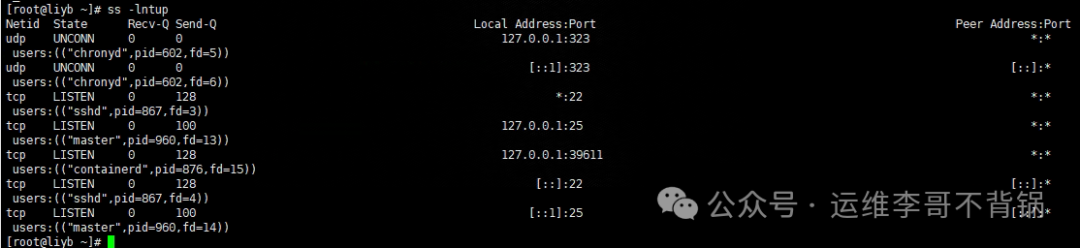
4. netstat/ss
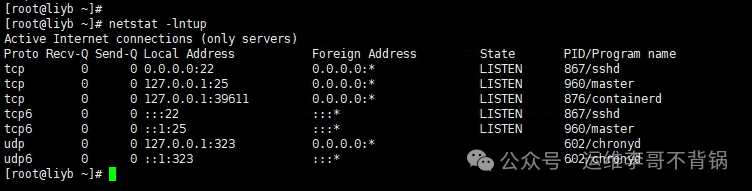
Function: View network connections, listening ports, routing information, etc.
The netstat and ss commands have basically the same functionality.
Common Options:
| Option | Description |
|---|---|
| -a | Display all connections and listening ports |
| -t | Display TCP protocol connections |
| -u | Display UDP protocol connections |
| -l | Display listening sockets |
| -p | Show which process is using the connection |
| -n | Display addresses and port numbers in numeric format (by default, hostnames and service names are displayed). |
| -r | Display the routing table |
Common Operations: Display listening ports and the processes using those ports.
netstat -lntup
ss -lnupt
The ss command can also quickly view network connections and is usually more efficient than netstat.
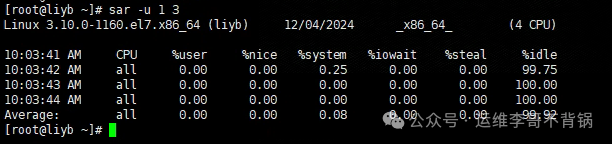
5. sar
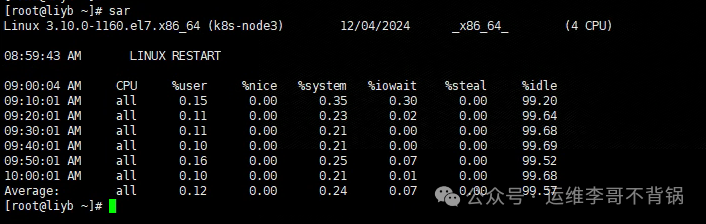
Function: Helps users monitor system status and generate detailed reports on CPU usage, memory, I/O, network, file systems, etc.
sar is part of the sysstat package and needs to be installed separately. By default, sar does not continuously collect data and needs to start sysstat.
yum install sysstat
systemctl enable --now sysstat
Common Operations:
Report CPU usage once per second, three times.
sar -u 1 3
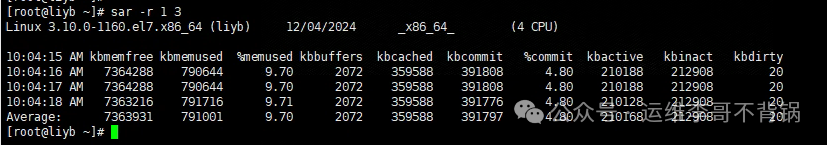
Report memory usage once per second, three times.
sar -r 1 3
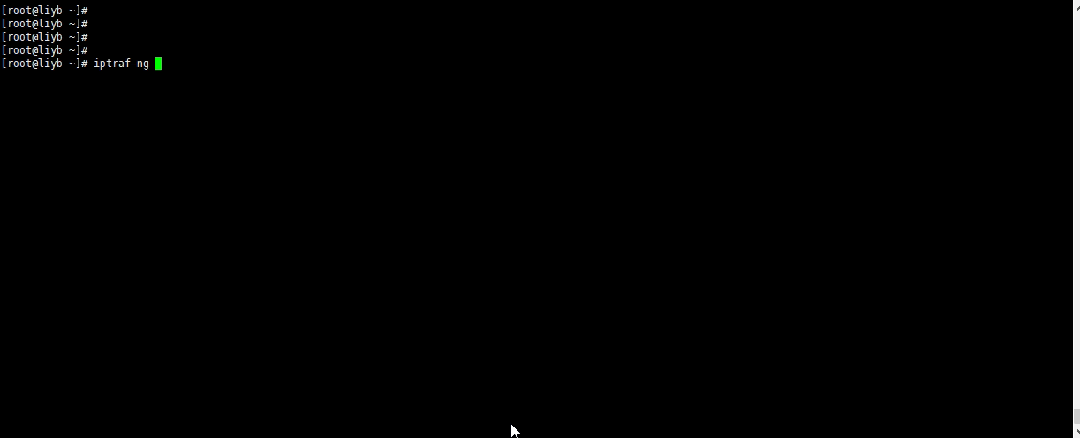
6. iptraf
iptraf is a terminal-based interactive network monitoring tool, mainly used for real-time monitoring and analysis of network traffic on Linux systems. It provides detailed statistics on network interfaces, connection status, packet counts, transmission rates, etc., and is commonly used for network performance tuning and troubleshooting. iptraf can help system administrators quickly identify network bottlenecks, connection issues, and traffic anomalies.
Installation:
yum install iptraf
Usage:
iptraf-ng
Most of the output fields involved should be quite familiar, so I won’t elaborate further.
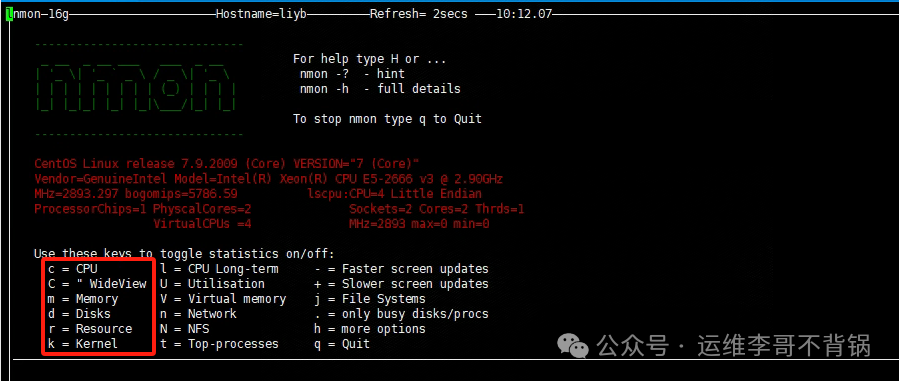
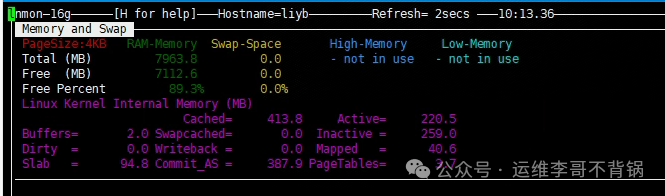
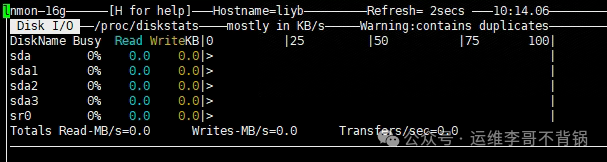
7. nmon
Function: A graphical monitoring tool that supports multiple performance metrics.
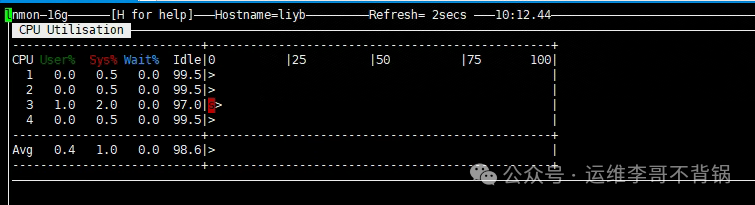
Usage: Start nmon, press c to view CPU, press m to view memory, press d to view disk.
 Press c to view CPU
 Press m to view memory
 Press d to view disk
8. strace
Function: Trace system calls to help debug programs.
Installation:
yum install strace
Use strace -p
First, find the corresponding PID using netstat or top commands, and then trace it.
If you need technical support or want to join the discussion group, please add WeChat: lige_linux
Previous Exciting Articles:
K8S Command Detailed Summary [Personal Collection]| K8S Cluster Deployment | K8S Storage Practical Case |K8S Certificate Renewal for Ten Years | K8S Deployment of Prometheus | Rancher Deployment and Management of K8S |Jenkins Installation and Deployment | Gitlab Installation and Deployment | Service Mesh Istio Installation and Practice |Building an Enterprise-Level Harbor Repository | K8S Integration with Harbor Repository | Common Docker Commands Summary |Solutions for Docker Image Download Issues | Three Methods to Install Docker | Summary of Basic Docker Concepts |Oracle 19C RAC Cluster Setup | Oracle Cluster Management Command Summary | MySQL Cluster Installation and Deployment |MySQL One-Click Backup Script | MySQL Cluster Directory Migration | Redis Three Masters and Three Slaves Cluster Deployment |150 Common Linux Commands | Eight Interesting Linux Commands | Summary of Network Card Configuration Methods for Mainstream Linux Operating System Versions, Recommended for Collection! |Detailed Explanation of Firewalld Firewall | Building an Internal Yum Source | Comprehensive Disk Expansion Methods | Out-of-Band Management Knowledge for Servers