
Drawing a Topographic Map of the Southwest Region Using Python

Author: The Eighth Galaxy – Xinyue
Email: [email protected]
Terrain data is pre-selected based on the latitude and longitude range,
[Using CDO selection:
cdo sellonlatbox,97,112.5,20,30 input.nc xinan.nc]
Add the terrain data xinan.nc to the Southwest region map.

Code:
import pandas as pd
import numpy as np
import cartopy.crs as ccrs
from cartopy.mpl.ticker import LongitudeFormatter, LatitudeFormatter
import matplotlib.pyplot as plt
from cartopy.io.shapereader import Reader
import cartopy.feature as cfeature
from netCDF4 import Dataset
from matplotlib.colors import LinearSegmentedColormap
from matplotlib.path import Path
from matplotlib.patches import PathPatch
import shapefile

# Custom color bar
def create_cmap():
    colors = ['#006837','#31a354', '#78c679', '#addd8e', '#d9f0a3', '#f7fcb9',
              '#c9bc87', '#a69165', '#856b49', '#664830', '#ad9591', '#d7ccca']
    return LinearSegmentedColormap.from_list("elevation_cmap", colors)

# Read terrain data
terrain_data = Dataset(r"E:\1xinan_data\xinan.nc")
z = terrain_data.variables['z'][:]  # Terrain height variable
lat_terrain = terrain_data.variables['lat'][:]
lon_terrain = terrain_data.variables['lon'][:]

# Read Southwest region boundary
sf = shapefile.Reader('D:/xinandata/XI_NAN/xinan.shp')
shapes = sf.shapes()
shap = Reader('D:/xinandata/XI_NAN/xinan.shp').geometries()
xinan = cfeature.ShapelyFeature(shap, crs=ccrs.PlateCarree(), edgecolor='k', facecolor='none')

# Create figure
fig = plt.figure(figsize=(12, 8), dpi=300)
ax = fig.add_subplot(111, projection=ccrs.PlateCarree())

# Set map extent
ax.set_extent([97, 112.5, 20, 35], crs=ccrs.PlateCarree())

# Set height color bar range [50, 5000]
vmin, vmax = 50, 5000

# Draw terrain contour lines
elev_cmap = create_cmap()
contour = ax.contourf(lon_terrain, lat_terrain, z,
                      levels=np.linspace(vmin, vmax, 20),  # Set 20 levels
                      cmap=elev_cmap,
                      vmin=vmin, vmax=vmax,  # Set display range
                      transform=ccrs.PlateCarree(),
                      extend='both')  # Show colors beyond range

# Add color bar
cbar = plt.colorbar(contour, ax=ax, orientation='vertical', pad=0.05, shrink=0.7)
cbar.set_label('Elevation (m)', fontsize=12)
cbar.ax.tick_params(labelsize=10)

# Add Southwest region boundary
ax.add_feature(xinan, linewidth=1.5, zorder=10)

# Set axis
lon_formatter = LongitudeFormatter()
lat_formatter = LatitudeFormatter()
ax.set_xticks([100, 105, 110], crs=ccrs.PlateCarree())
ax.set_yticks([20, 25, 30, 35], crs=ccrs.PlateCarree())
ax.xaxis.set_major_formatter(lon_formatter)
ax.yaxis.set_major_formatter(lat_formatter)
ax.gridlines(draw_labels=False, linewidth=0.5, color='gray', alpha=0.5, linestyle='--')

# Add geographical features
ax.add_feature(cfeature.COASTLINE.with_scale('50m'), linewidth=0.5)
ax.add_feature(cfeature.RIVERS.with_scale('50m'), linewidth=0.5, edgecolor='blue')
ax.add_feature(cfeature.LAKES.with_scale('50m'), linewidth=0.5, edgecolor='blue', facecolor='lightblue')

# Add legend and title
ax.legend(loc='upper right', fontsize=10)
ax.set_title('Topographic map of SWC', fontsize=14, pad=20)
plt.tight_layout()
plt.show()

# Close NetCDF file
terrain_data.close()
Reference Image:
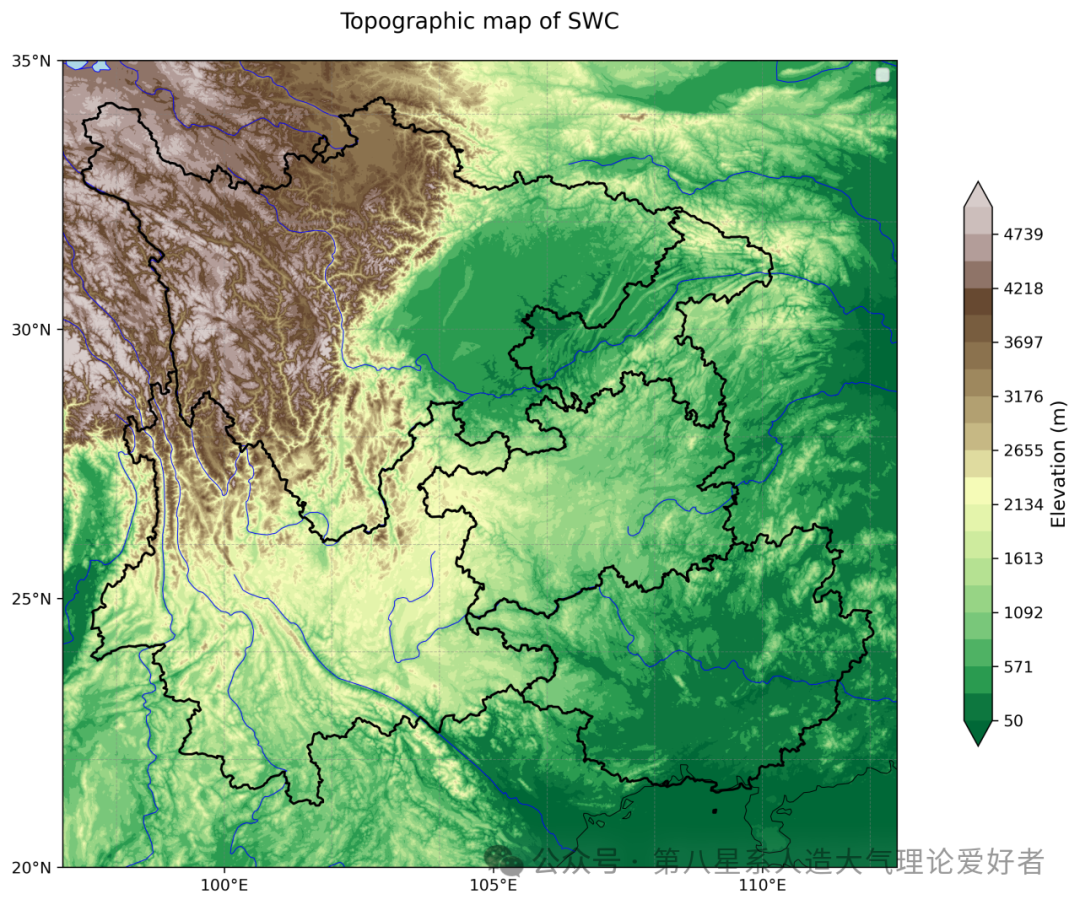
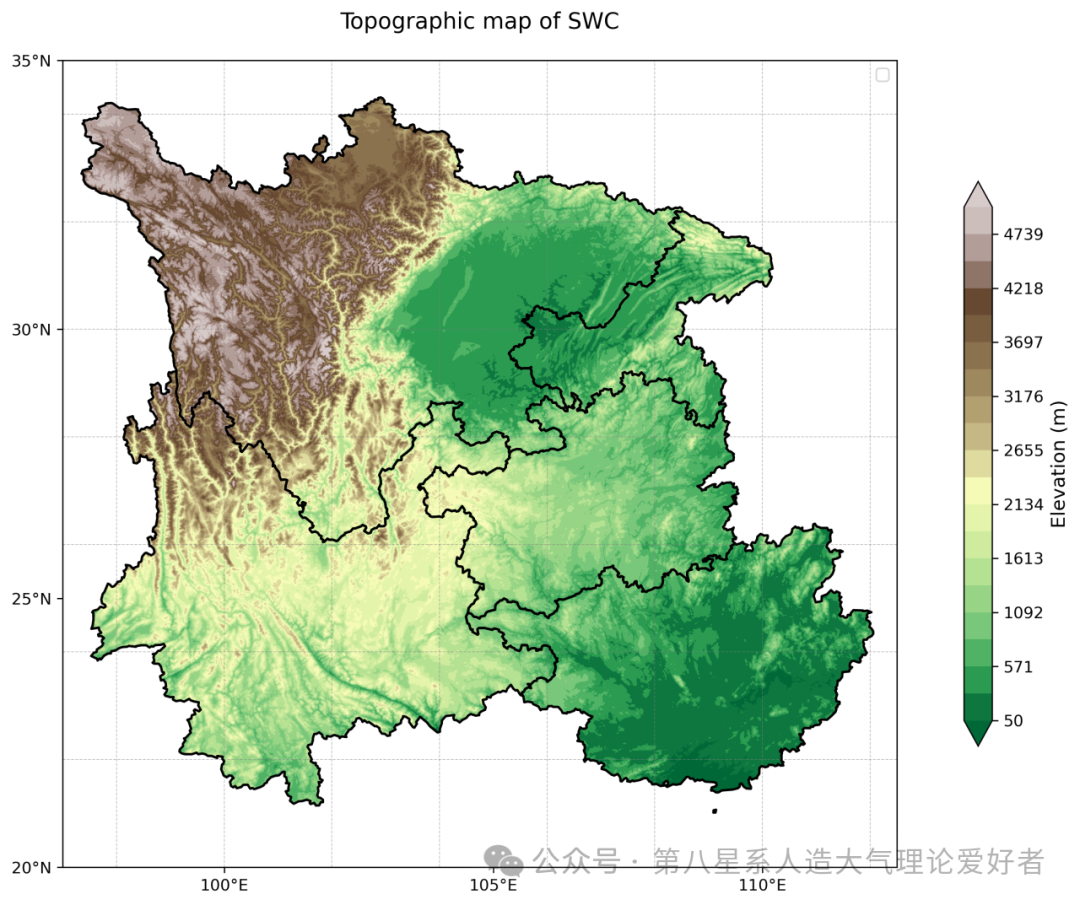
Further masking of the topographic map, cropping terrain data outside the Southwest region boundary.
Code:
import pandas as pd
import numpy as np
import cartopy.crs as ccrs
from cartopy.mpl.ticker import LongitudeFormatter, LatitudeFormatter
import matplotlib.pyplot as plt
from cartopy.io.shapereader import Reader
import cartopy.feature as cfeature
from netCDF4 import Dataset
from matplotlib.colors import LinearSegmentedColormap
from matplotlib.path import Path
from matplotlib.patches import PathPatch
import shapefile
from shapely.geometry import Point, Polygon, MultiPolygon
from shapely.prepared import prep

# Custom color bar
def create_cmap():
    colors = ['#006837','#31a354', '#78c679', '#addd8e', '#d9f0a3', '#f7fcb9',
              '#c9bc87', '#a69165', '#856b49', '#664830', '#ad9591', '#d7ccca']
    return LinearSegmentedColormap.from_list("elevation_cmap", colors)

# Read terrain data
terrain_data = Dataset(r"E:\1xinan_data\xinan.nc")
z = terrain_data.variables['z'][:]  # Terrain height variable
lat_terrain = terrain_data.variables['lat'][:]
lon_terrain = terrain_data.variables['lon'][:]

# Read Southwest region boundary
sf = shapefile.Reader('D:/xinandata/XI_NAN/xinan.shp')
shapes = sf.shapes()
shap = Reader('D:/xinandata/XI_NAN/xinan.shp').geometries()
xinan = cfeature.ShapelyFeature(shap, crs=ccrs.PlateCarree(), edgecolor='k', facecolor='none')

# Create Southwest region polygon boundary
xinan_polygons = []
for shape in sf.shapeRecords():
    points = shape.shape.points
    parts = shape.shape.parts
    for i in range(len(parts)):
        start = parts[i]
        if i == len(parts)-1:
            end = len(points)
        else:
            end = parts[i+1]
        polygon = Polygon(points[start:end])
        xinan_polygons.append(polygon)
xinan_union = MultiPolygon(xinan_polygons).buffer(0)
prepared_xinan = prep(xinan_union)

# Create mask array
mask = np.ones_like(z, dtype=bool)
for i in range(len(lon_terrain)):
    for j in range(len(lat_terrain)):
        # Check if each point is within the Southwest region polygon
        point = Point(lon_terrain[i], lat_terrain[j])
        if not prepared_xinan.contains(point):
            mask[j, i] = False

# Apply mask
z_masked = np.ma.masked_where(~mask, z)

# Create figure
fig = plt.figure(figsize=(12, 8), dpi=300)
ax = fig.add_subplot(111, projection=ccrs.PlateCarree())

# Set map extent
ax.set_extent([97, 112.5, 20, 35], crs=ccrs.PlateCarree())

# Set height color bar range [50, 5000]
vmin, vmax = 50, 5000

# Draw terrain contour lines (using masked data)
elev_cmap = create_cmap()
contour = ax.contourf(lon_terrain, lat_terrain, z_masked,
                      levels=np.linspace(vmin, vmax, 20),  # Set 20 levels
                      cmap=elev_cmap,
                      vmin=vmin, vmax=vmax,  # Set display range
                      transform=ccrs.PlateCarree(),
                      extend='both')  # Show colors beyond range

# Add color bar
cbar = plt.colorbar(contour, ax=ax, orientation='vertical', pad=0.05, shrink=0.7)
cbar.set_label('Elevation (m)', fontsize=12)
cbar.ax.tick_params(labelsize=10)

# Add Southwest region boundary
ax.add_feature(xinan, linewidth=1.5, zorder=10)

# Set axis
lon_formatter = LongitudeFormatter()
lat_formatter = LatitudeFormatter()
ax.set_xticks([100, 105, 110], crs=ccrs.PlateCarree())
ax.set_yticks([20, 25, 30, 35], crs=ccrs.PlateCarree())
ax.xaxis.set_major_formatter(lon_formatter)
ax.yaxis.set_major_formatter(lat_formatter)
ax.gridlines(draw_labels=False, linewidth=0.5, color='gray', alpha=0.5, linestyle='--')

# Add legend and title
ax.legend(loc='upper right', fontsize=10)
ax.set_title('Topographic map of SWC', fontsize=14, pad=20)
plt.tight_layout()
plt.show()

# Close NetCDF file
terrain_data.close()
Reference Image:
END

Private message in the background:The Eighth Galaxy
Please do not reply with words other thanThe Eighth Galaxyto join the group
This article is edited by
The Eighth Galaxy – Xinyue